9 Zooplankton Abundance Anomalies - Principal Components
Description: These data represent an ecosystem-level look at zooplankton community composition using the dimension reduction technique of principal component analysis.
Indicator family:
Contributor(s): Ryan Morse, Harvey Walsh
Affiliations: NEFSC
9.1 Introduction to Indicator
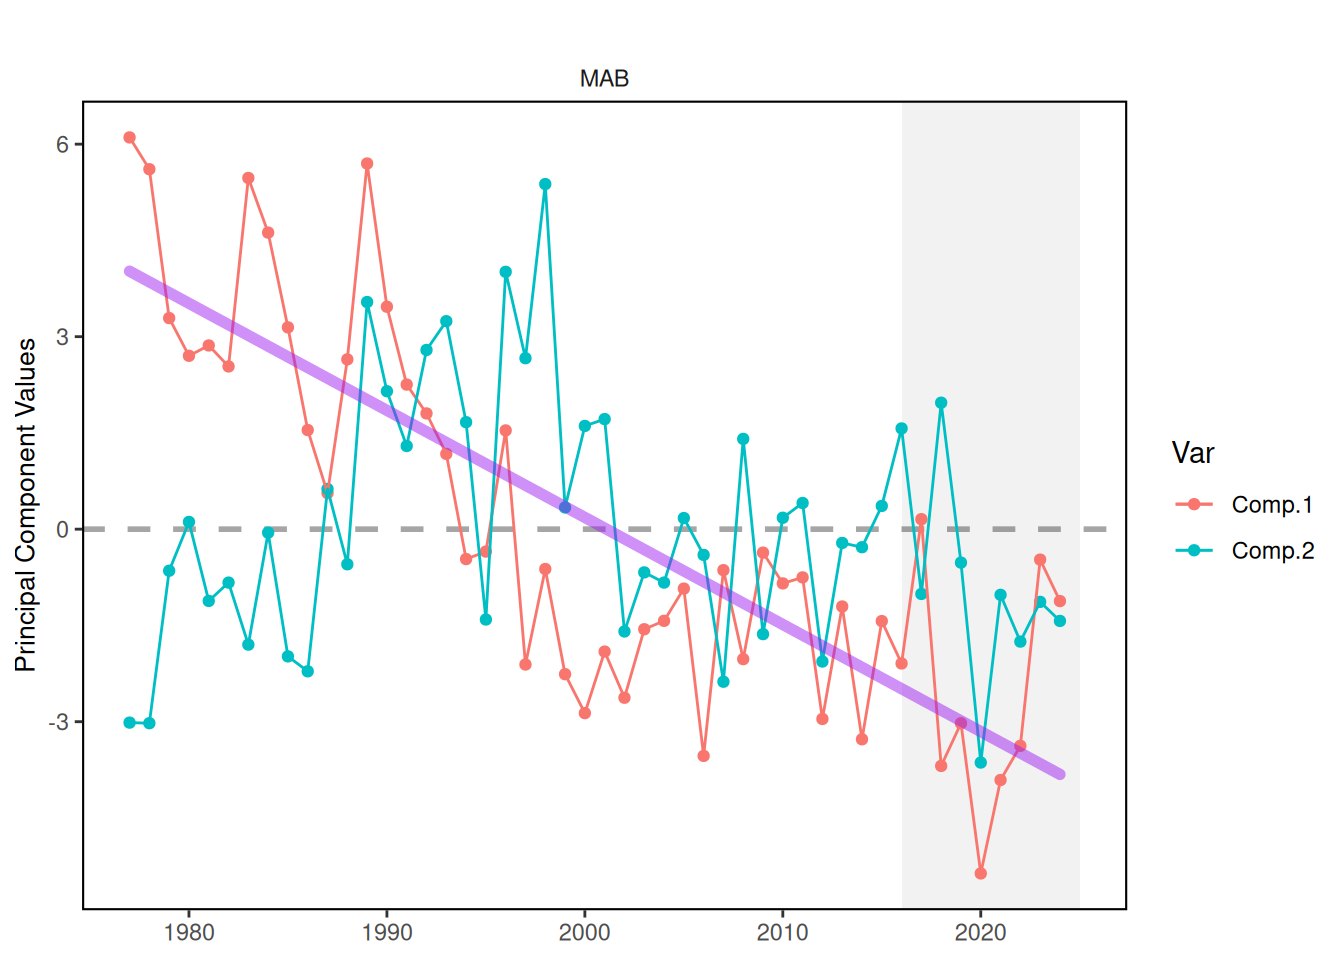
Principal component analysis (PCA) is a technique used to reduce complexity in ecological data. We ran a PCA on the annual abundance anomalies of the dominant zooplankton taxa for each EPU and for the Northeast Shelf as a whole. The abundance anomalies were calculated similarly to Kane ([28]) by first log transforming the zooplankton abundance data and then estimating a daily expected abundance value for each taxa using an annual spline based on all years of data. To determine the abundance anomalies, the expected abundance value on the day the sample was collected was subtracted from the observed abundance value for each taxa for each EPU. These values were aggregated by EPU and year. The PCA scores from the first and second principal components of the annual abundance anomalies area shown in these figures. PCA scores range from positive to negative values. However, there is no distinct or implied meaning of either ‘positive’ or ‘negative’ values. Instead, when plotted as a time series and the series crosses the horizontal axis Y=0 line, this may represent an implied change in state. Major changes in zooplankton community composition, sometime referred to as regime shifts, may be represented by a change in the state of the PCA series.
9.2 Key Results and Visualizations
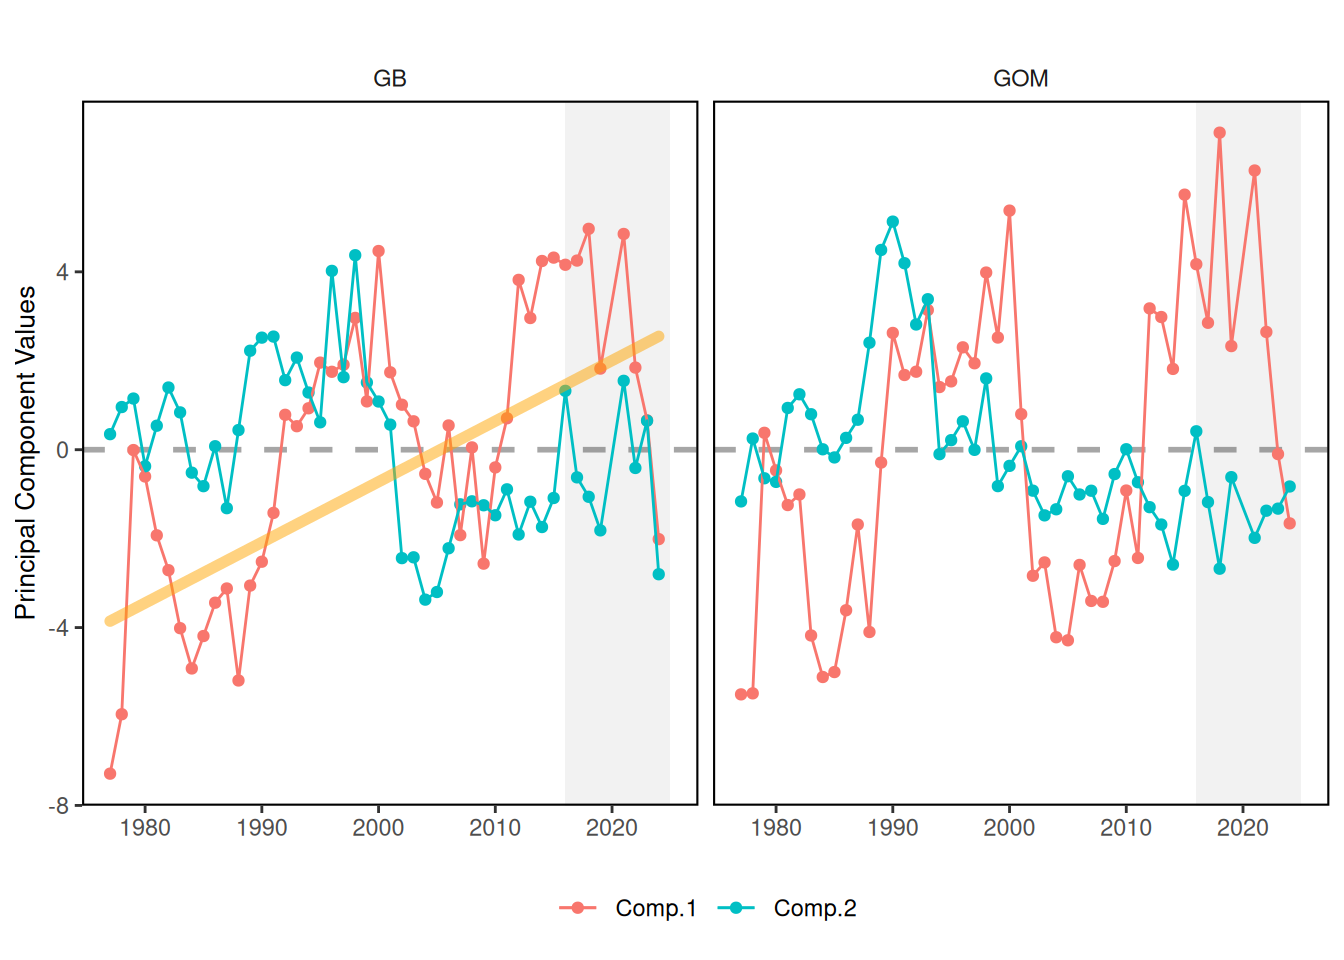
For the GOM, PC1 changed from a positive to a negative during 2023, which may indicate a major structural change in community composition. Previous changes in the state of PC1 (1990, 2001, 2011) have coincided with identified regime shifts in zooplankton, fish recruitment patterns, and changes in fish condition. The amount of variability within the GOM zooplankton community explained by PC1 and PC2 is 45% and 12%, respectively.
The loadings for PC1 and PC2 in the GOM are:| Taxa | PC1 | Taxa | PC2 | |
|---|---|---|---|---|
| calfin_100m3 | -0.07 | calfin_100m3 | -0.38 | |
| acarspp_100m3 | -0.04 | calminor_100m3 | -0.34 | |
| cham_100m3 | 0.06 | clauso_100m3 | -0.29 | |
| calminor_100m3 | 0.11 | siph_100m3 | -0.15 | |
| pseudo_100m3 | 0.12 | euph_100m3 | -0.12 | |
| hyper_100m3 | 0.14 | thecos_100m3 | -0.08 | |
| fish_100m3 | 0.15 | para_100m3 | -0.07 | |
| clauso_100m3 | 0.16 | hyper_100m3 | -0.07 | |
| coel_100m3 | 0.16 | euph1_100m3 | -0.07 | |
| echino_100m3 | 0.19 | mlucens_100m3 | -0.05 | |
| para_100m3 | 0.20 | dec_100m3 | -0.04 | |
| poly_100m3 | 0.20 | chaeto_100m3 | -0.04 | |
| dec_100m3 | 0.22 | poly_100m3 | -0.01 | |
| tlong_100m3 | 0.22 | oithspp_100m3 | 0.00 | |
| mlucens_100m3 | 0.22 | evadnespp_100m3 | 0.01 | |
| chaeto_100m3 | 0.23 | gas_100m3 | 0.05 | |
| thecos_100m3 | 0.23 | echino_100m3 | 0.08 | |
| larvaceans_100m3 | 0.24 | coel_100m3 | 0.09 | |
| evadnespp_100m3 | 0.24 | ctyp_100m3 | 0.11 | |
| siph_100m3 | 0.25 | larvaceans_100m3 | 0.13 | |
| euph_100m3 | 0.25 | fish_100m3 | 0.16 | |
| euph1_100m3 | 0.25 | tlong_100m3 | 0.17 | |
| ctyp_100m3 | 0.25 | pseudo_100m3 | 0.36 | |
| oithspp_100m3 | 0.26 | cham_100m3 | 0.42 | |
| gas_100m3 | 0.26 | acarspp_100m3 | 0.44 |
For GB, both PC1 and PC2 changed from a positive to a negative during 2023, which may indicate a major structural change in community composition. PC1 was in a previous positive phase since 2010, while PC has vacillated between positive and negative phases since 2015. Previous changes in the state of PC1 (1992 2002, 2010) have coincided with identified regime shifts in zooplankton, fish recruitment patterns, and changes in fish condition. The amount of variability within the GB zooplankton community explained by PC1 and PC2 is 37% and 13%, respectively.
The loadings for PC1 and PC2 on GB are:| Taxa | PC1 | Taxa | PC2 | |
|---|---|---|---|---|
| pseudo_100m3 | -0.15 | clauso_100m3 | -0.32 | |
| calfin_100m3 | -0.14 | calminor_100m3 | -0.28 | |
| acarspp_100m3 | -0.11 | echino_100m3 | -0.26 | |
| cham_100m3 | 0.05 | chaeto_100m3 | -0.21 | |
| dec_100m3 | 0.11 | calfin_100m3 | -0.19 | |
| chaeto_100m3 | 0.13 | poly_100m3 | -0.15 | |
| fish_100m3 | 0.16 | para_100m3 | -0.14 | |
| hyper_100m3 | 0.16 | larvaceans_100m3 | -0.10 | |
| calminor_100m3 | 0.17 | hyper_100m3 | -0.08 | |
| para_100m3 | 0.17 | euph_100m3 | -0.08 | |
| mlucens_100m3 | 0.18 | coel_100m3 | -0.06 | |
| echino_100m3 | 0.18 | euph1_100m3 | -0.06 | |
| evadnespp_100m3 | 0.19 | siph_100m3 | 0.03 | |
| clauso_100m3 | 0.19 | acarspp_100m3 | 0.03 | |
| ctyp_100m3 | 0.19 | oithspp_100m3 | 0.05 | |
| coel_100m3 | 0.23 | fish_100m3 | 0.05 | |
| tlong_100m3 | 0.23 | thecos_100m3 | 0.08 | |
| euph_100m3 | 0.23 | dec_100m3 | 0.14 | |
| euph1_100m3 | 0.24 | gas_100m3 | 0.22 | |
| poly_100m3 | 0.24 | evadnespp_100m3 | 0.23 | |
| gas_100m3 | 0.24 | tlong_100m3 | 0.23 | |
| thecos_100m3 | 0.25 | cham_100m3 | 0.24 | |
| oithspp_100m3 | 0.27 | pseudo_100m3 | 0.33 | |
| larvaceans_100m3 | 0.28 | mlucens_100m3 | 0.35 | |
| siph_100m3 | 0.28 | ctyp_100m3 | 0.35 |
In the MAB, a long term decline in PC1 resulted in a phase change from positve to negative around the year 1997. PC2 was mostly positive from 1985-2002, after which variability was high and PC2 switched between positive and negative phases multiple times over a 10 year period. Both PC1 and PC2 currently remain in a negative phase since 2019. Taxa contributing to this negative phase include a low abundance for Pseudocalanus spp., and higher abundance of hyperiid amphipods, and echinoderms. The amount of variability explained by PC1 and PC2 in the MAB is 32% and 15%, respectively.
The loadings for PC1 and PC2 in the MAB are:
| Taxa | PC1 | Taxa | PC2 | |
|---|---|---|---|---|
| hyper_100m3 | -0.29 | calminor_100m3 | -0.17 | |
| calminor_100m3 | -0.27 | hyper_100m3 | -0.17 | |
| echino_100m3 | -0.27 | chaeto_100m3 | -0.13 | |
| chaeto_100m3 | -0.27 | fish_100m3 | -0.05 | |
| thecos_100m3 | -0.27 | acarspp_100m3 | -0.04 | |
| siph_100m3 | -0.25 | dec_100m3 | -0.01 | |
| gas_100m3 | -0.24 | para_100m3 | 0.00 | |
| euph_100m3 | -0.24 | echino_100m3 | 0.02 | |
| euph1_100m3 | -0.23 | thecos_100m3 | 0.03 | |
| para_100m3 | -0.21 | calfin_100m3 | 0.07 | |
| oithspp_100m3 | -0.21 | evadnespp_100m3 | 0.09 | |
| coel_100m3 | -0.20 | clauso_100m3 | 0.10 | |
| evadnespp_100m3 | -0.19 | gas_100m3 | 0.12 | |
| clauso_100m3 | -0.18 | euph_100m3 | 0.14 | |
| larvaceans_100m3 | -0.16 | euph1_100m3 | 0.17 | |
| poly_100m3 | -0.11 | siph_100m3 | 0.20 | |
| fish_100m3 | -0.03 | larvaceans_100m3 | 0.20 | |
| dec_100m3 | 0.02 | poly_100m3 | 0.21 | |
| calfin_100m3 | 0.03 | oithspp_100m3 | 0.24 | |
| mlucens_100m3 | 0.05 | ctyp_100m3 | 0.27 | |
| ctyp_100m3 | 0.08 | pseudo_100m3 | 0.30 | |
| tlong_100m3 | 0.15 | coel_100m3 | 0.30 | |
| acarspp_100m3 | 0.16 | cham_100m3 | 0.34 | |
| cham_100m3 | 0.21 | tlong_100m3 | 0.36 | |
| pseudo_100m3 | 0.25 | mlucens_100m3 | 0.40 |
9.3 Indicator statistics
Spatial scale: by EPU and full Northeast Shelf
Temporal scale: Annual
Synthesis Theme:
9.4 Implications
The recent switch in state of PC1 in the GOM and GB may indicate a restructuring of the zooplankton community is underway. These changes may be driven partly by changes in the abundance of Calanus finmarchicus, Centropages typicus, Psuedocalanus spp., and other taxa.
9.5 Get the data
Point of contact: Ryan Morse ryan.morse@noaa.gov
ecodata name: ecodata::zoo_community
Variable definitions
- Name: Comp.1; Definition: Principal Component 1 score; Units: unitless. 2) Name: Comp.2; Definition: Principal Component 2 score; Units: unitless.
Indicator Category:
9.7 Accessibility and Constraints
No response
tech-doc link https://noaa-edab.github.io/tech-doc/zoo_community.html