5 Zooplankton Indices
Description: Model-based abundance and annual center of gravity indices for zooplankton groups sampled by NEFSC surveys
Indicator family:
Contributor(s): Abigail Tyrell, Sarah Gaichas, Harvey Walsh
Affiliations: NEFSC
5.1 Introduction to Indicator
Zooplankton are primary consumers in marine ecosystems that transfer energy from phytoplankton to fish, marine mammals, and birds. The Northeast Fisheries Science Center has conducted zooplankton surveys since the 1970s. Spatially explicit indices of abundance for several zooplankton groups were estimated using spatio-temporal modeling (VAST, [12]; [13]).
The zooplankton groups in the model include:
Copepods
Calanus finmarchicus, = Single species group, used to represent large copepods in the small-large index)
Large copepods ALL: Calanus finmarchicus, Metridia lucens, Calanus minor, Eucalanus spp., Calanus spp.
Small copepods ALL: Centropages typicus, Pseudocalanus spp., T_emora longicornis_, Centropages hamatus, Paracalanus parvus, Acartia spp., Clausocalanus arcuicornis, Acartia longiremis, Clausocalanus furcatus, Temora stylifera, Temora spp., Tortanus discaudatus, Paracalanus spp.
Small copeopods SOE (used to represent small copepods in the small-large index): Centropages typicus, Pseudocalanus spp., Temora longicornis, Centropages hamatus
Euphausiids (krill) modeled as family level group; not differentiated to species in data
Zooplankton volume a metric of total zooplankton; all groups combined displacement volume in the collection net
5.2 Key Results and Visualizations
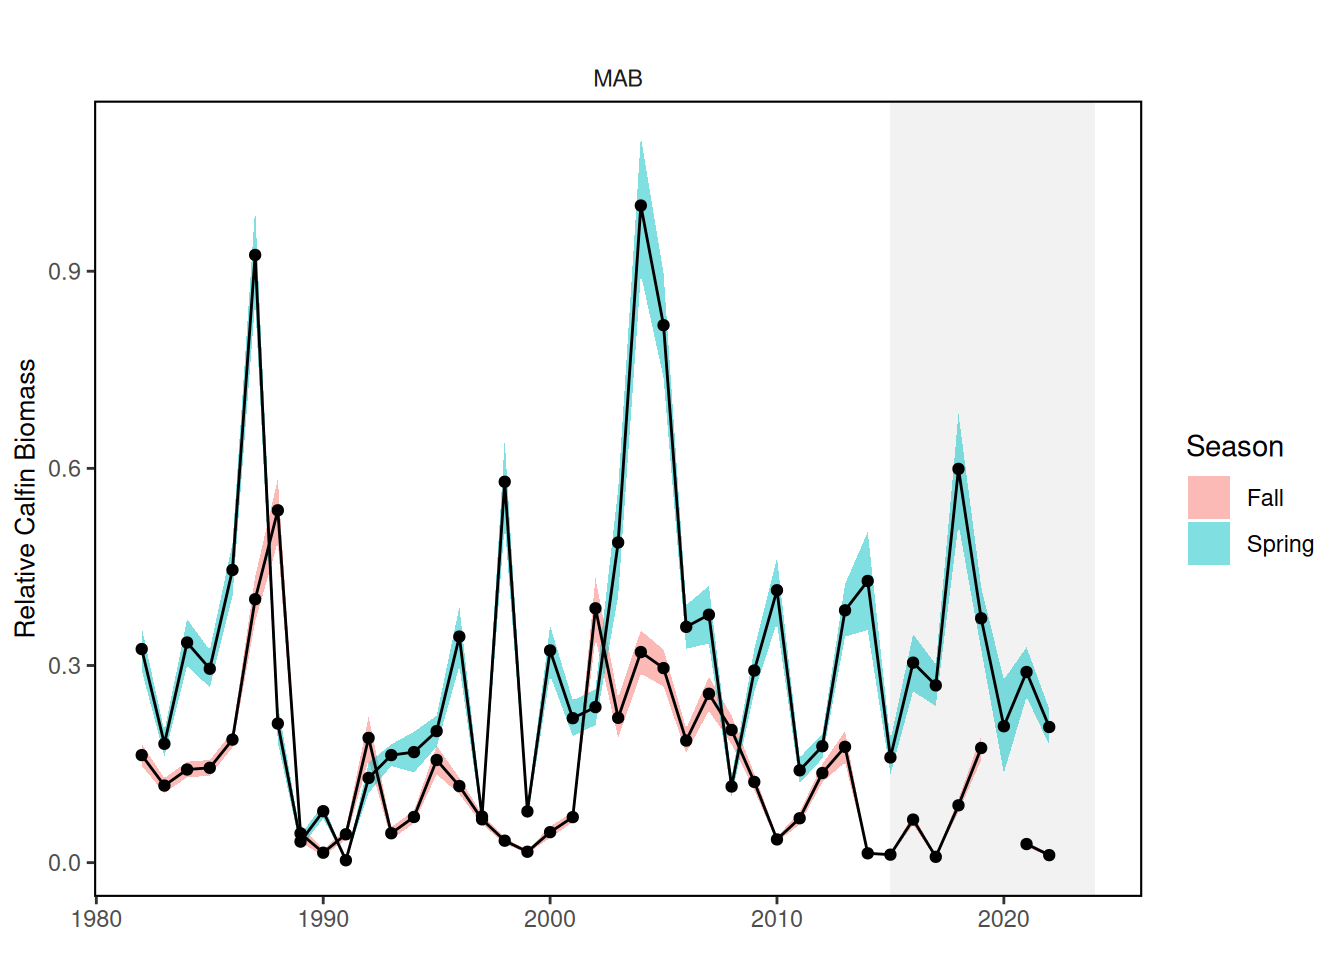
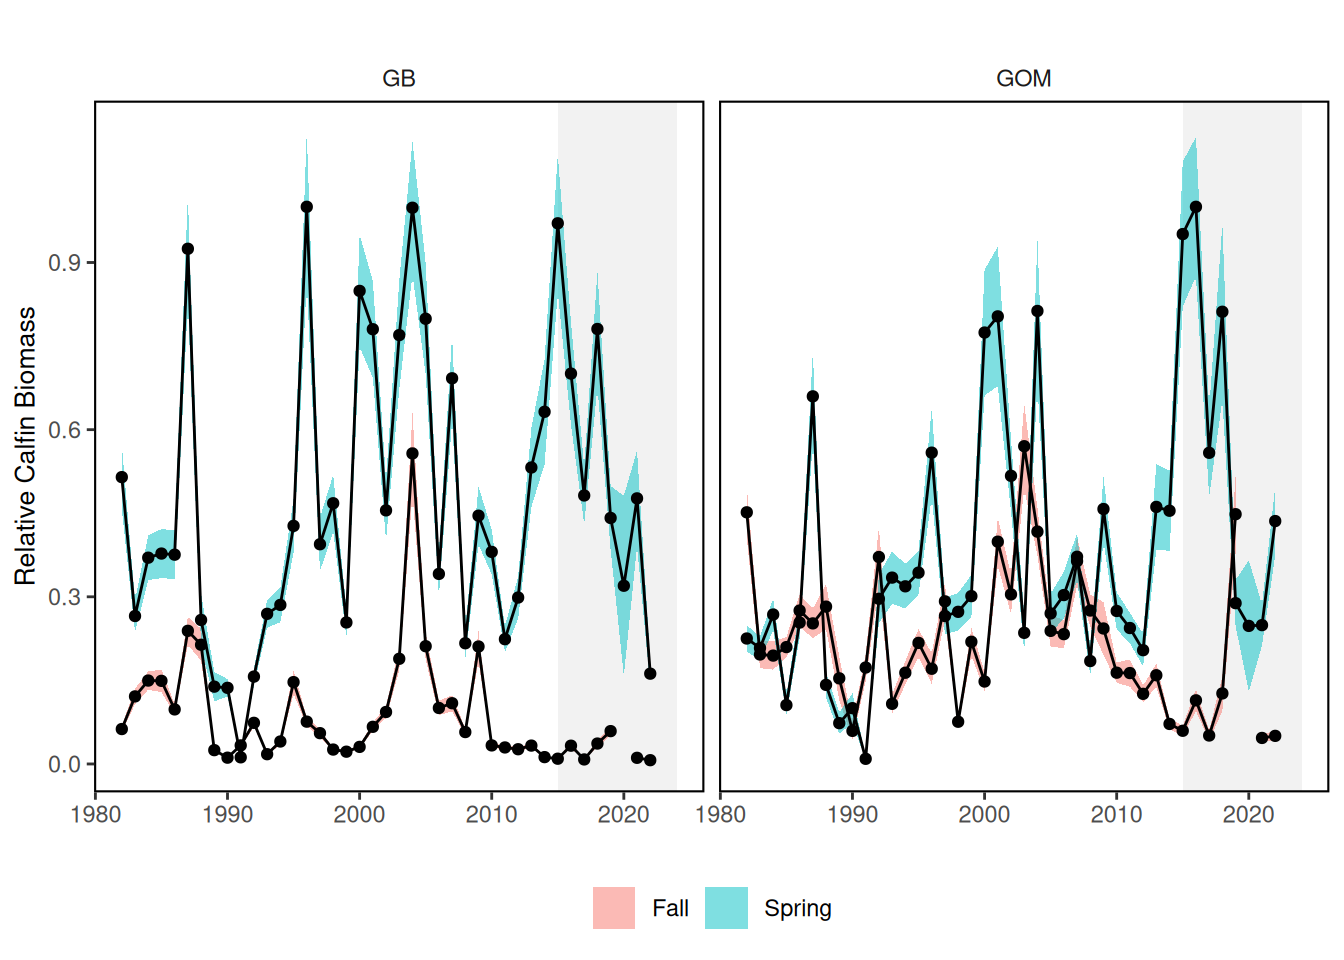
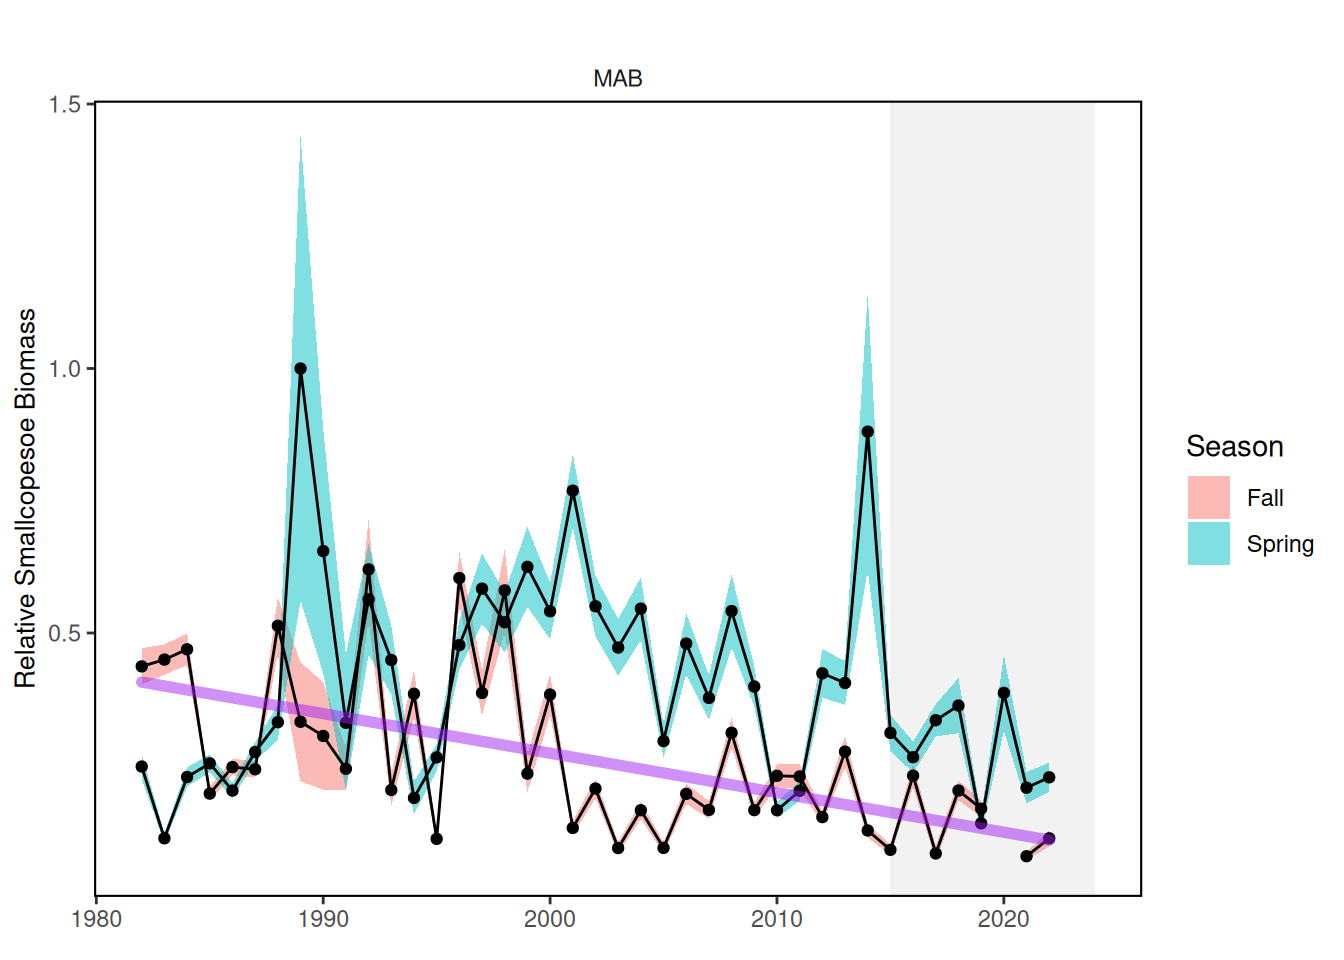
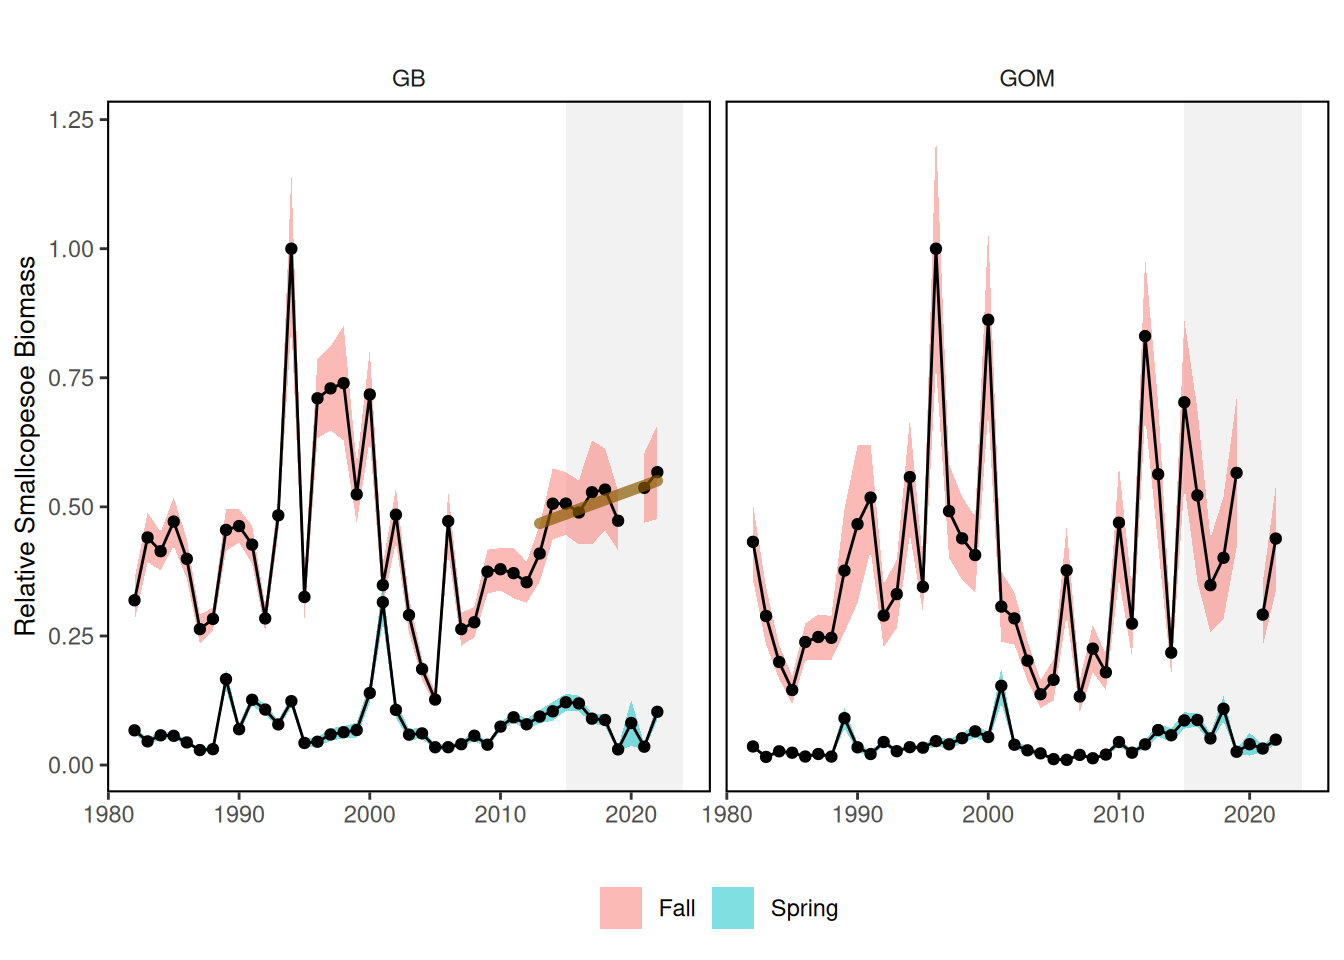
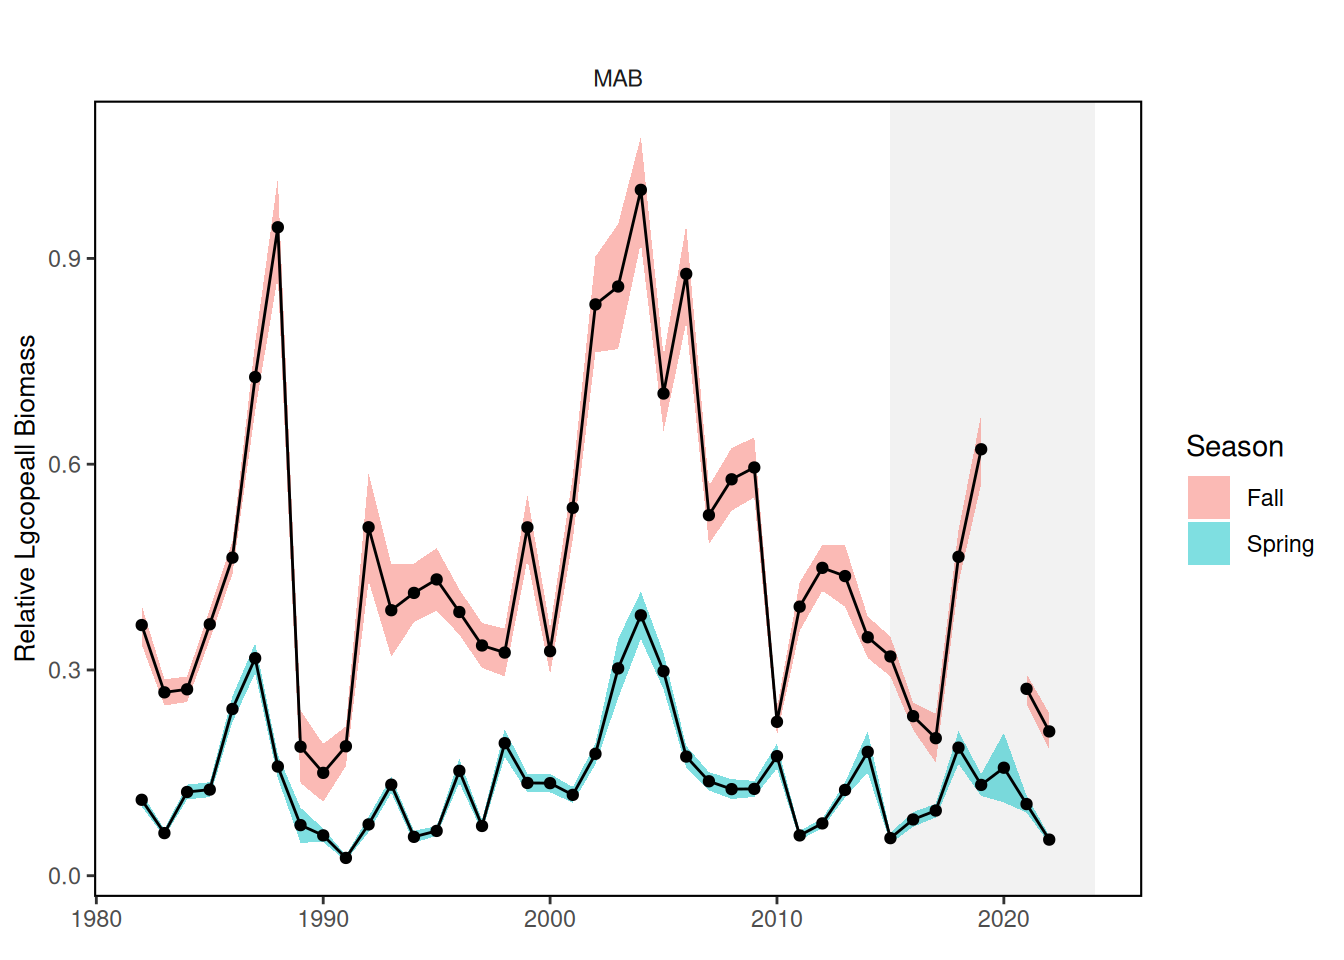
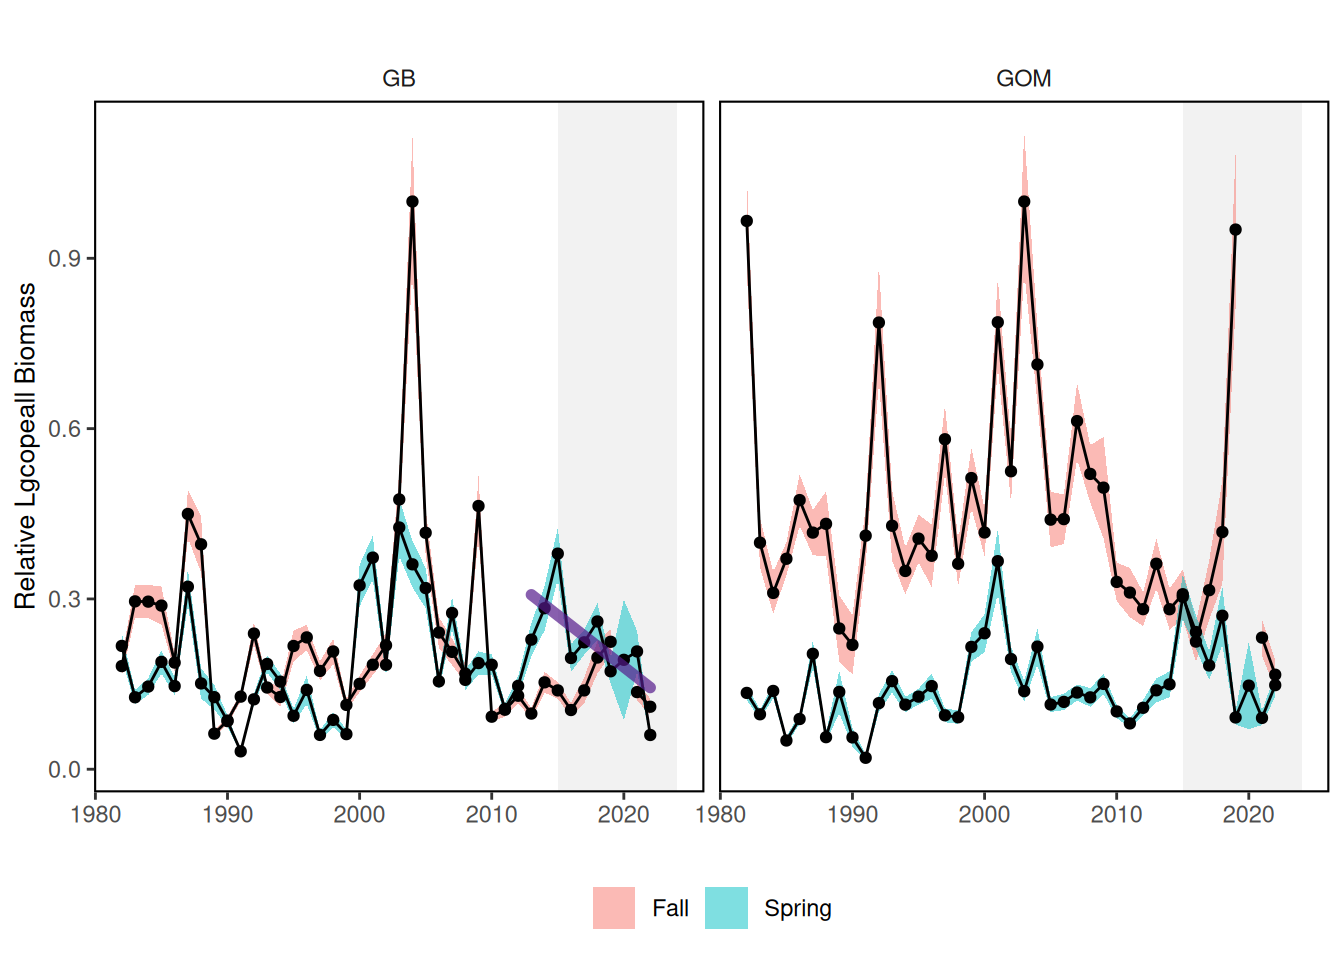
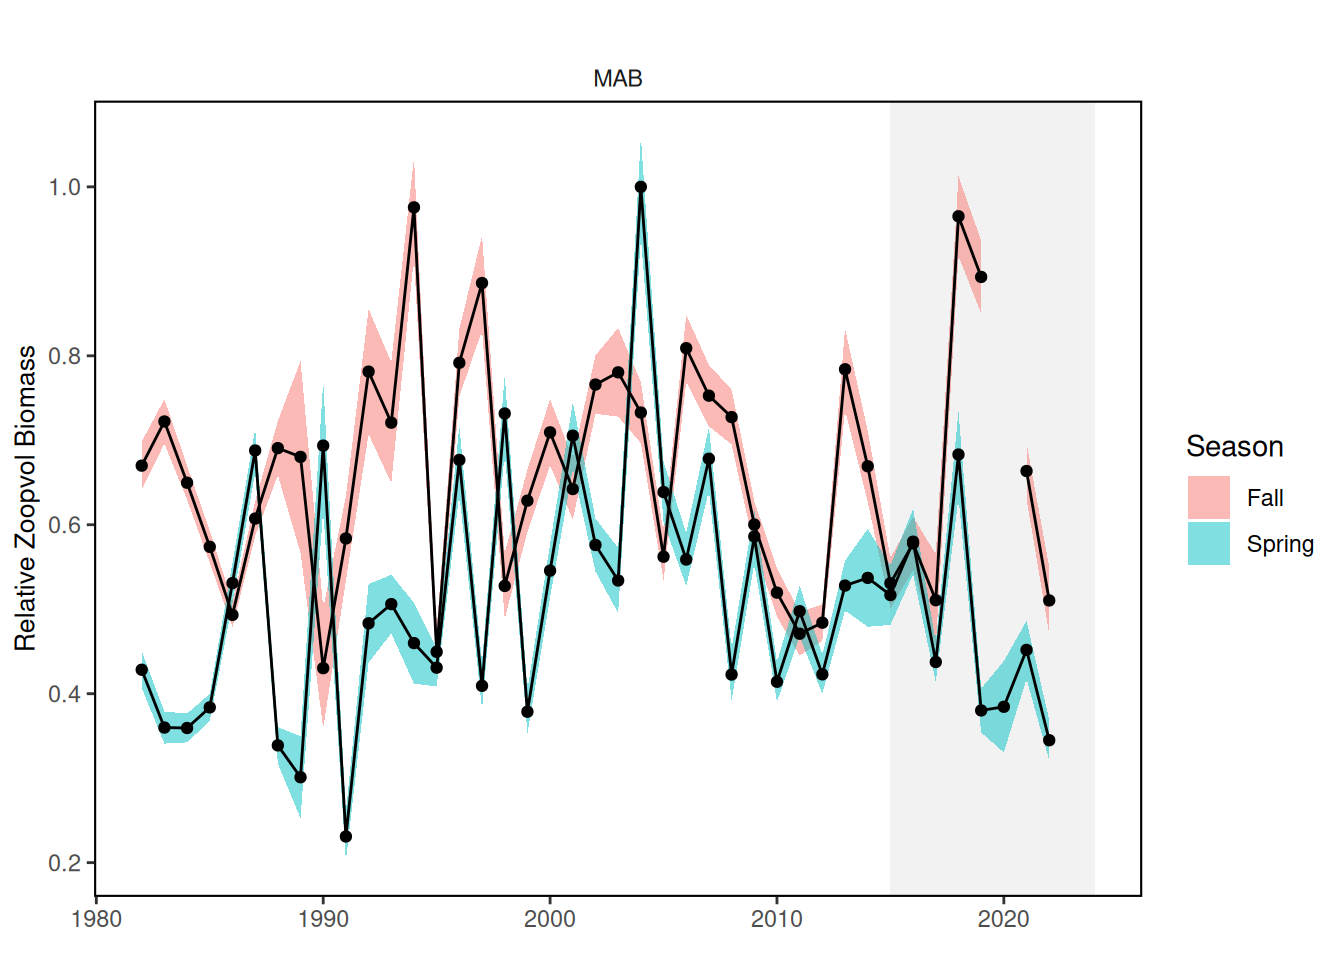
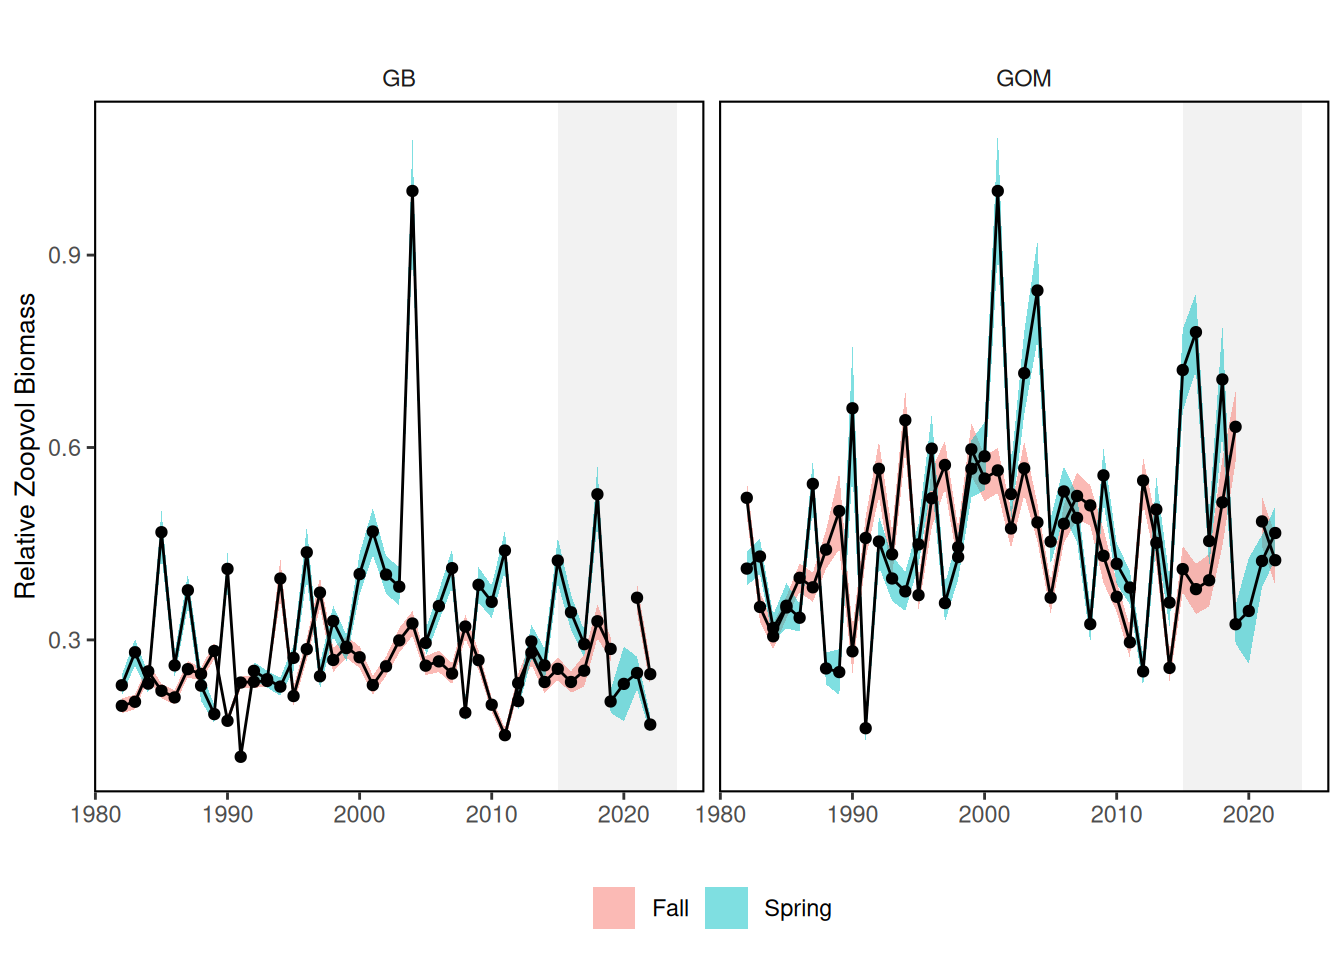
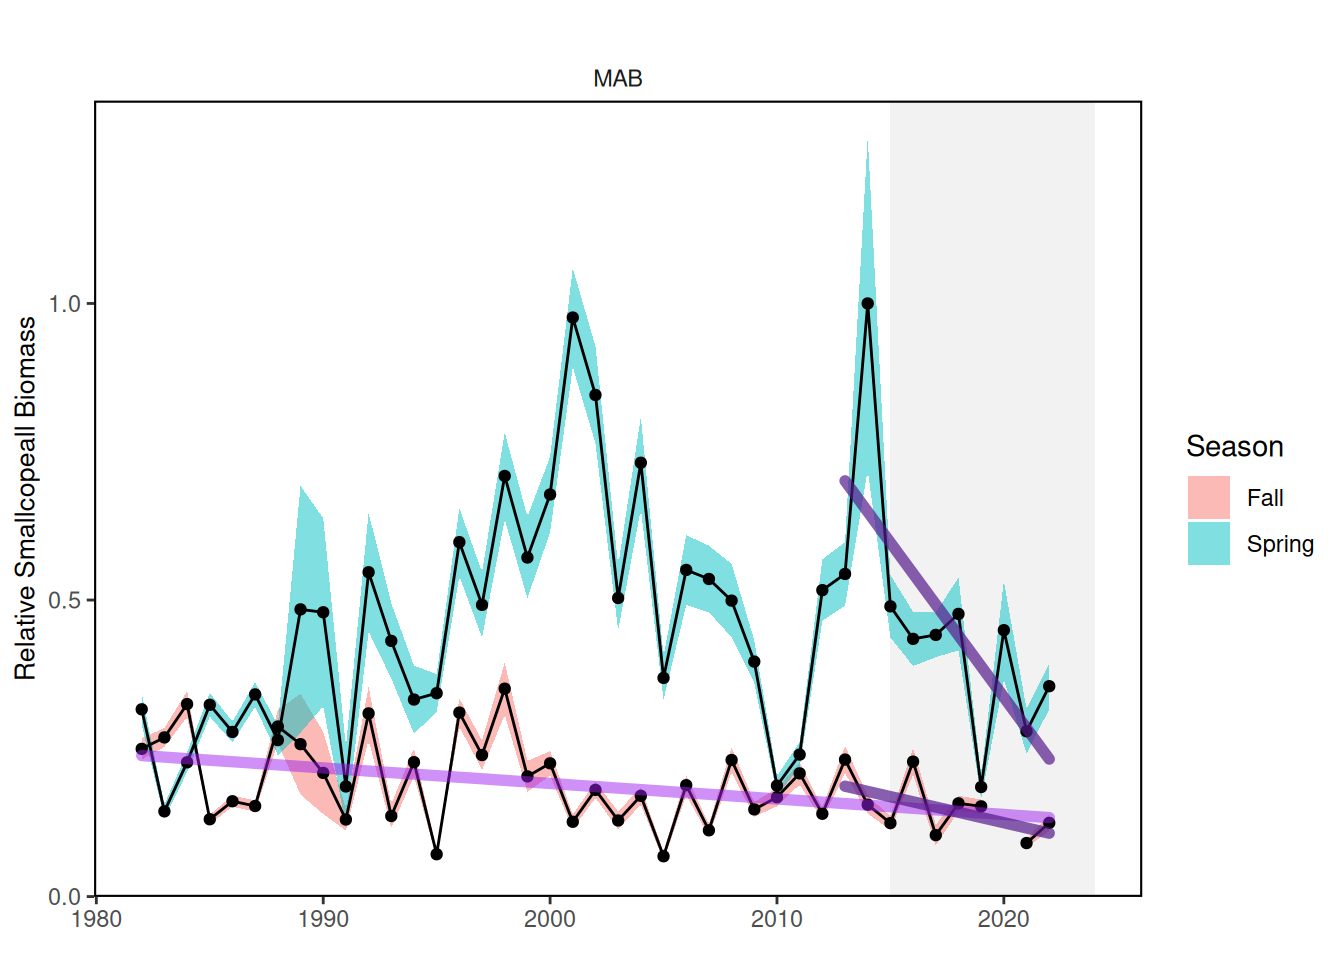
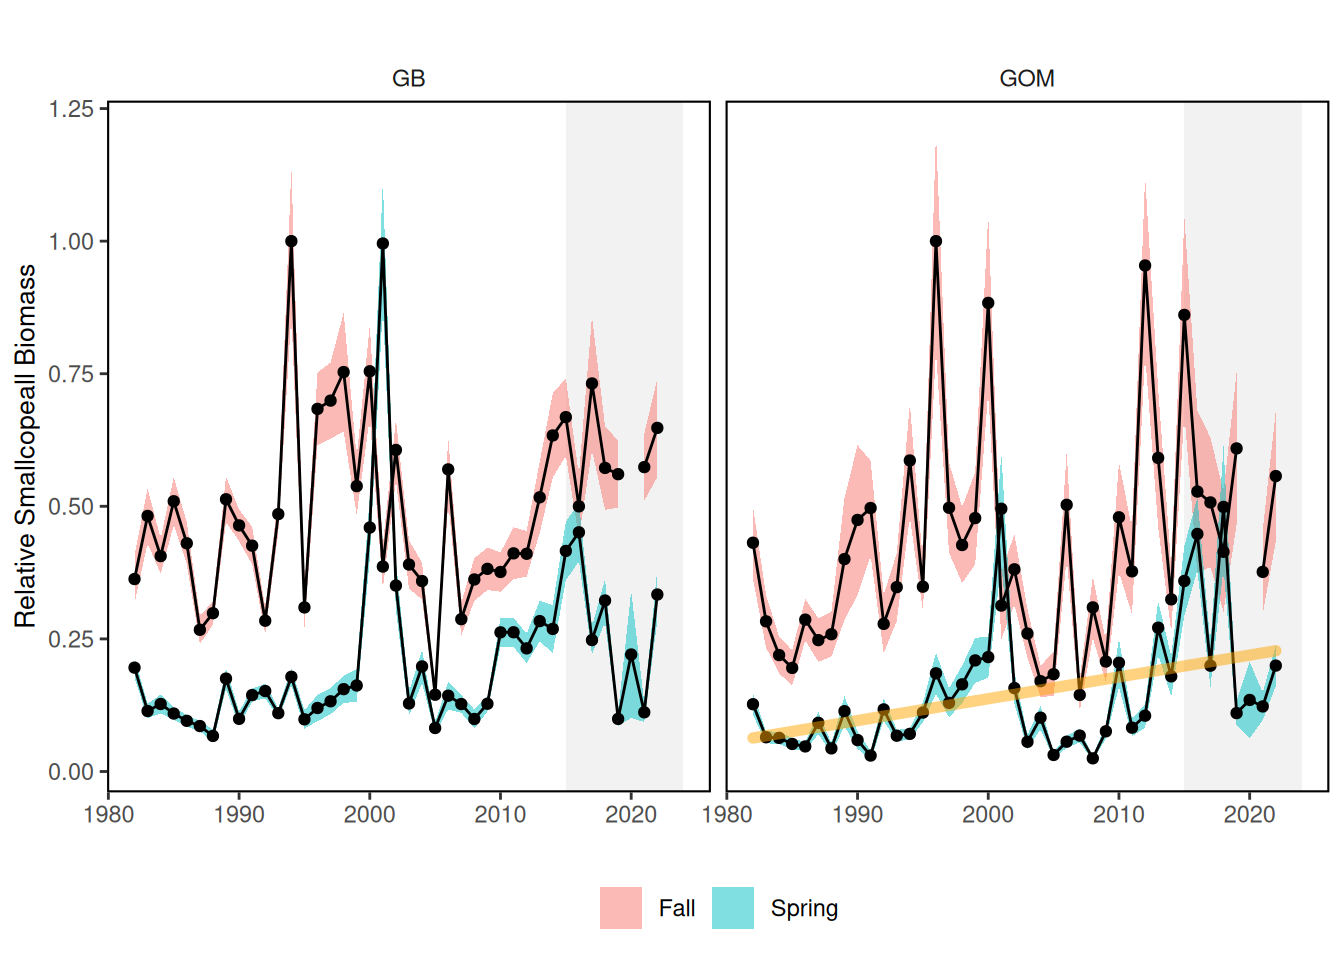
Abundance Large and small copepod groups are mainly fluctuating without trend in both spring and fall across the EPUs. However, a significant long term decrease in small copepods was apparent in the MAB during fall, and a recent decrease during spring. Similarly, zooplankton volume is fluctuating without long term trends over time. A recent significant decline was detected for Spring zooplankton volume in the MAB.
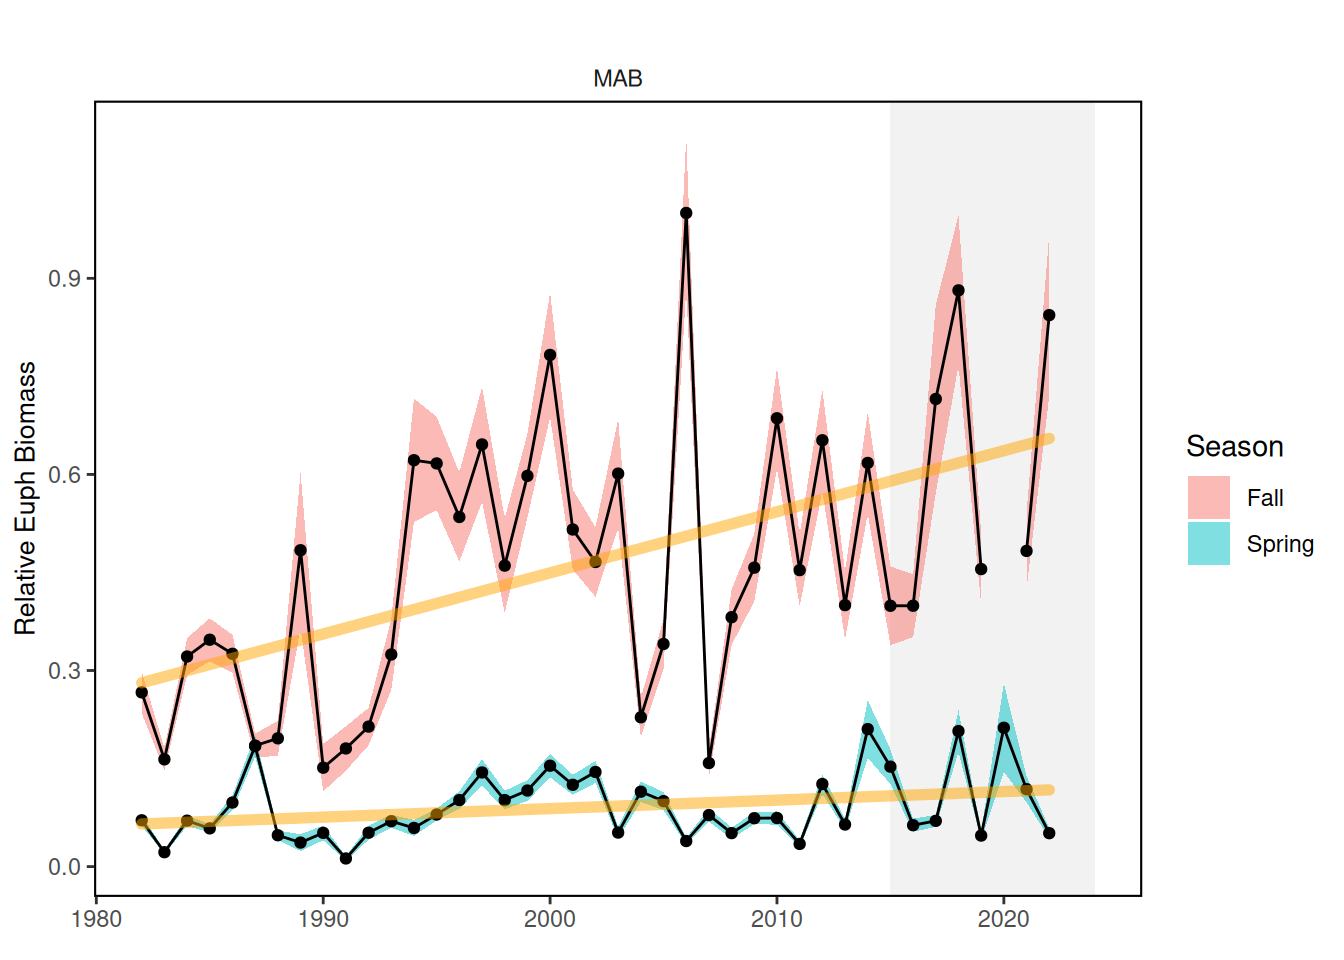
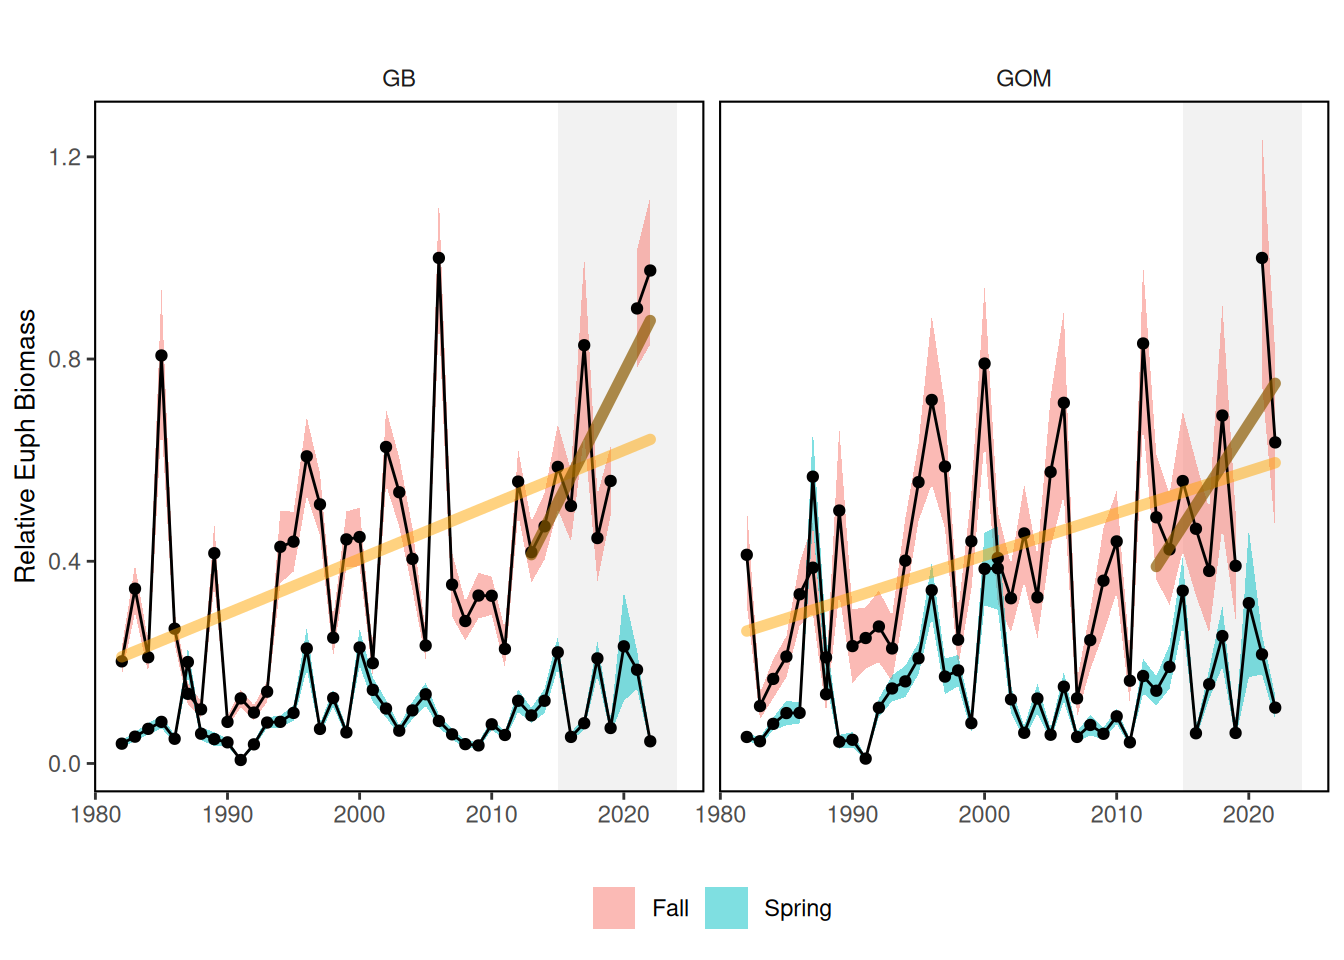
Euphausiids, in contrast, show increasing trends over time in all regions during fall, and in the MAB during spring. In addition, a significant recent increase was detected in the GOM in Fall.
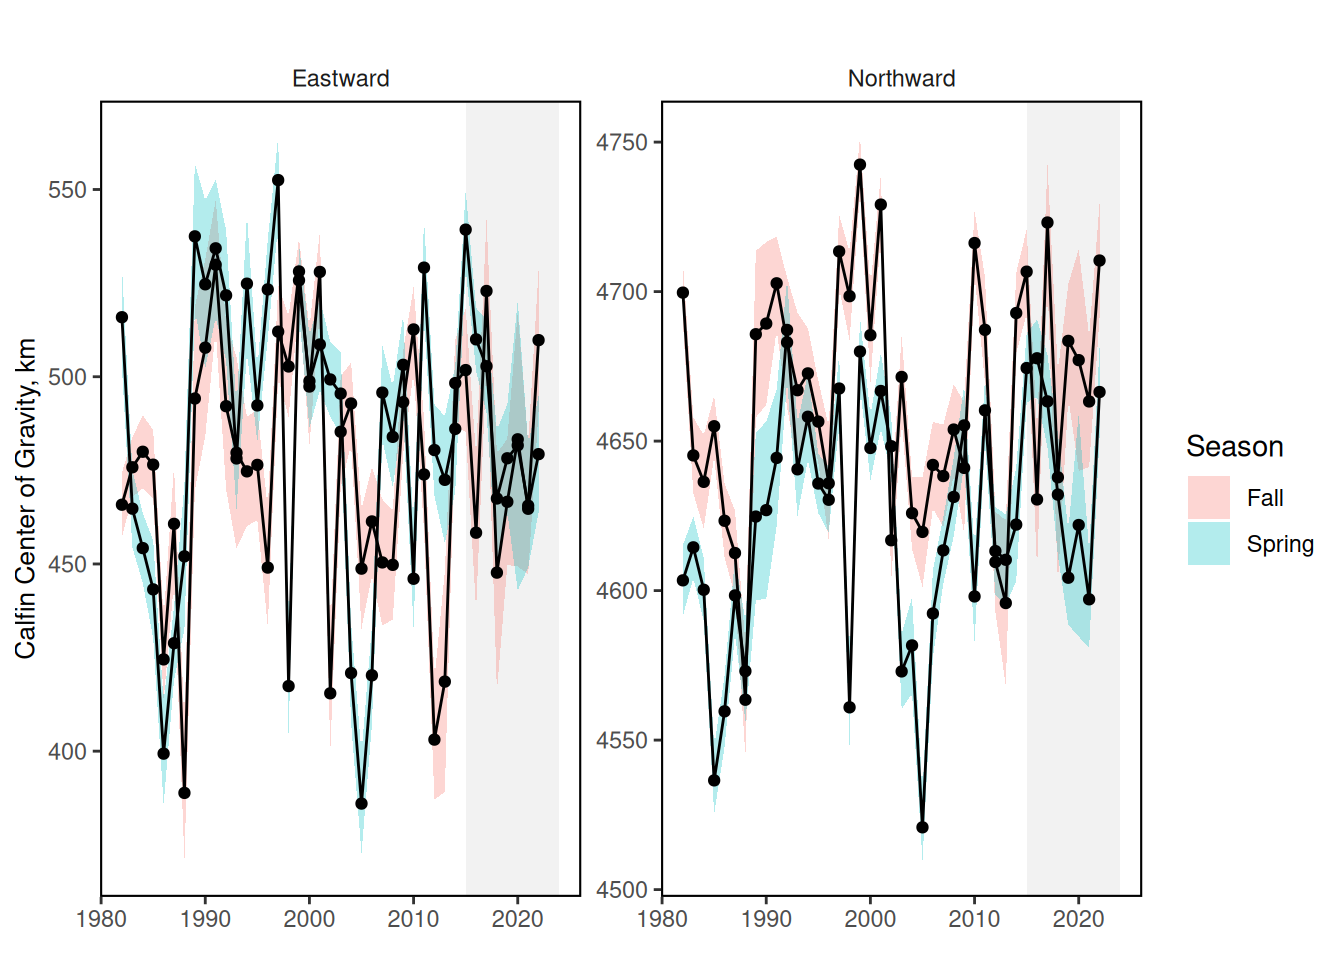
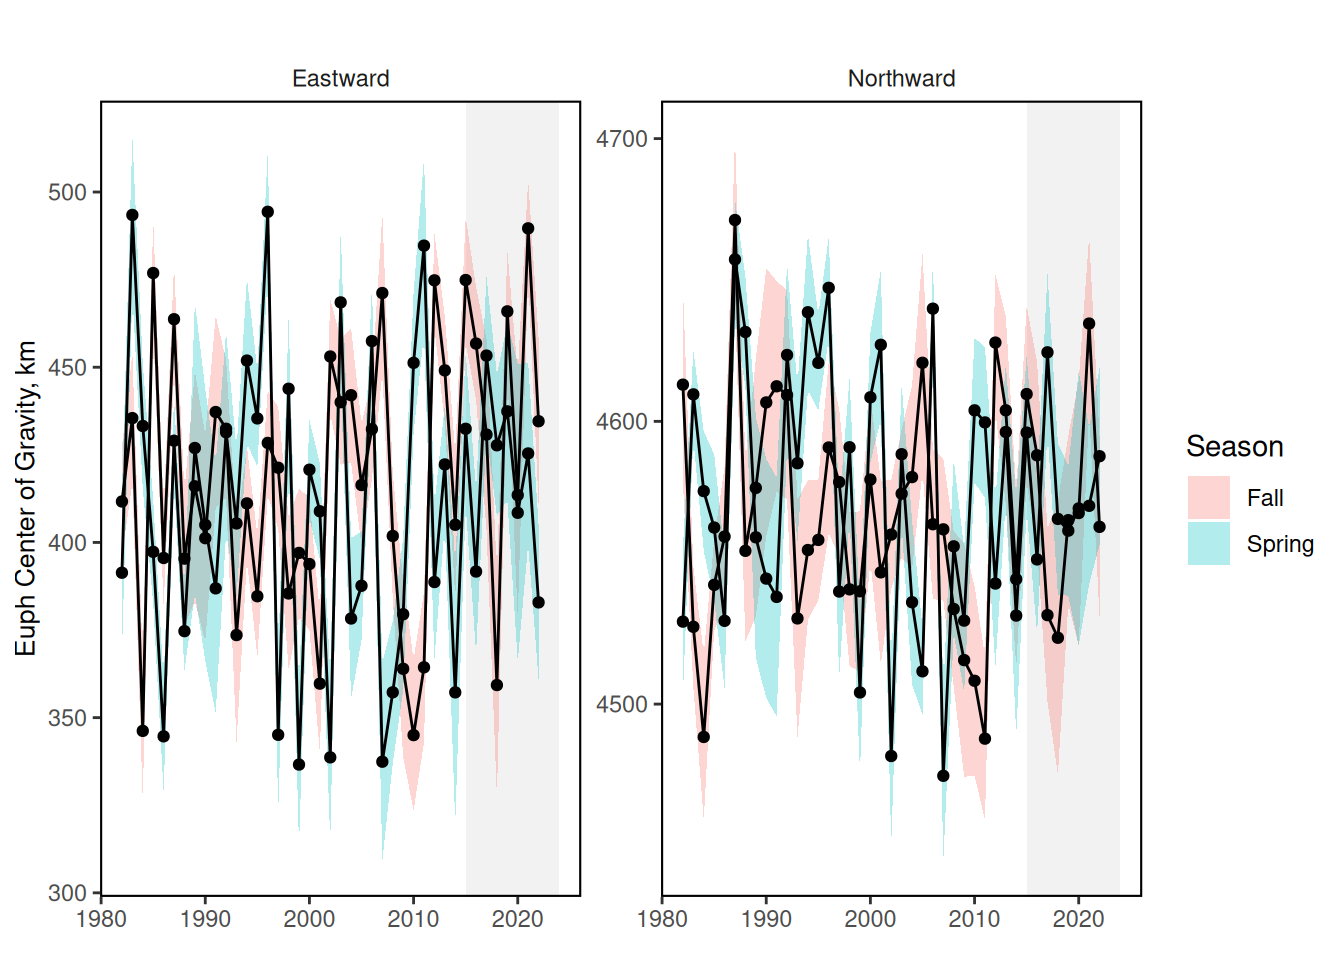
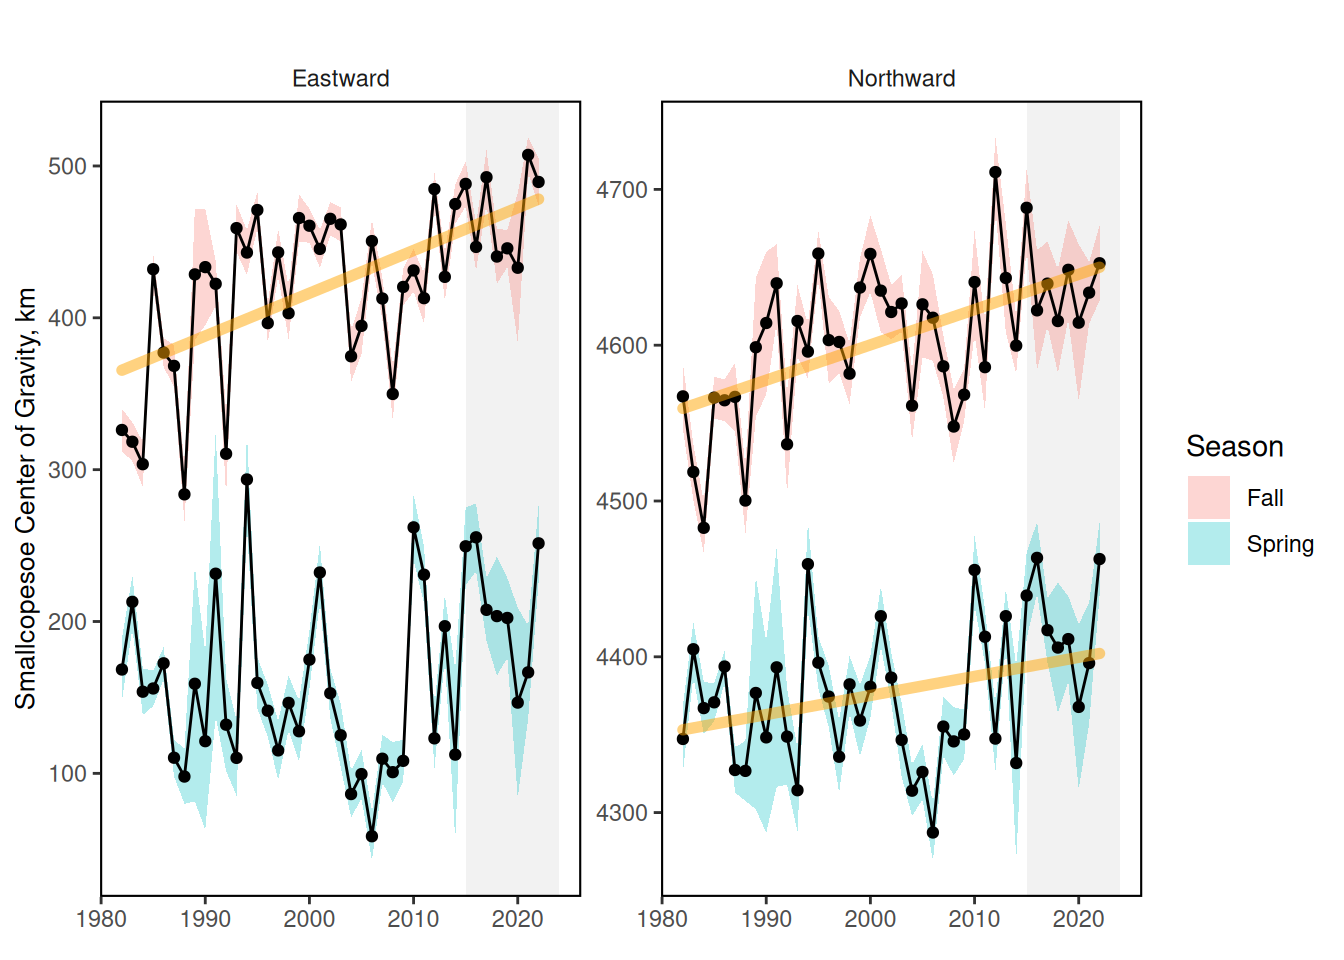
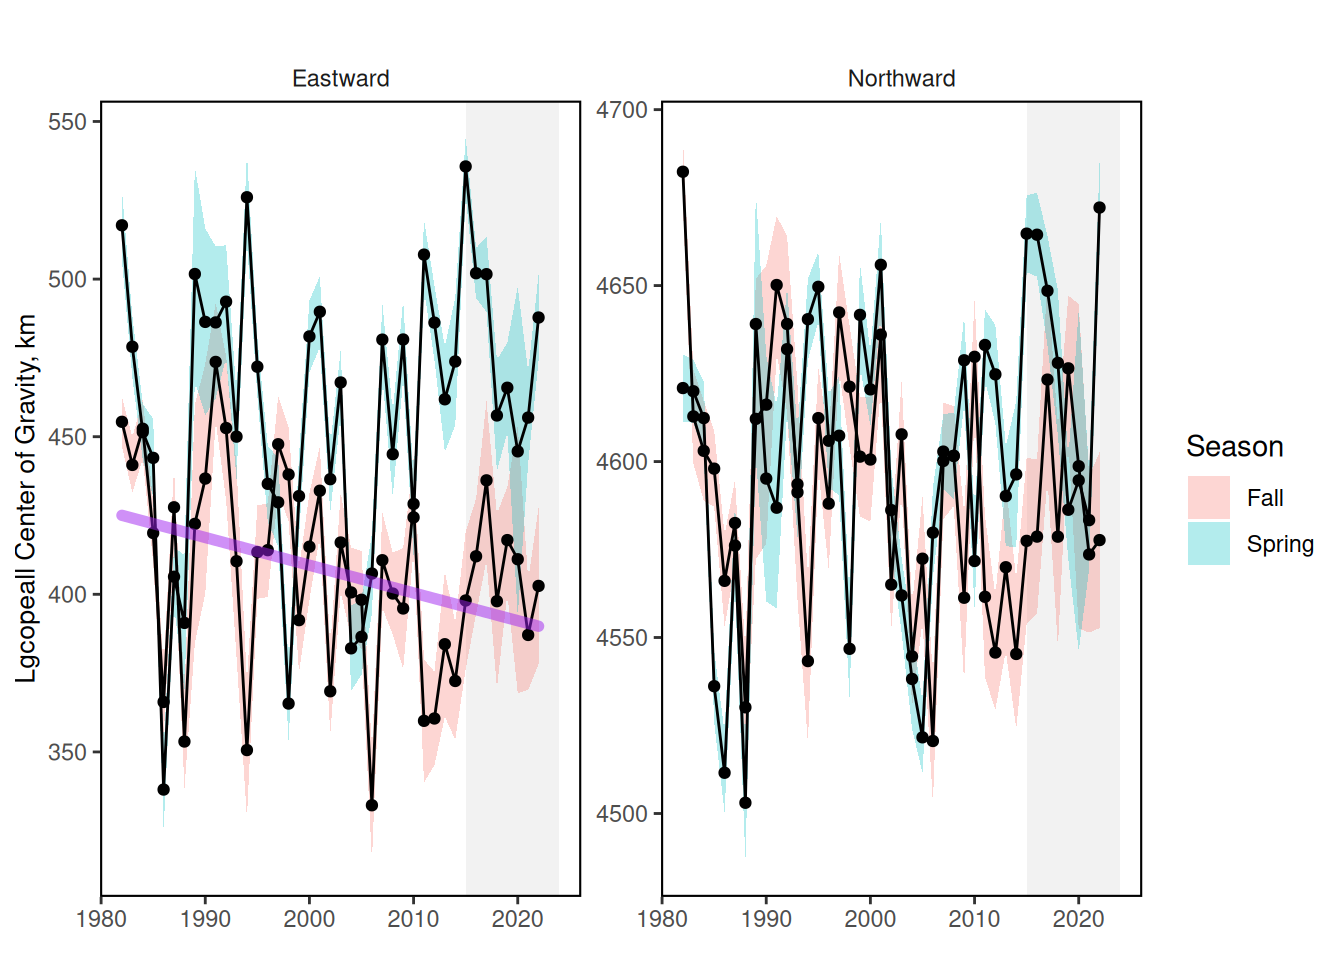
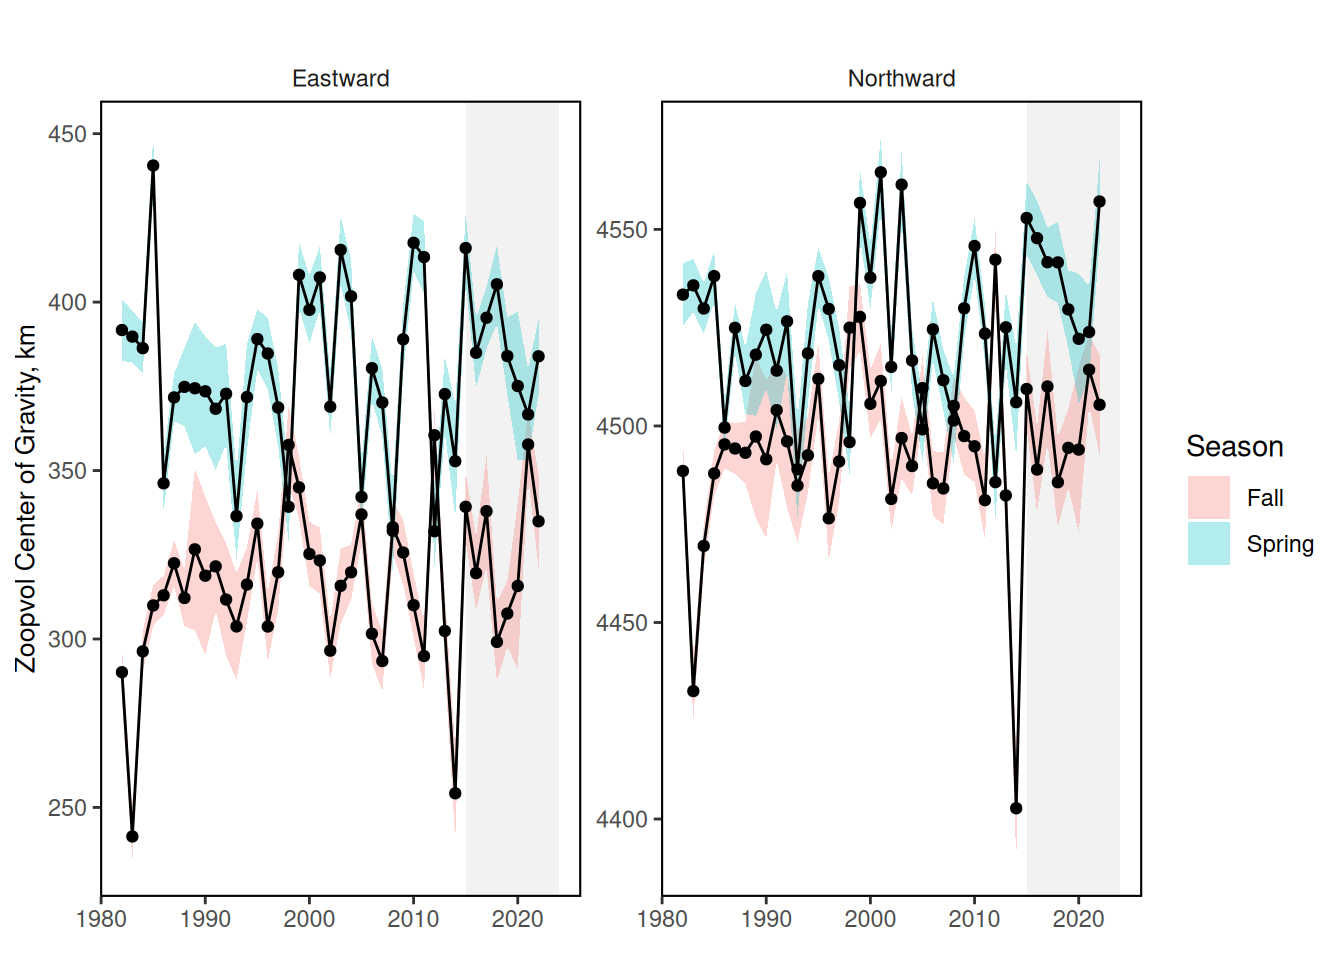
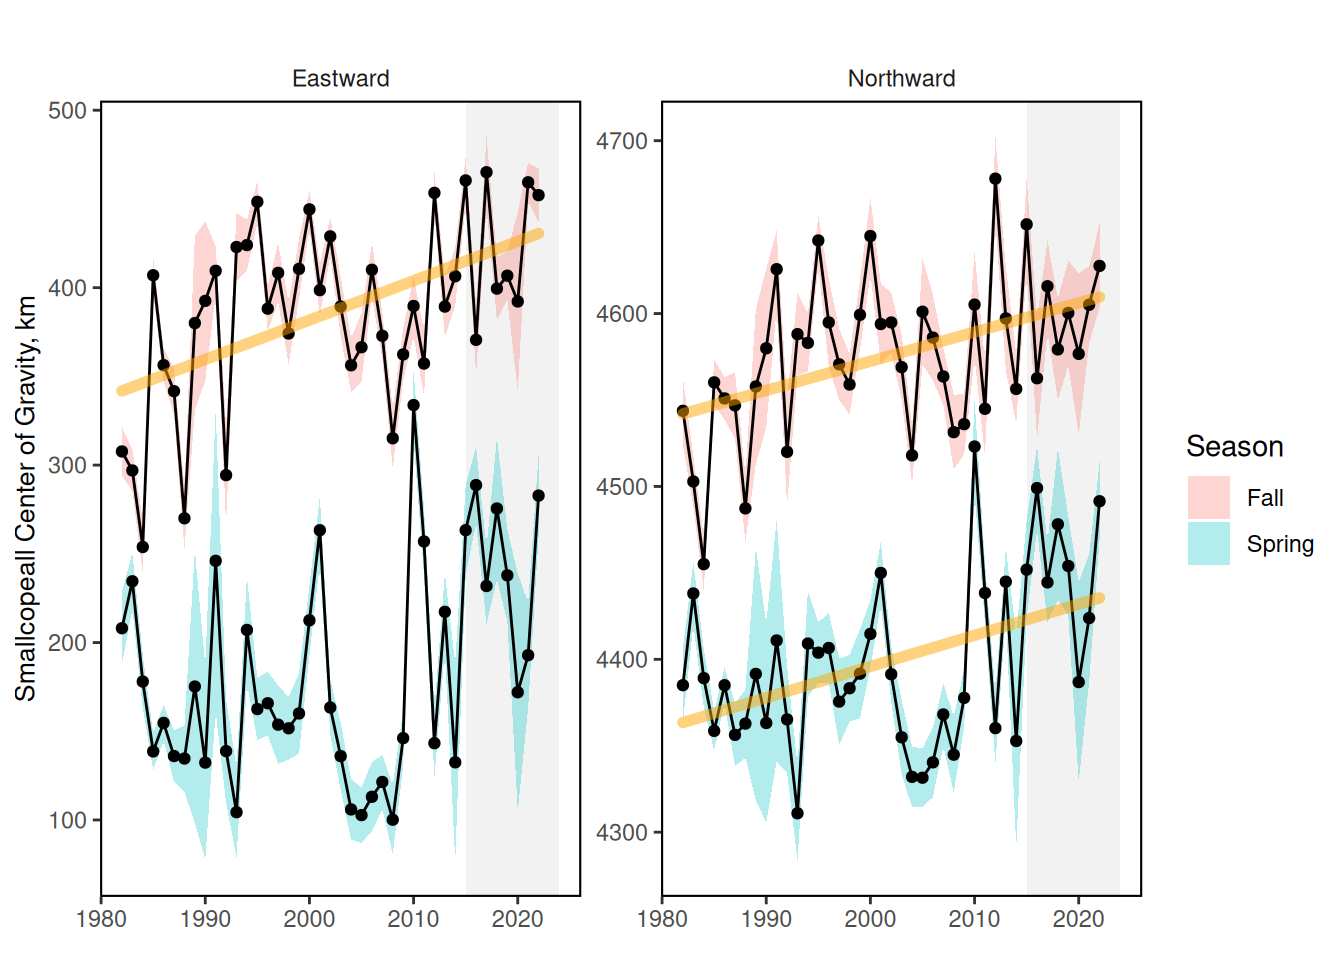
Center of Gravity Small copepods in fall are trending northeast similar to forage fish and aggregated survey species. Small copepods in spring are trending north. Large copepods in fall are trending west, similar to benthos. No significant change for Calfin, Euphausiids, or Zooplankton volume center of gravity over time.


5.3 Indicator statistics
Spatial scale: by EPU and full shelf
Temporal scale: Spring (January-June), Fall (July-December)
Synthesis Theme:
5.4 Implications
Fluctuations in zooplankton community composition can affect both the consumption of phytoplankton vs the export of energy to the benthos, as well as the availability of prey for zooplankton feeding forage fish, marine mammals, and seabirds.
The relative dominance of large and small copepods in Northeast US ecosystems has been liked to changes in fish productivity [[14]; morse_distinct_2017].
Distribution shifts for zooplankton may result in mismatches with zooplankton feeding fish, marine mammal, and seabirds.
5.5 Get the data
Point of contact: EDAB, edab.data@noaa.gov
ecodata name: ecodata::zooplankton_index
Variable definitions
Naming key: 1) Calanus finmarchicus (calfin_100m3) = “calfin” 2) Large copepods (calfin_100m3, mlucens_100m3, calminor_100m3, euc_100m3, calspp_100m3) = “lgcopeALL” 3) Small copepods (all) (ctyp_100m3, pseudo_100m3, tlong_100m3, cham_100m3, para_100m3, acarspp_100m3, clauso, acarlong_100m3, fur_100m3, ost_100m3, temspp_100m3, tort_100m3, paraspp_100m3) = “smallcopeALL” 4) Small copepods (SOE) (ctyp_100m3, pseudo_100m3, tlong_100m3, cham_100m3) = “smallcopeSOE”
Indicator Category:
5.7 Accessibility and Constraints
Request from Harvey Walsh, harvey.walsh@noaa.gov
tech-doc link https://noaa-edab.github.io/tech-doc/zooplankton_index.html