8 Zooplankton Abundance Anomalies
Description: Abundance anomalies for 20 zooplankton taxa
Indicator family:
Contributor(s): Harvey Walsh, Ryan Morse, Kevin Friedland, Mike Jones
Affiliations: NEFSC
8.1 Introduction to Indicator
Zooplankton represent a critical trophic link from primary producers to fish in marine ecosystems.
8.2 Key Results and Visualizations
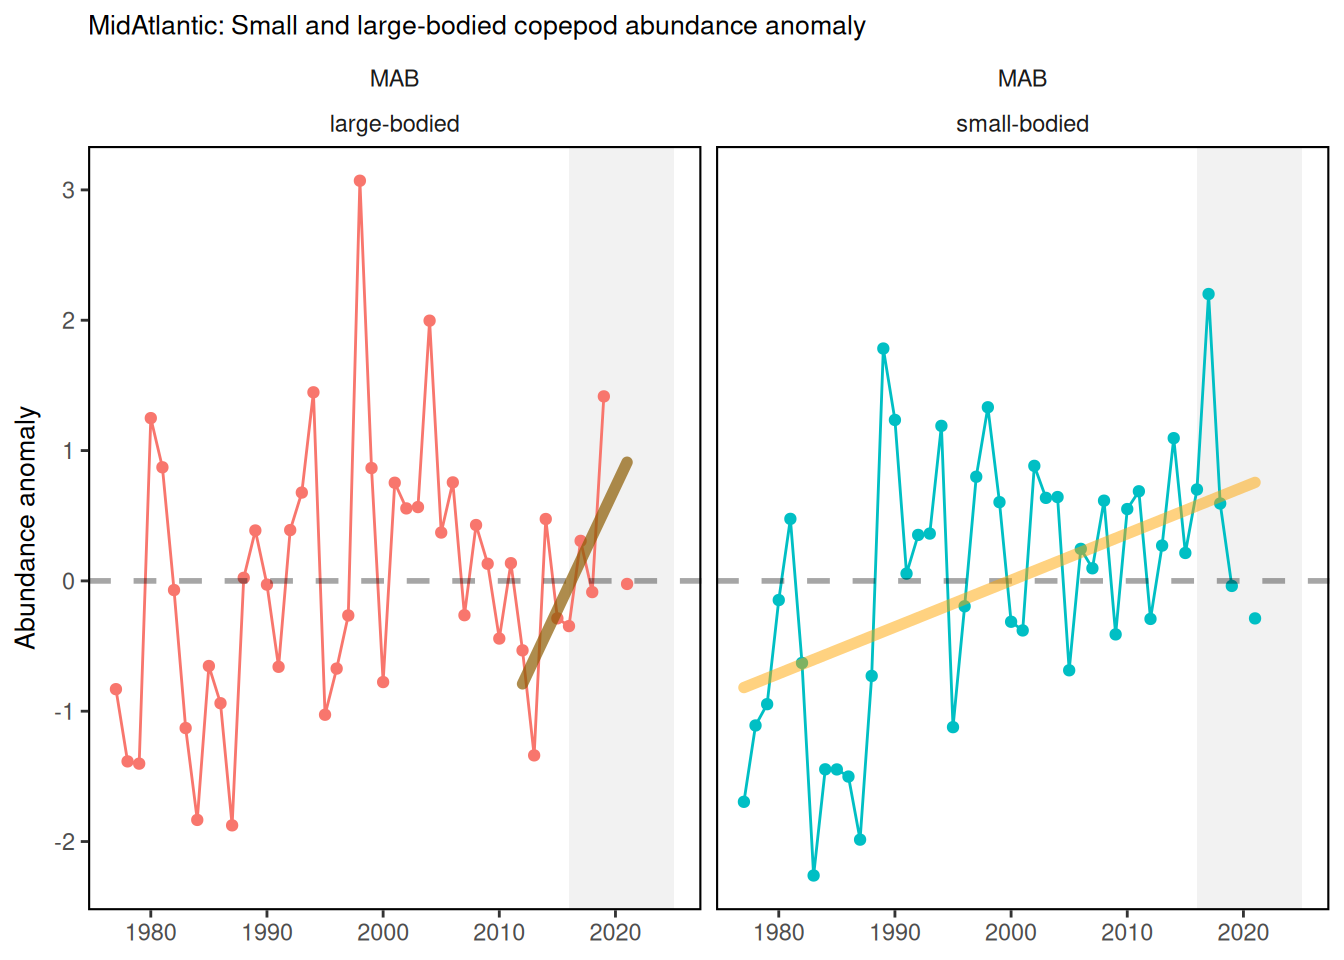
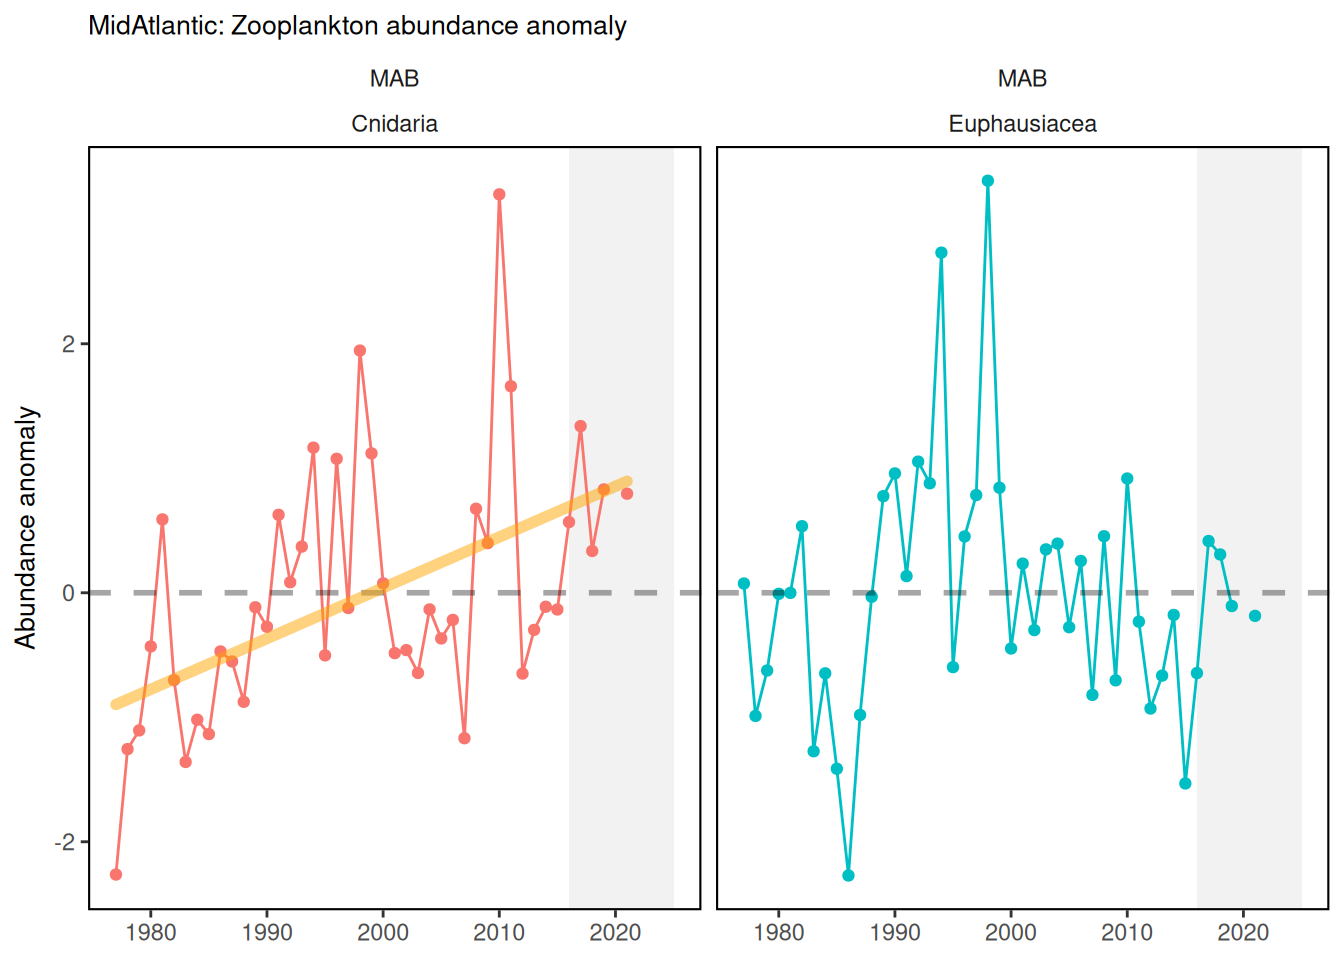
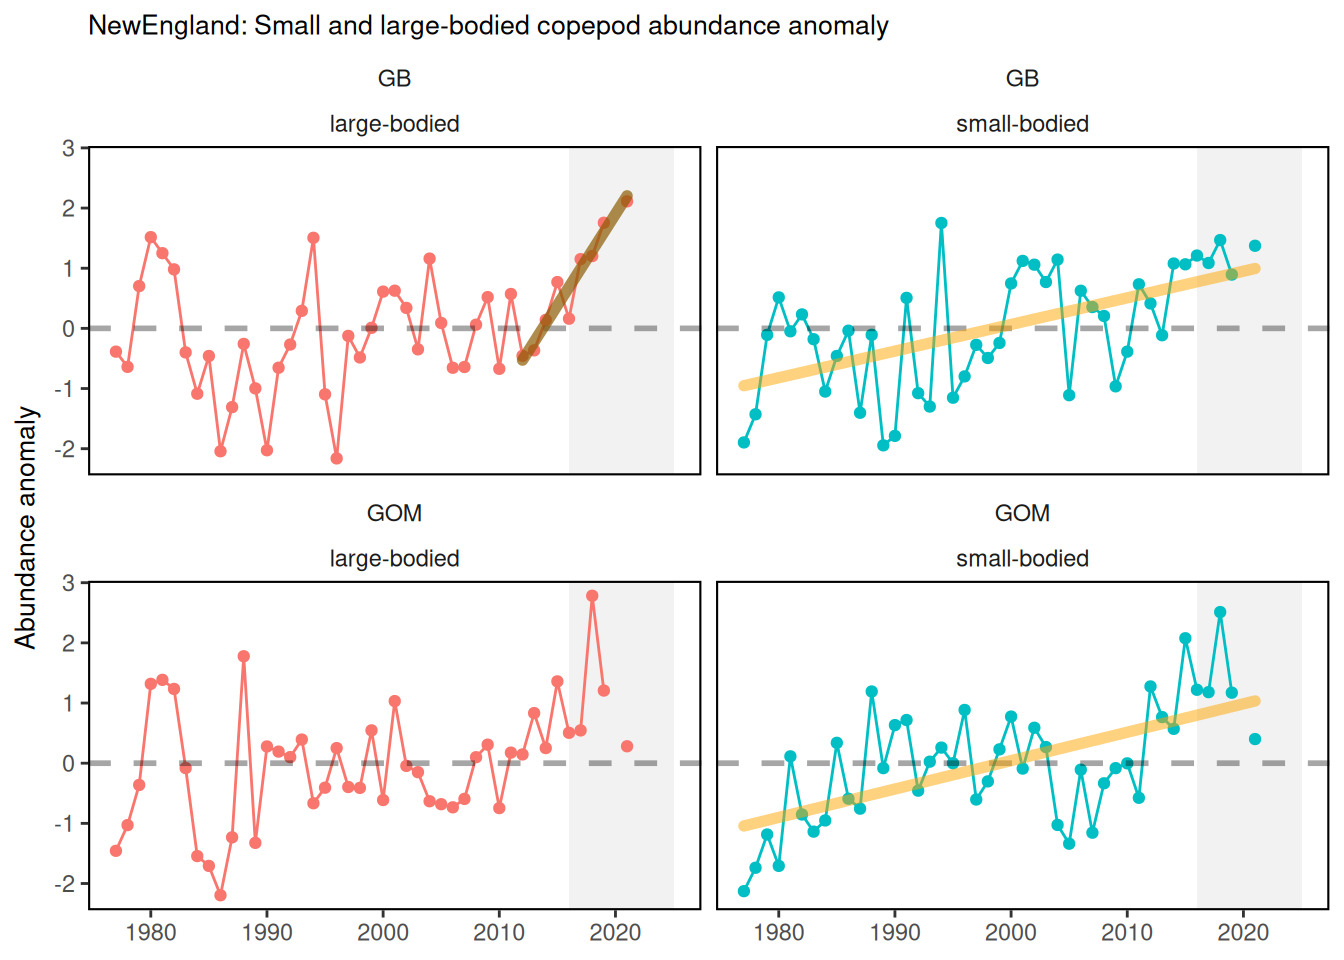
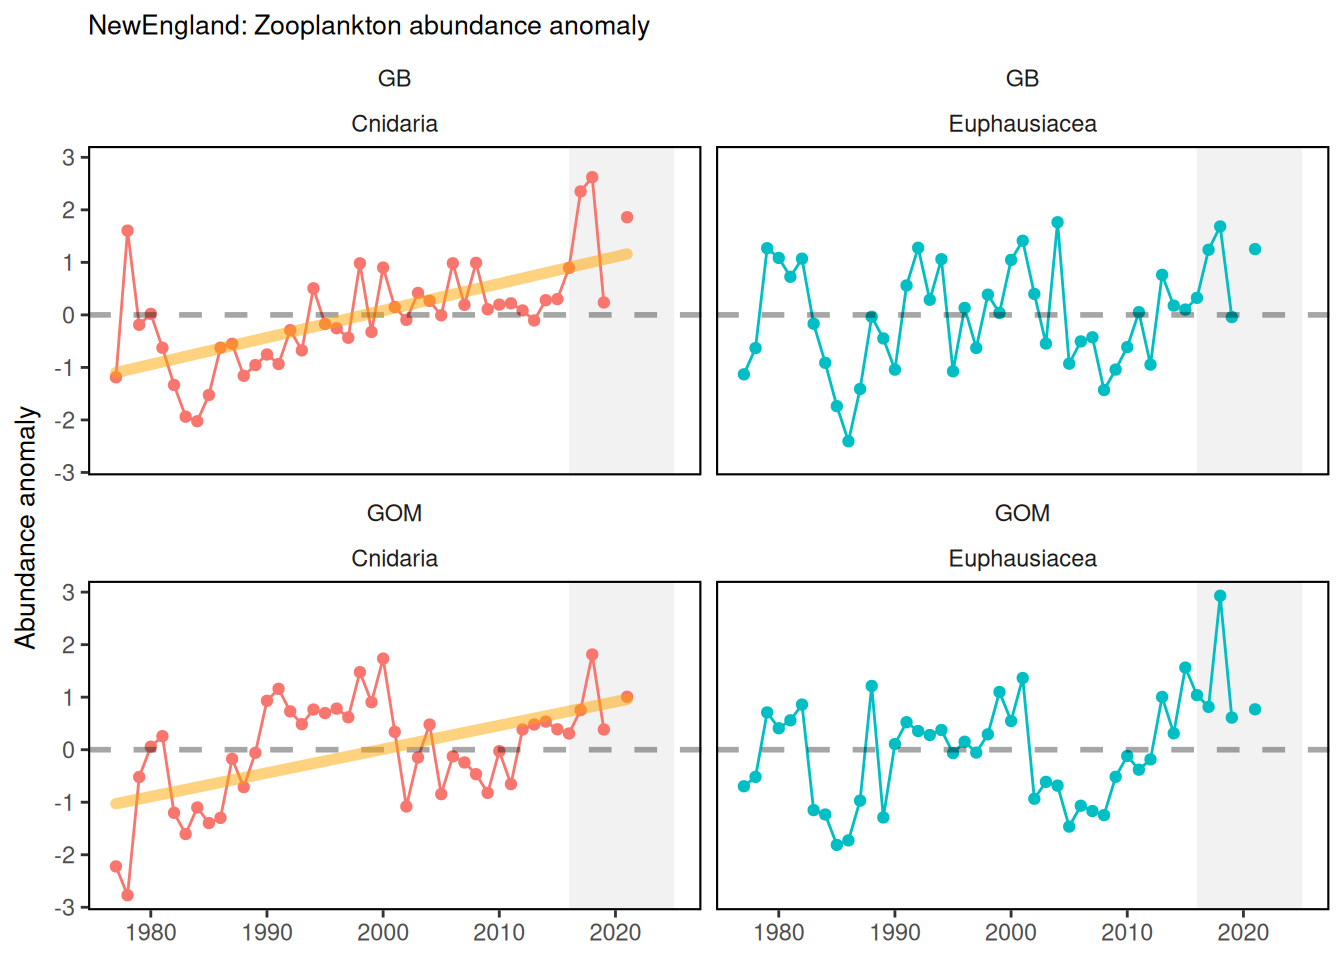
Abundance anomalies of small and large copepods have varied over time by EPU. Small bodied copepods and cnidarians show increasing trends in all EPUs. Large bodied copepods and euphausiids show no significant trend in any EPU.
8.4 Implications
Check these. If they are correct, we could be seeing the less energy dense zooplankton becoming more abundant in each system.
8.5 Get the data
Point of contact: Harvey Walsh, harvey.walsh@noaa.gov; Ryan Morse, ryan.morse@noaa.gov
ecodata name: ecodata::zoo_abundance_anom
Variable definitions
All are unitless anomalies from the 1977-2020 mean abundance for each taxon. Variables are taxa names: (to be described by contributors) “Calfin” “LgCopepods” “SmCopepods”
“Cyclopoida” “Diplostraca” “Ostracoda” “Cirripedia” “Euphausiacea” “Gammaridea” “Hyperiidea” “Mysidacea” “Decapoda” “Polychaeta” “Echinodermata”
“Mollusca” “Pteropod” “Chaetognatha” “Cnidaria” “Tunicate” “Protozoa”
Indicator Category:
8.7 Accessibility and Constraints
Request from Harvey Walsh, harvey.walsh@noaa.gov
tech-doc link https://noaa-edab.github.io/tech-doc/zoo_abundance_anom.html