23 Bottom trawl survey diversity index
Description: Diversity metric for the bottom trawl survey data
Indicator family:
Contributor(s): Andy Beet, Sean Lucey
Affiliations: NEFSC
23.1 Introduction to Indicator
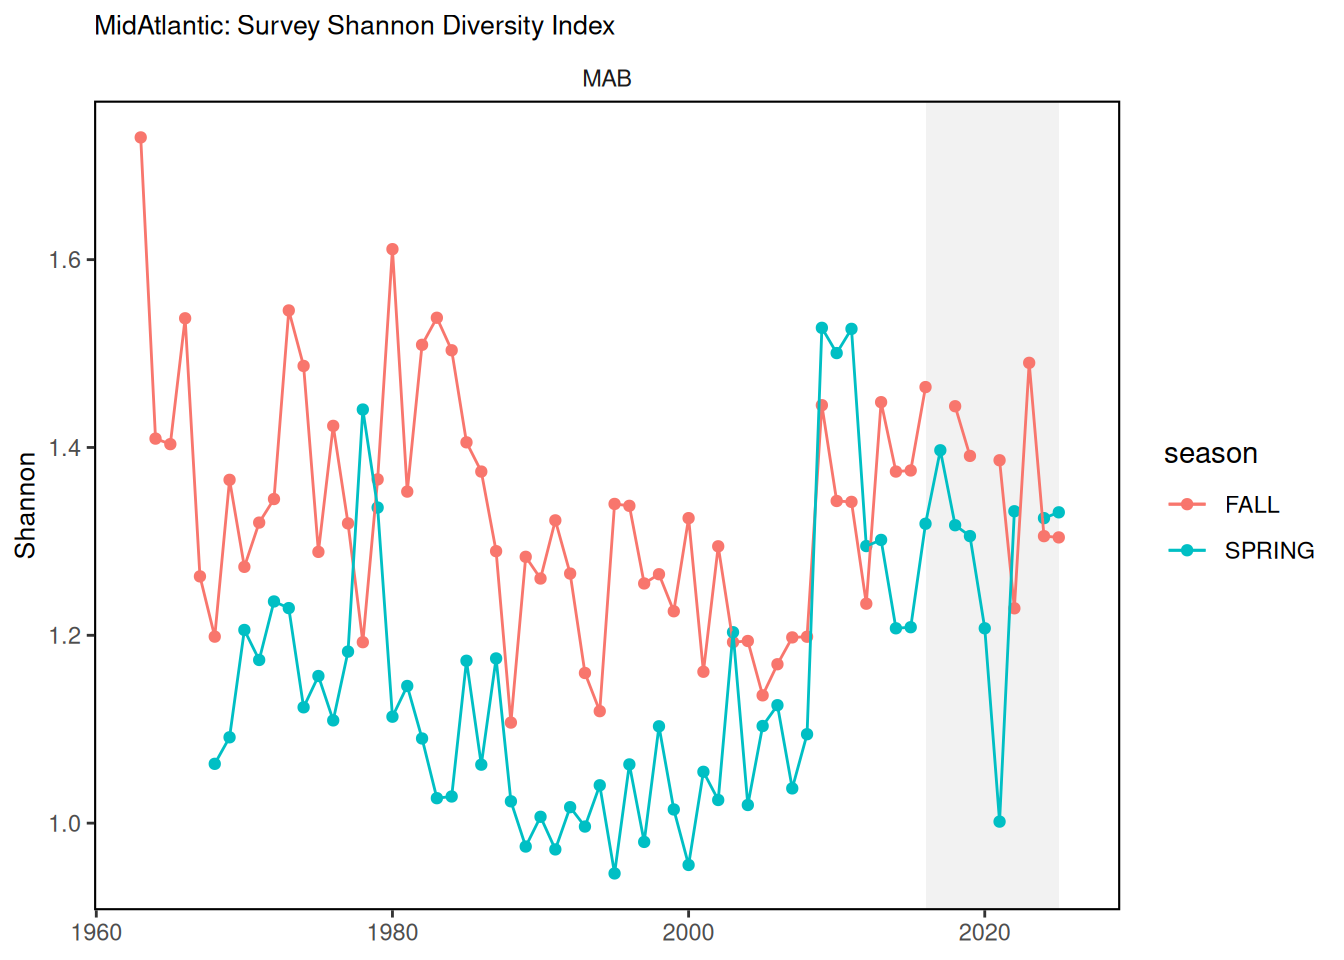
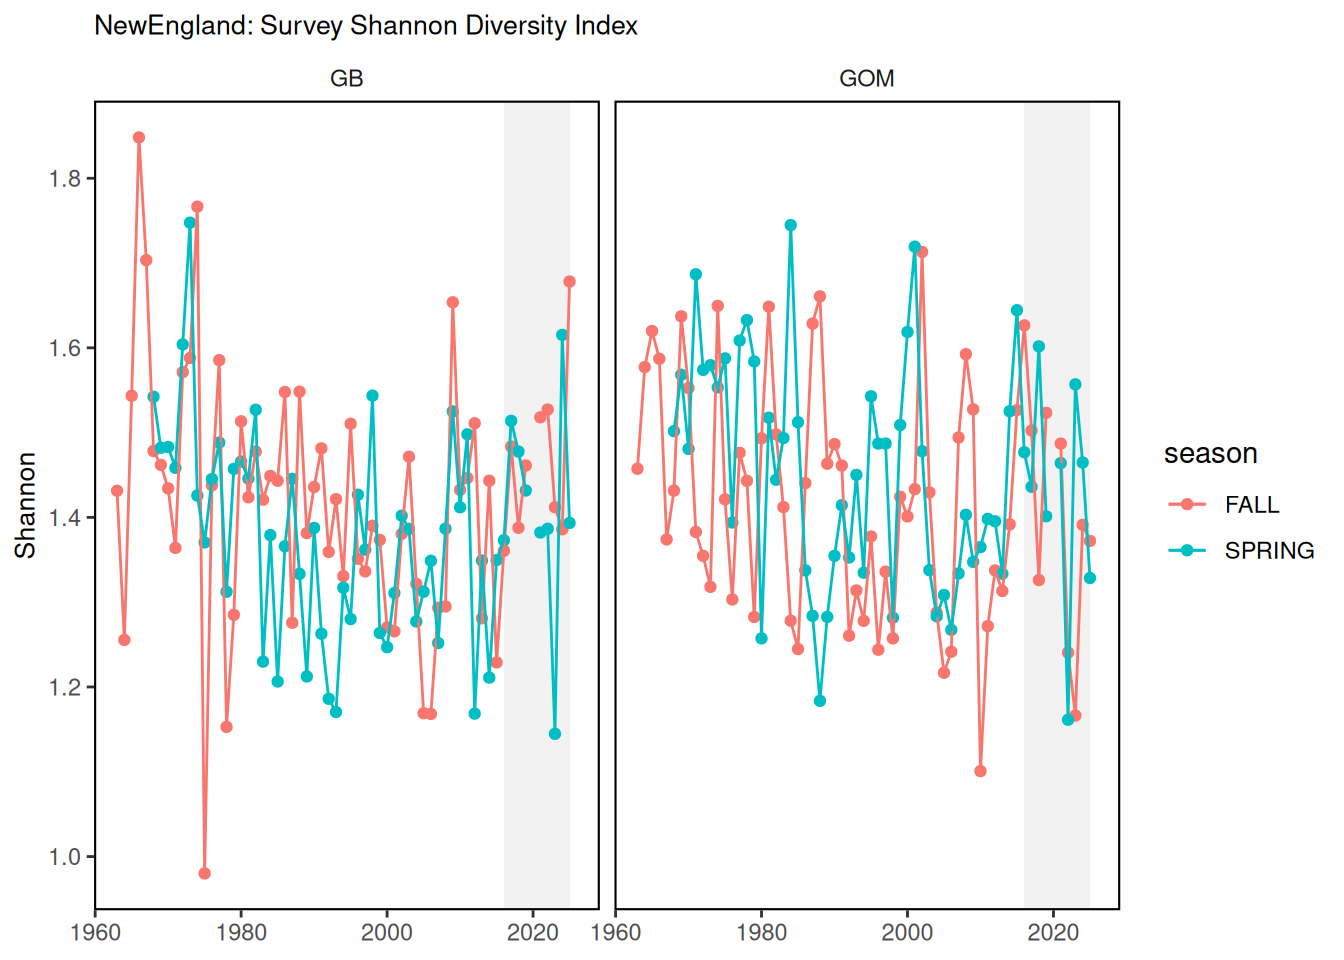
Diversity metrics may be useful in determining shifts in species composition through time. The shannon-diversity index, a way to measure diversity using species richness and evenness is implemented in the attempt to determine changes over time. The index has a maximum value when all species are equally abundant.
23.2 Key Results and Visualizations
A significant long term decline in the diversity metric is apparent in Georges Bank in both the Spring and the Fall. This is not seen in Gulf of Maine or the Mid Atlantic
23.4 Implications
A decline in the shannon diversity index over time could be a result of several factors; a decline in the number of species being found in the system over time or a select few becoming more abundant (relative to the rest) over time. If the number of species remain contant through time, then the decline represents a shift to a more unbalanced, uneven system where some species are more abundannt that others. An increase would represent the opposite, a shift, in direction, to a more balanced, even system.
If the number of species is changing through time, the inference is more complicated since the maximum value of the shannon-index is a function of the number of species.
23.5 Get the data
Point of contact: andrew.beet@noaa.gov
ecodata name: ecodata::survey_shannon
Variable definitions
Name: NEFSC survey species diversity (SPRING, FALL) Units: Shannon index (unitless)
Indicator Category:
23.7 Accessibility and Constraints
No response
tech-doc link https://noaa-edab.github.io/tech-doc/survey_shannon.html