19 Species Distribution Indicators
Description: Species mean depth, along-shelf distance, and distance to coastline
Indicator family:
Contributor(s): Kevin Friedland, Brandon Beltz
Affiliations: NEFSC
19.1 Introduction to Indicator
Distribution shifts for a suite of 48 commercially or ecologically important fish species were evaluated using center of gravity metrics based on NEFSC bottom trawl survey data.
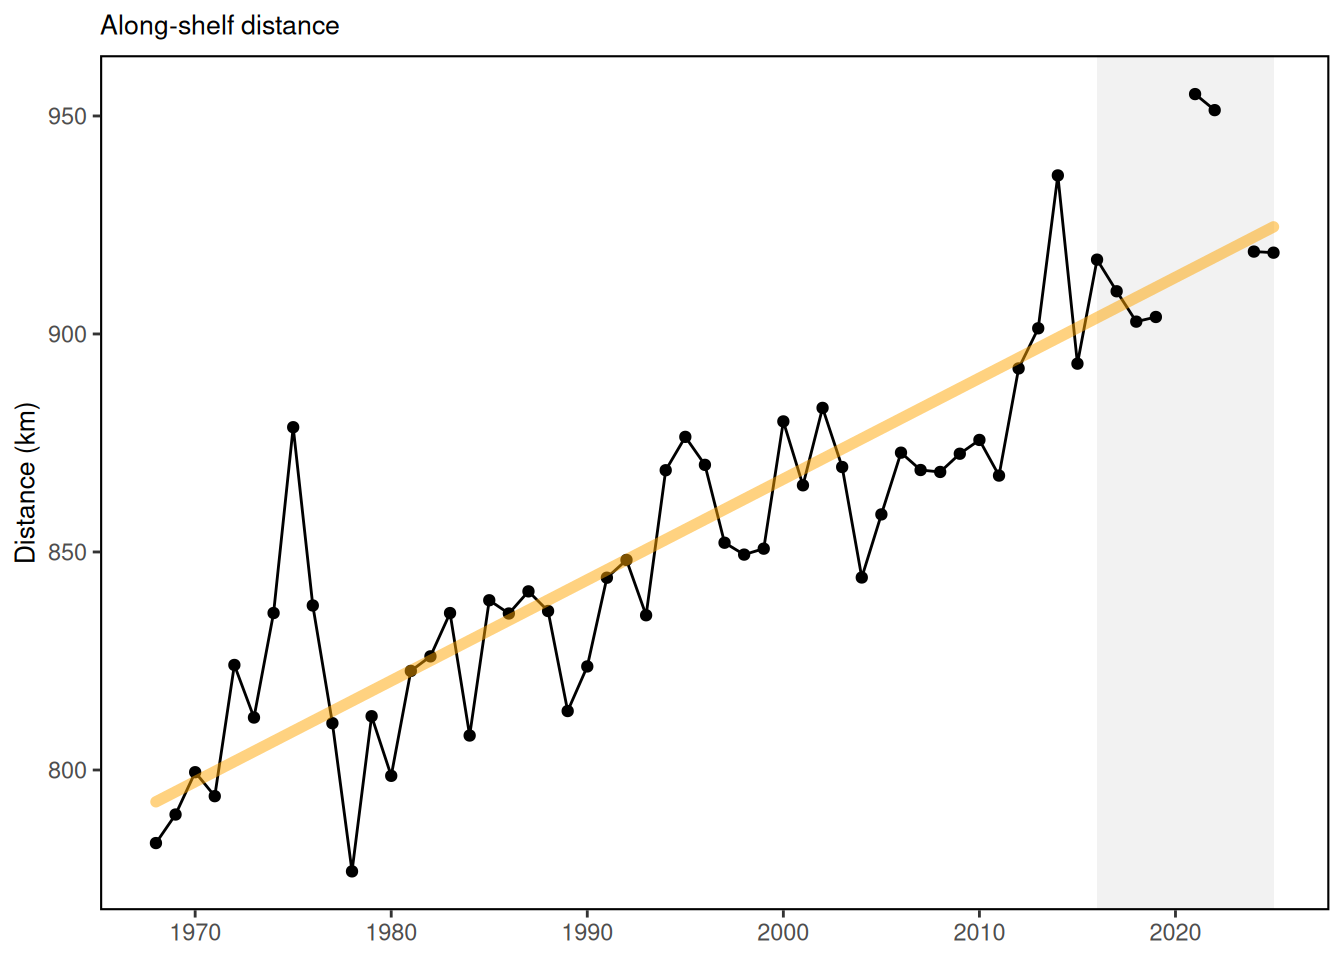
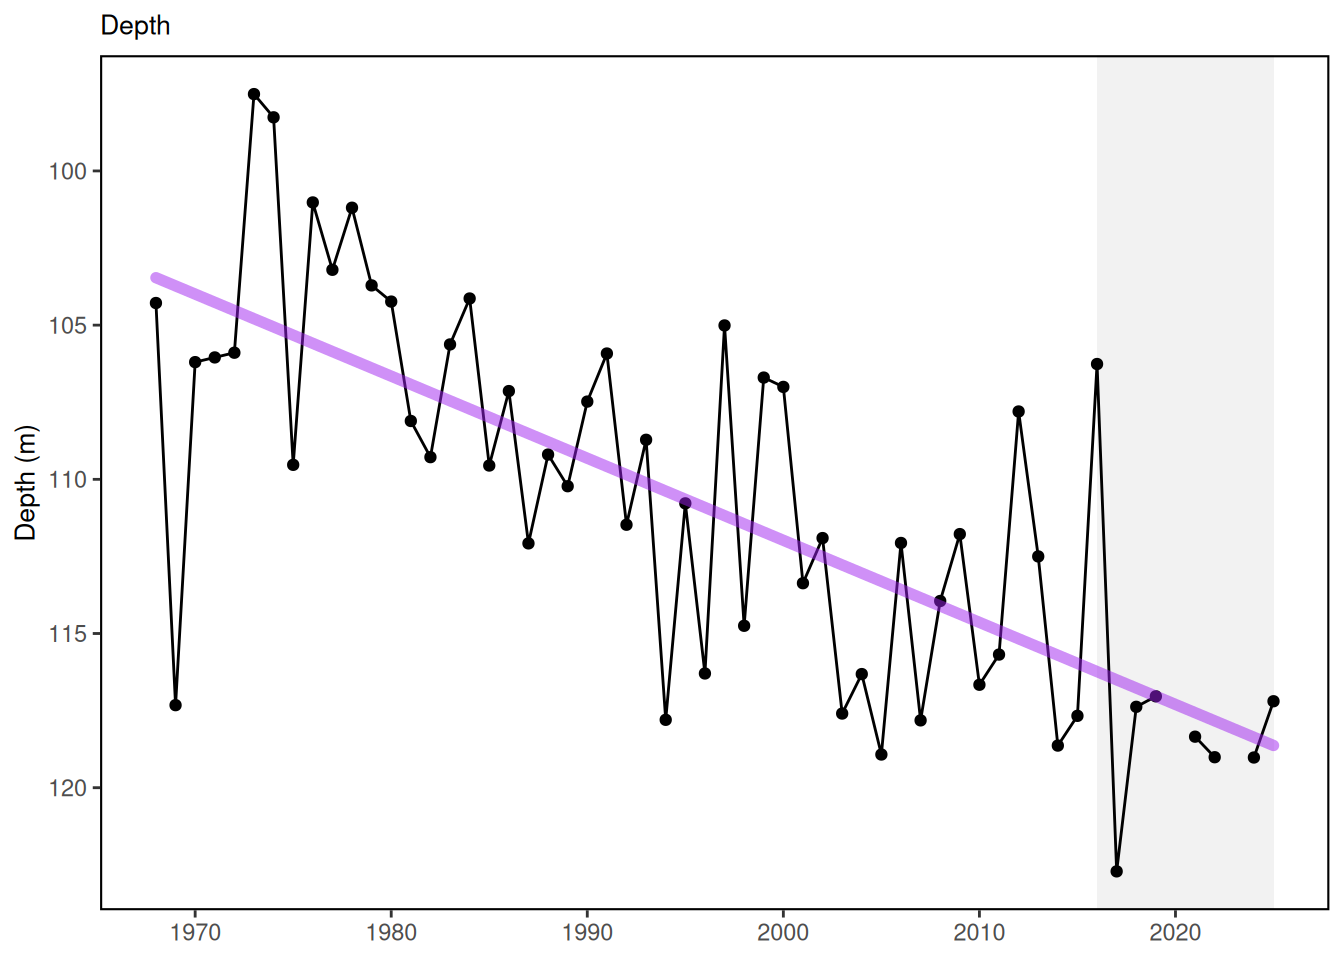
Along-shelf distance is a metric for quantifying the distribution of a species through time along the axis of the US Northeast Continental Shelf, which extends northeastward from the Outer Banks of North Carolina. Once mean distance is found, depth of occurrence and distance to coastline can be calculated for each species’ positional center.
Published distribution metrics for highly migratory species are also available for comparison. There is a significant body of work addressing potential distribution changes of tuna and other HMS due to climate change.
[33] analyzed historical data from 1958 to 2004. This paper considers global distribution changes of tunas and “tuna habitat” (derived from modeling tuna relative abundance x PISCES model data), including Atlantic bluefin tuna and our BAYS tunas.
19.2 Key Results and Visualizations
Tunas and other highly migratory species (no dataset)
20 of 22 modeled tuna stocks had significant poleward shifts in their gravity center and/or one of their distribution limits. In the North Atlantic, albacore and bluefin tuna had modeled habitat shift northward [33]. Species distribution shifts have been noted for several highly migratory species, including sharks, billfish and tunas between 2002 and 2019 (Fig. 1) [34].

NEFSC bottom trawl captured fish (ecodata::species_dist)
The center of distribution for a suite of 48 commercially or ecologically important fish species along the entire Northeast Shelf continues to show movement towards the northeast and generally into deeper water.
#> [1] "This is a shelfwide indicator only used in the MidAtlantic report"#> [1] "This is a shelfwide indicator only used in the MidAtlantic report"19.4 Implications
Temperature change is a major driver of changing fish distributions [35]. Future projection modeling suggested potential loss in northwestern Atlantic / US EEZ abundance of bluefin tuna and bigeye tuna [33,36].
Distribution shifts caused by changes in thermal habitat and ocean circulation are likely to continue as long as long-term trends persist. Episodic and short-term events (see observation highlights) may increase variability in the trends, however species distributions are unlikely to reverse to historical ranges in the short term. Increased mechanistic understanding of distribution drivers is needed to better understand future distribution shifts: species with high mobility or short lifespans react differently from immobile or long lived species.
Long-term oceanographic projections forecast a temporary pause in warming over the next decade due to internal variability in circulation and a southward shift of the Gulf Stream [37]. Near-term forecasts [38] are being evaluated to determine how well they are able to predict episodic and anomalous events that are outside of the long-term patterns.
19.5 Get the data
Point of contact: Kevin Friedland, kevin.friedland@noaa.gov
ecodata name: ecodata::species_dist
Variable definitions
“along-shelf distance” “depth” “distance to coast” “Latitude” “Longitude”
Indicator Category:
19.7 Accessibility and Constraints
Contact Kevin Friedland, kevin.friedland@noaa.gov for data access
tech-doc link https://noaa-edab.github.io/tech-doc/species_dist.html