71 Commercial Catch and Fleet Diversity
Description: Permit-level species diversity and Council-level fleet diversity.
Indicator family:
Contributor(s): Geret DePiper, Min-Yang Lee
Affiliations: NEFSC
71.1 Introduction to Indicator
Diversity estimates have been developed to understand whether specialization, or alternatively stovepiping, is occurring in fisheries of the Northeastern Large Marine Ecosystem. We use the average effective Shannon indices for species revenue at the permit level, for all permits landing any amount of NEFMC or MAFMC Fishery Management Plan (FMP) species within a year (including both Monkfish and Spiny Dogfish). We also use the effective Shannon index of fleet revenue diversity and count of active fleets to assess the extent to which the distribution of fishing changes across fleet segments.
71.2 Key Results and Visualizations
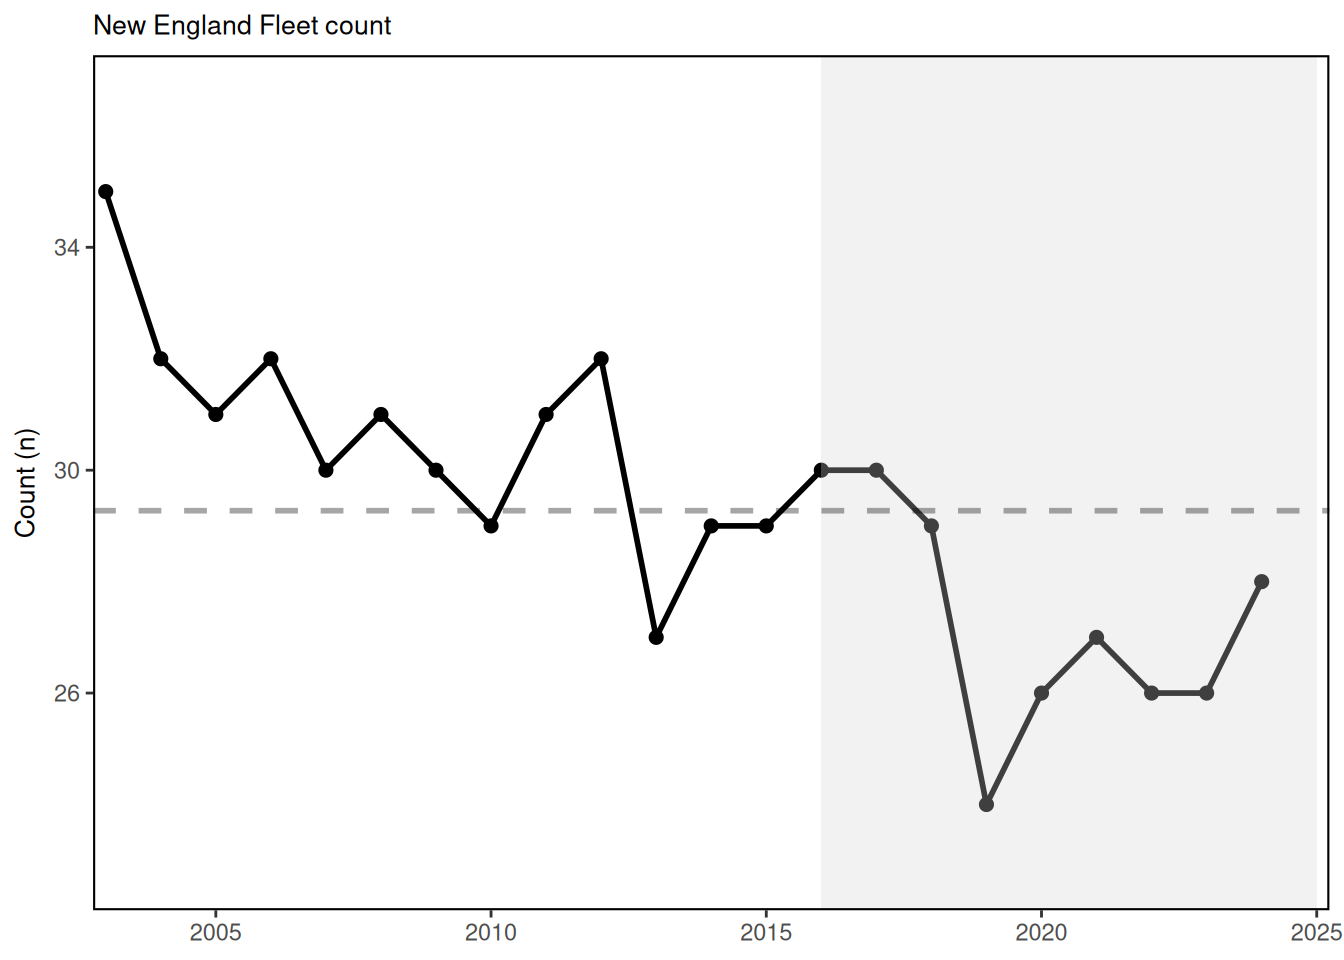
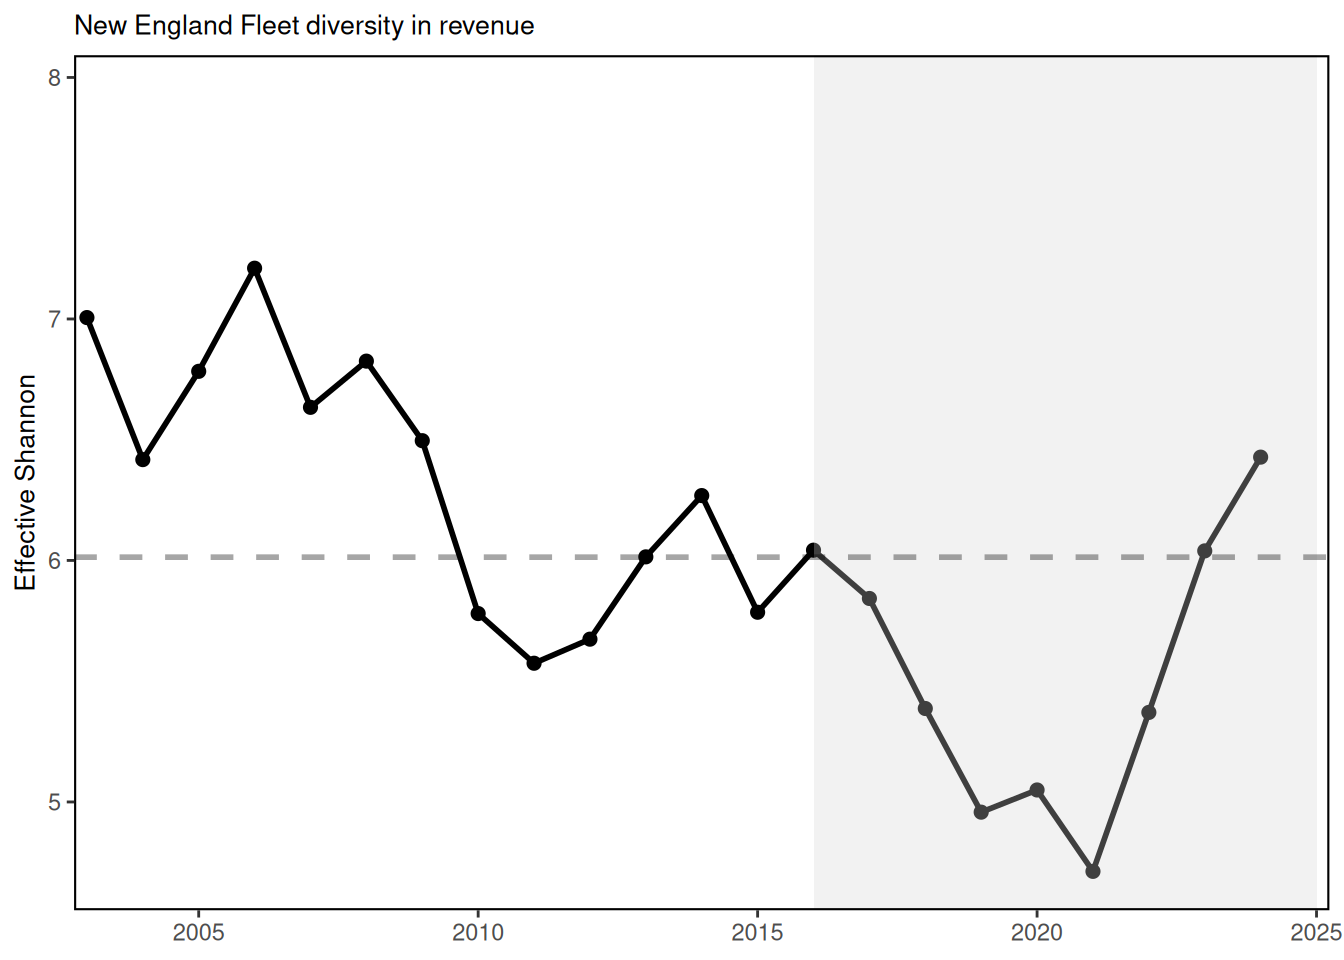
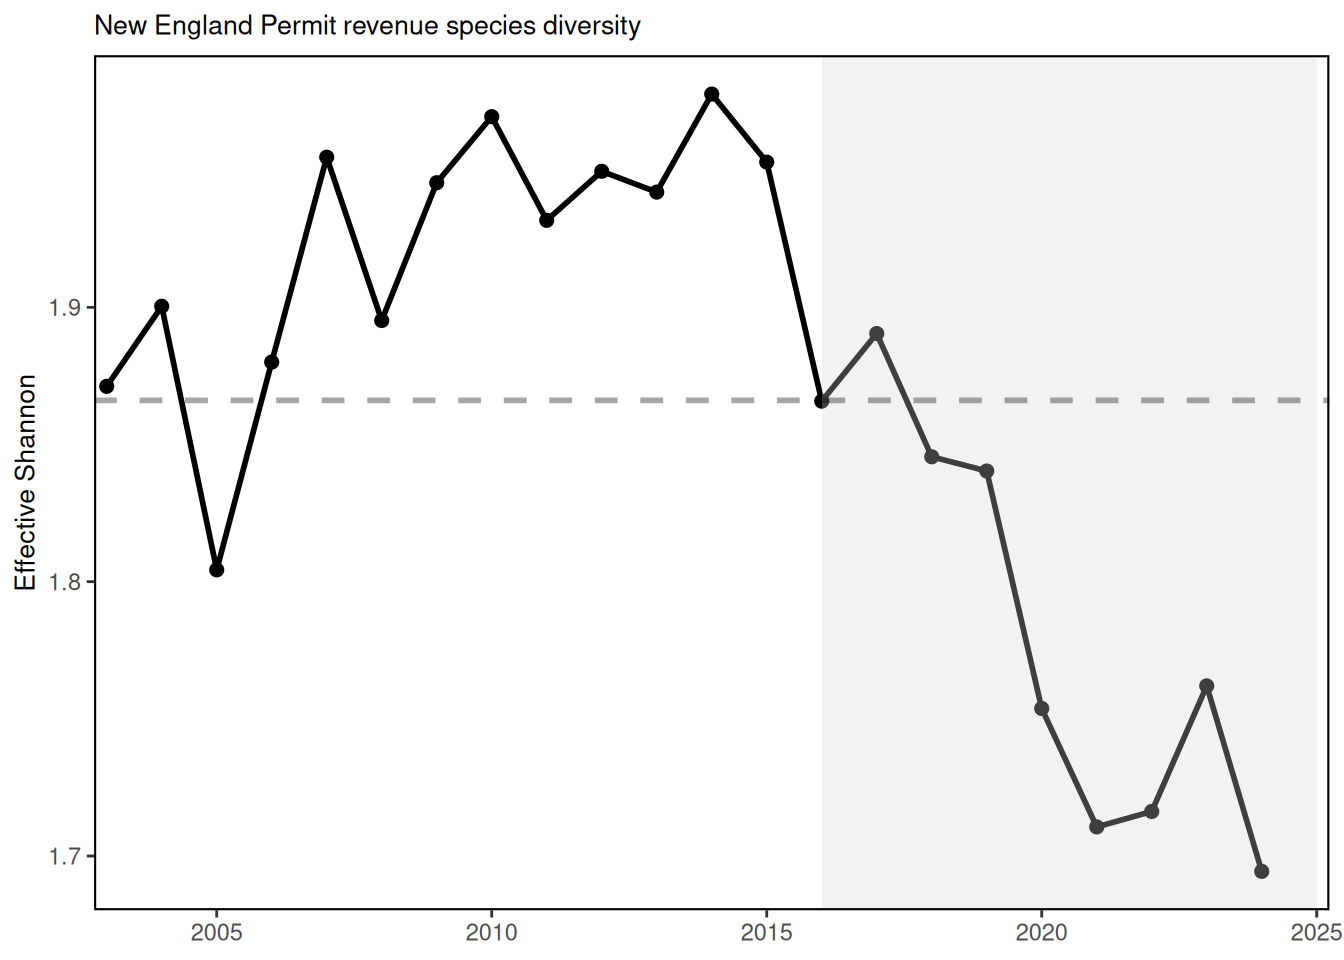
Diversity estimates have been developed for species landed by commercial vessels with New England permits, and fleets landing managed species. Over the course of the last three years, there has been a steep decline in the effective number of species being landed in the commercial fleet, and current diversity is near a low since records began. Commercial fishery fleet count has rebounded in recent years, although still at levels well below the historical average. Here a fleet is defined as the combination of gear type (Scallop Dredge, Clam Dredge, Other Dredge, Gillnet, Hand Gear, Longline, Bottom Trawl, Midwater Trawl, Pot, or Purse Seine) and vessel length category (Less than 30 ft, 30 to 50 ft, 50 to 75 feet, 75 ft and above).
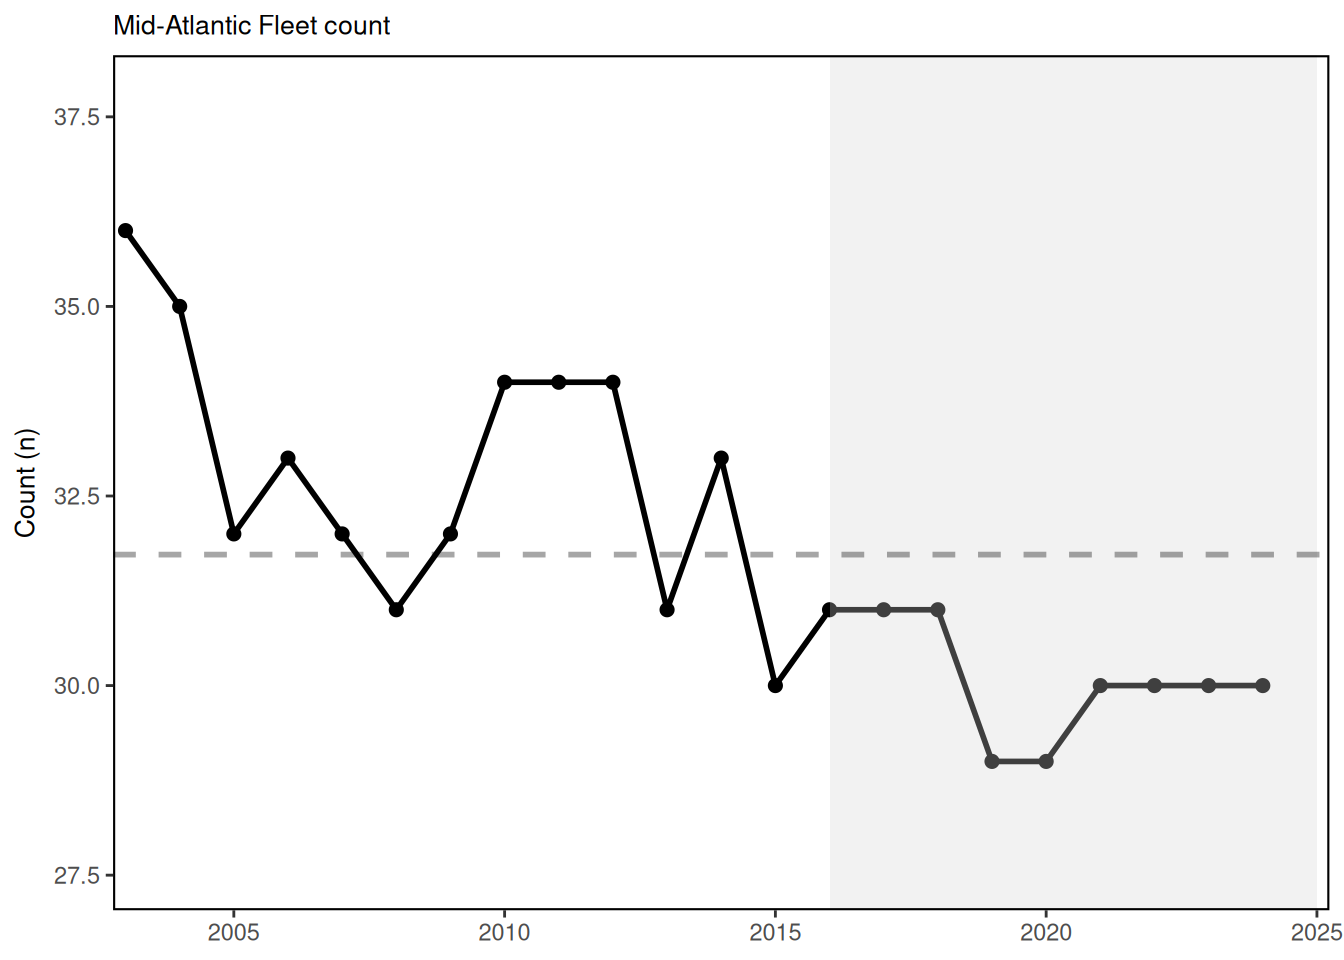
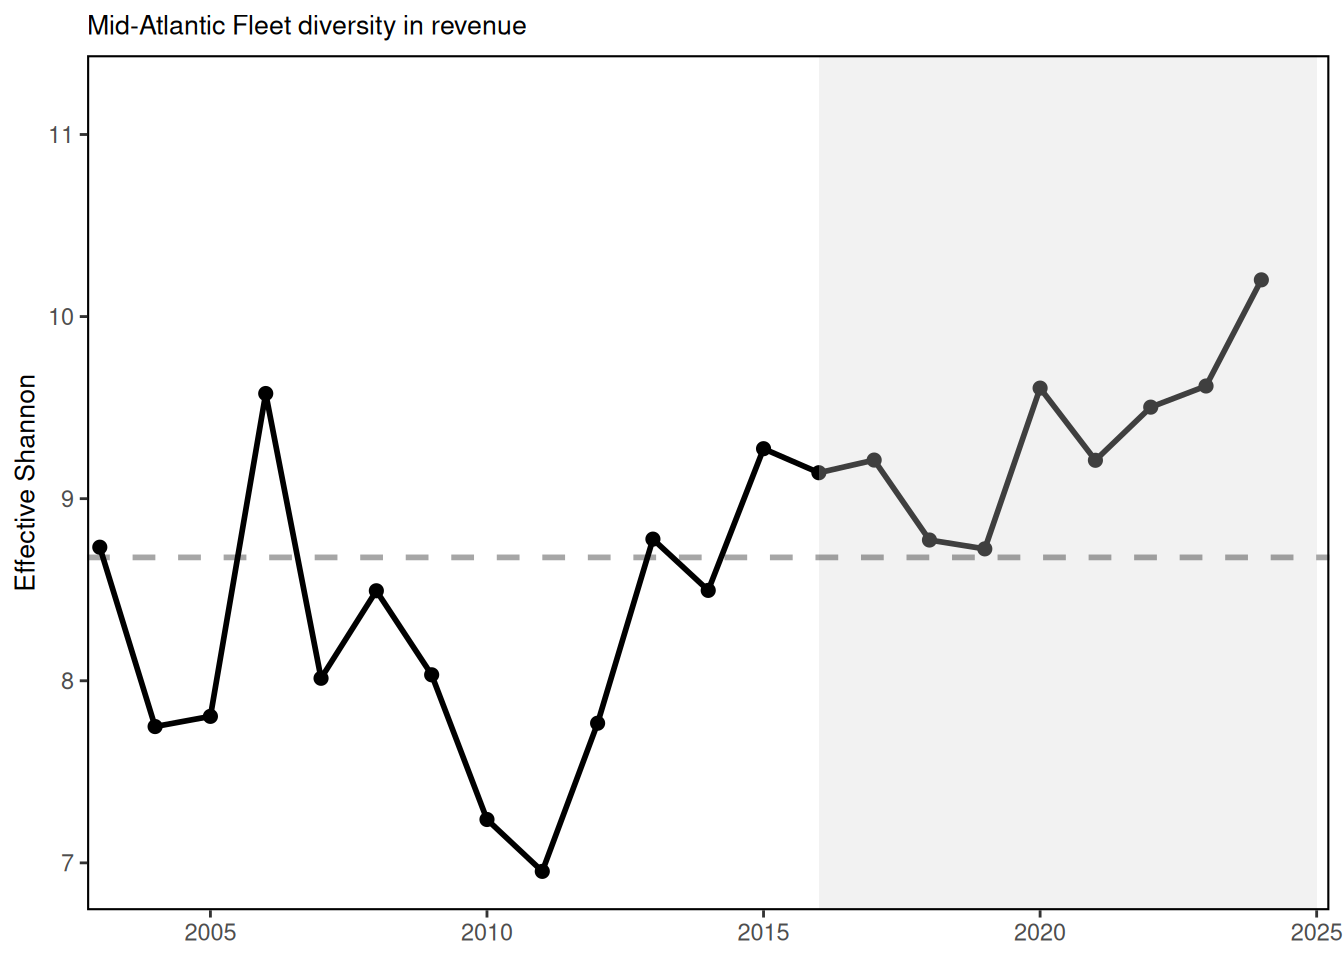
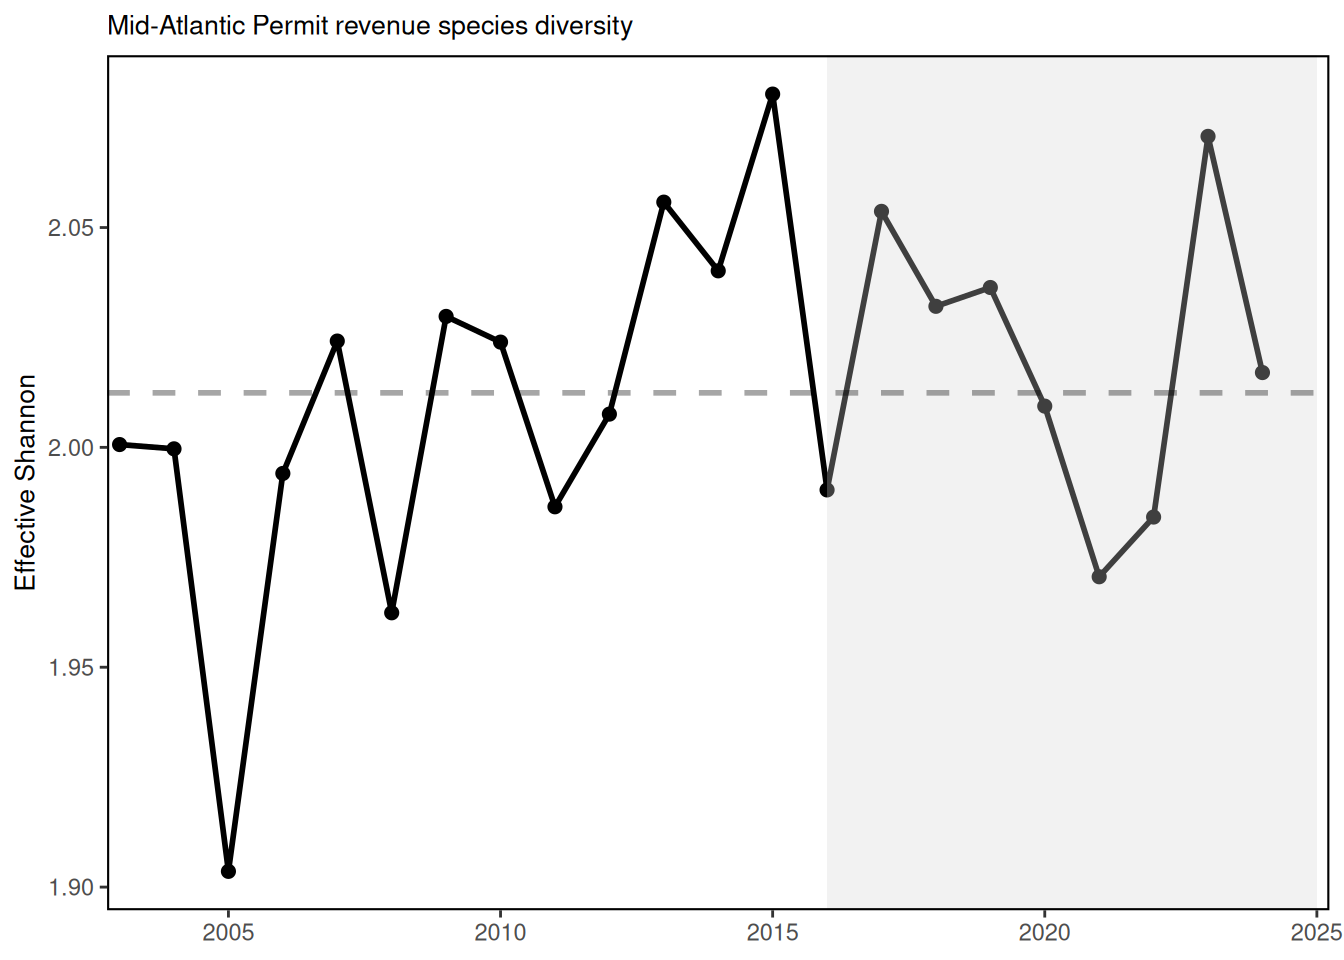
Commercial fishery fleet count and fleet diversity have been stable over time in the MAB, with current values near the long-term average. This indicates similar commercial fleet composition and species targeting opportunities over time. Commercial fisheries are relying on fewer species relative to the mid-90s, although current species revenue diversity has recovered somewhat in the last year.
71.3 Indicator statistics
Spatial scale: Mid-Atlantic and New England
Temporal scale: Annual
Synthesis Theme:
71.4 Implications
Fleet diversity indices can be used to evaluate stability objectives as well as risks to fishery resilience and to maintaining equity in access to fishery resources [109]. In New England, the relatively low diversity estimates for the commercial fishery are likely driven by the continued reliance on a few species, sea scallops and lobster. This trend could diminish the capacity to respond to future fishing opportunities.
In the Mid-Atlantic, stability in commercial fleet diversity metrics suggests stable capacity to respond to the current range of fishing opportunities.
71.5 Get the data
Point of contact: EDAB, edab.data@noaa.gov
ecodata name: ecodata::commercial_div
Variable definitions
- Name: Permit revenue species diversity; Definition: Diversity of revenue across species averaged across permits; Units: effective Shannon.
- Name: Fleet diversity in revenue; Definition: Diversity of revenue across fleet segments; Units: effective Shannon.
- Name: Fleet count; Definition: Number of active fleets; Units: number of fleets.
Indicator Category:
71.7 Accessibility and Constraints
Request data from GARFO
tech-doc link https://noaa-edab.github.io/tech-doc/commercial_div.html