69 Commercial Landings and Revenue
Last updated July 23, 2026
Description: Commercial landings and revenue from dealer reports
Contributor(s): Sean Lucey, Andrew Beet, and Sarah Gaichas
Affiliations: NEFSC
Indicator Family:
Indicator Category:
Synthesis Theme:
69.1 Introduction to Indicator
The Northeast US has a long, rich history of commercial fishing. Species of all different types are caught using a plethora of different fishing gear from North Carolina to Maine. This data set aggregates the value of those landings adjusted for inflation to the start of the report year. Revenue is calculated by total and managed by the Mid-Atlantic Fisheries Management Council and New England Fisheries Management Council. Revenue can be visualized by feeding guilds as well as by region.
69.2 Key Results and Visualizations
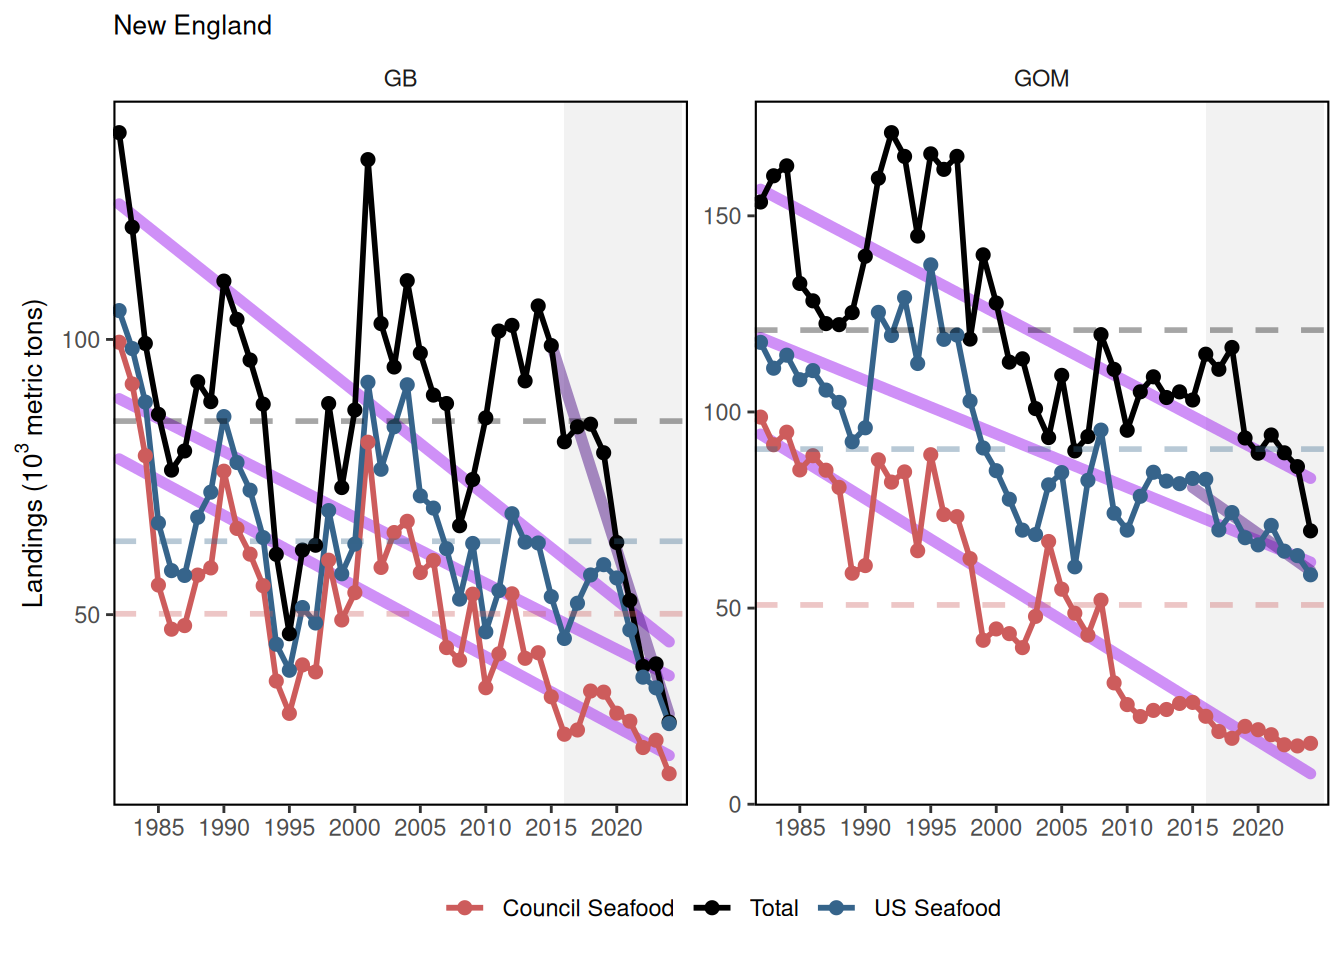
Landings have fluctuated over time in all regions. In the two northern regions, a majority of the catch is used for human consumption (seafood) while less so in the Mid-Atlantic. Commercial seafood landings have been declining in both the Mid-Atlantic and Gulf of Maine regions.
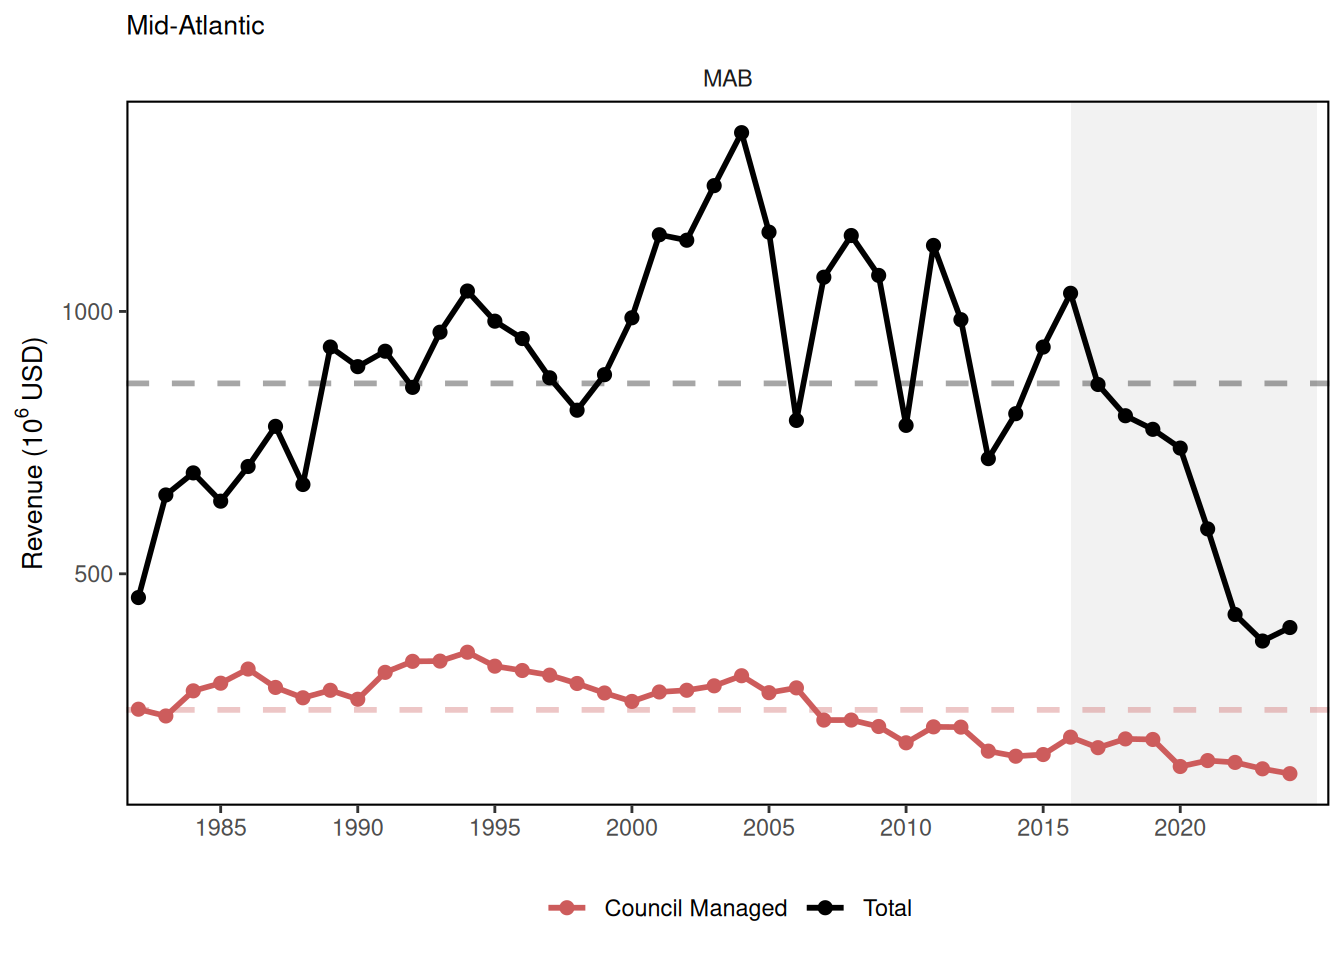
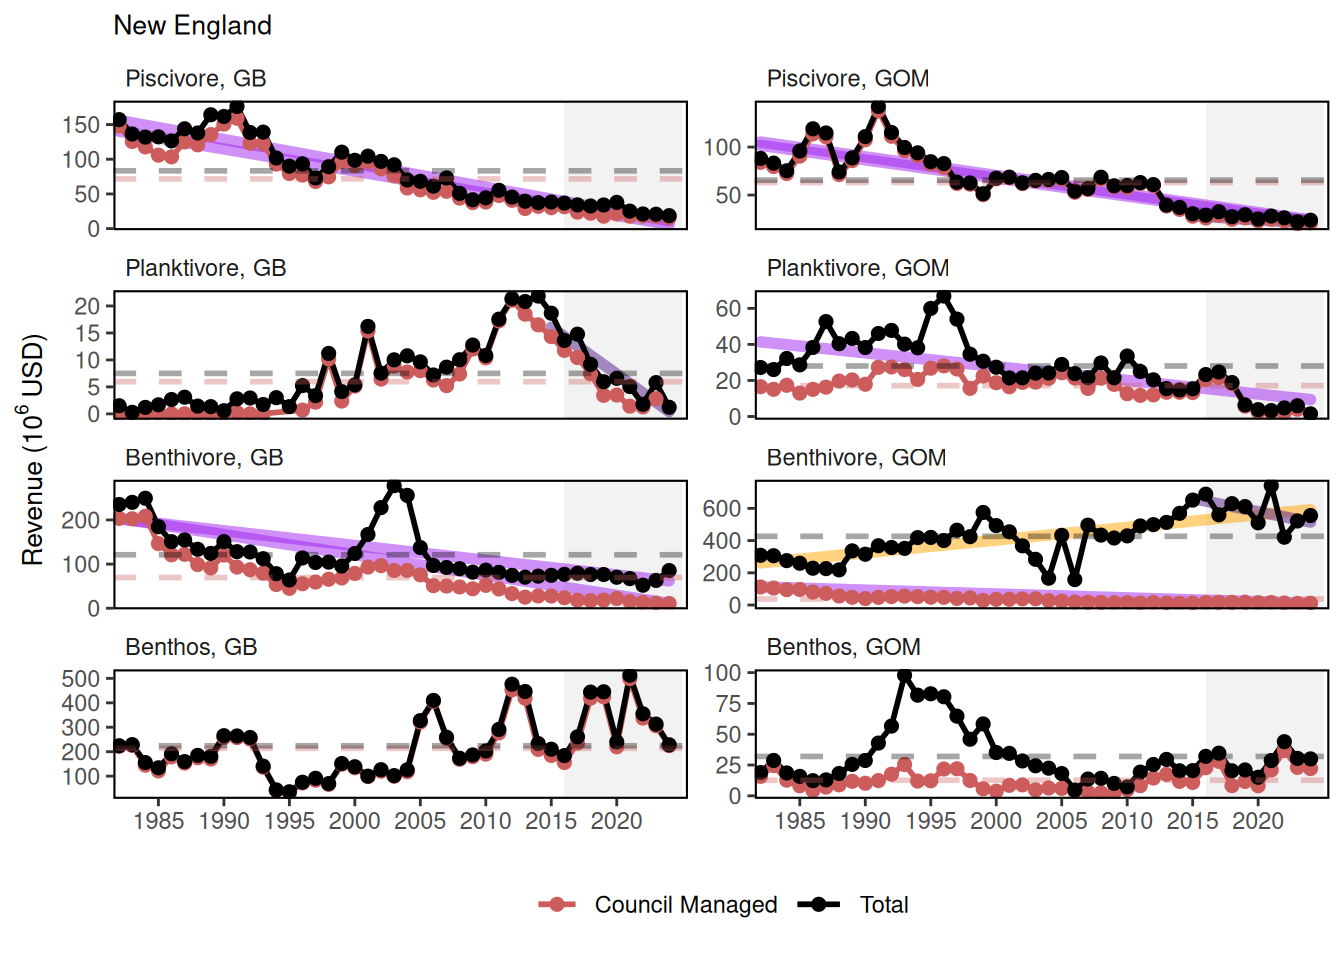
Commercial revenue by managed species has generally been down. The exception is on Georges Bank where there is a cyclical nature to revenue arising from rotational scallop management. Total fisheries revenue in the Gulf of Maine has been increasing while total revenue has declined in the Mid-Atlantic.
Mid-Atlantic, landings, total, 2019
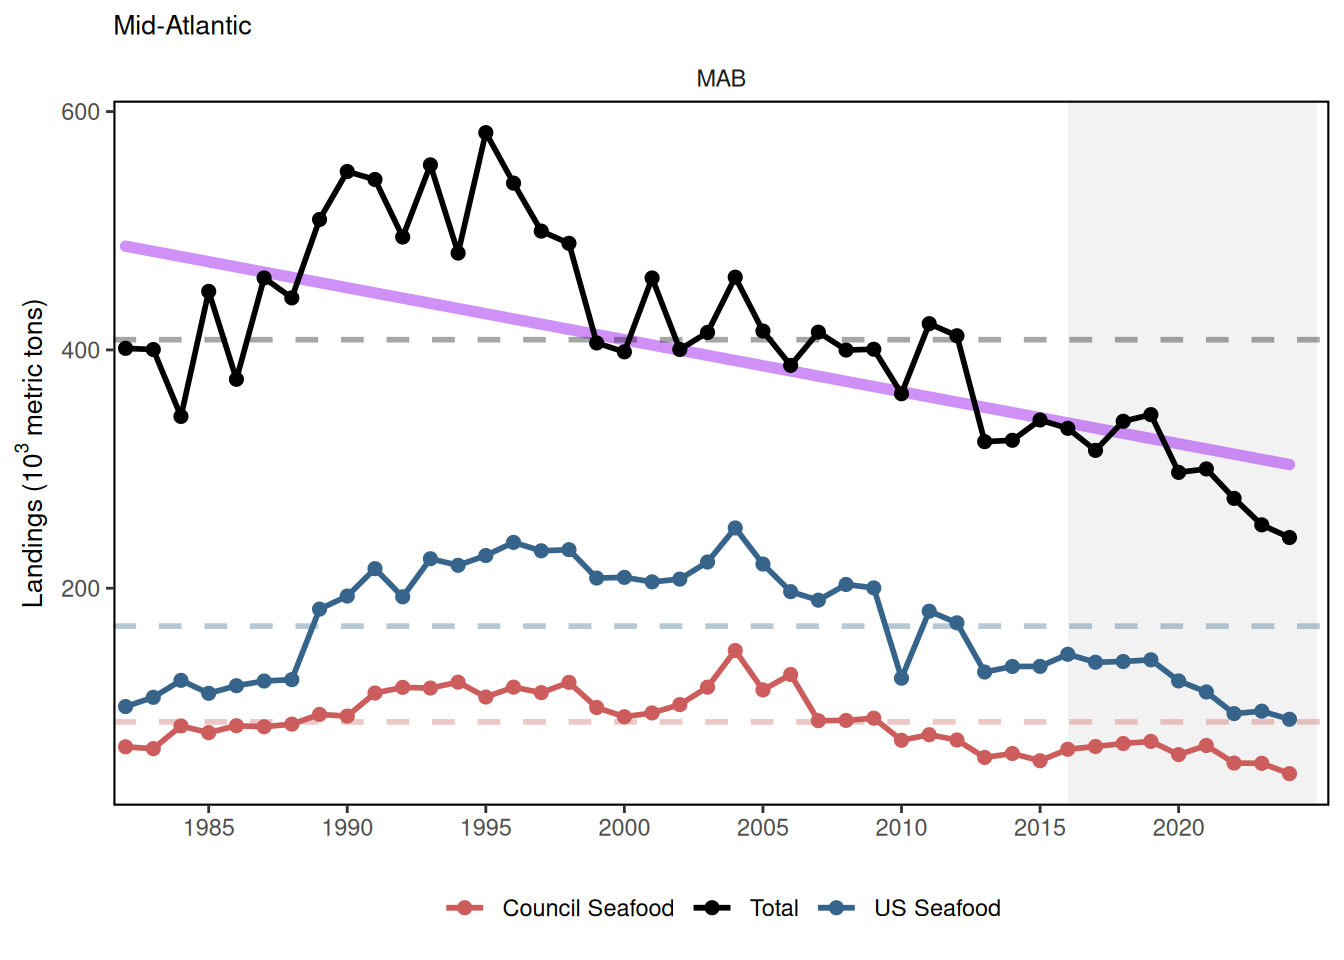
New England, landings, total, 2019
Mid-Atlantic, revenue, total, 2019
New England, revenue, total, 2019
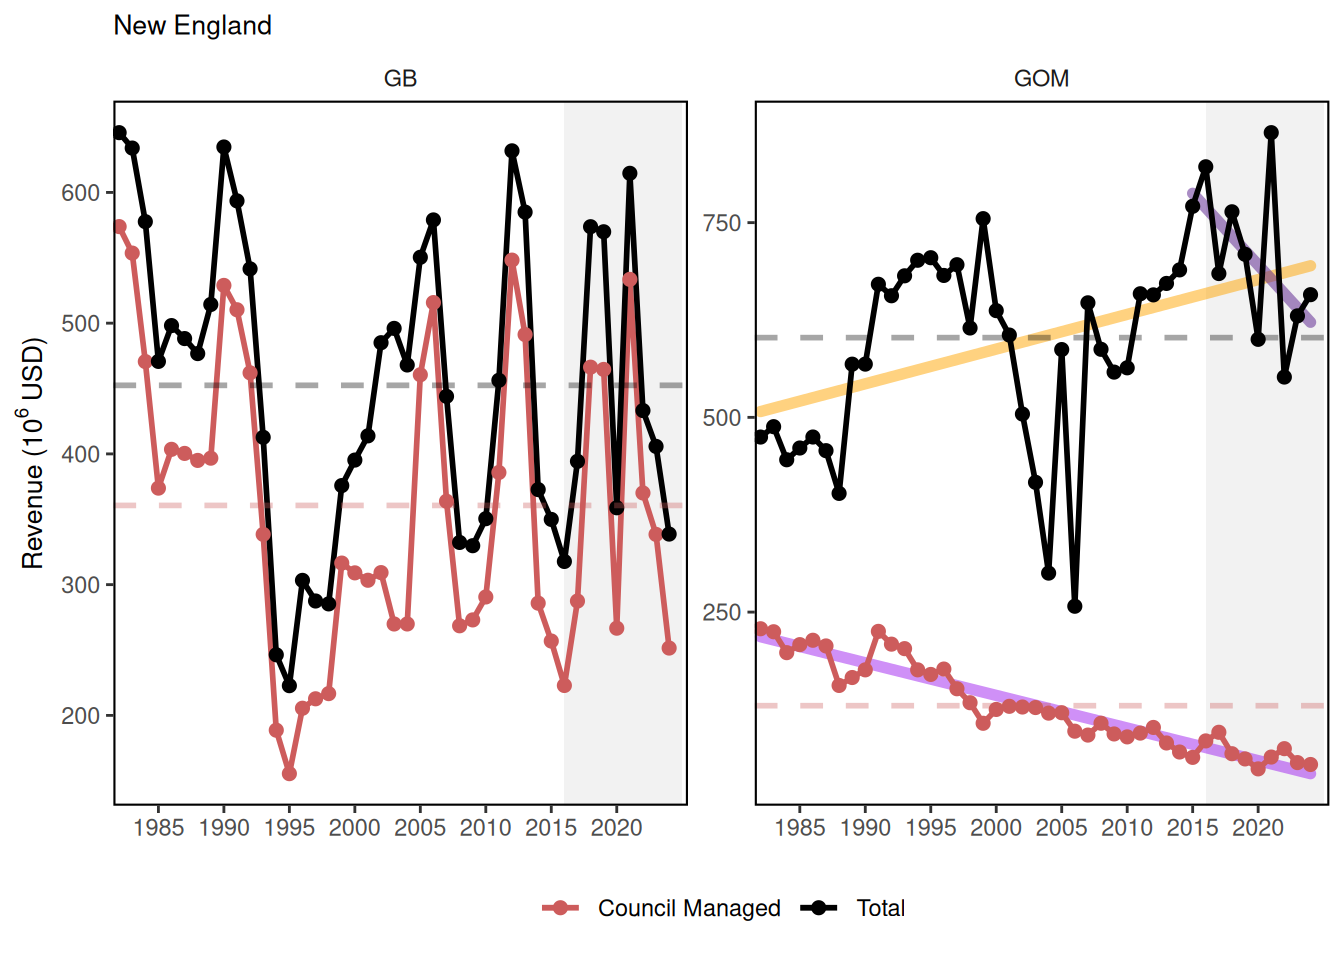
Mid-Atlantic, landings, guild, 2019
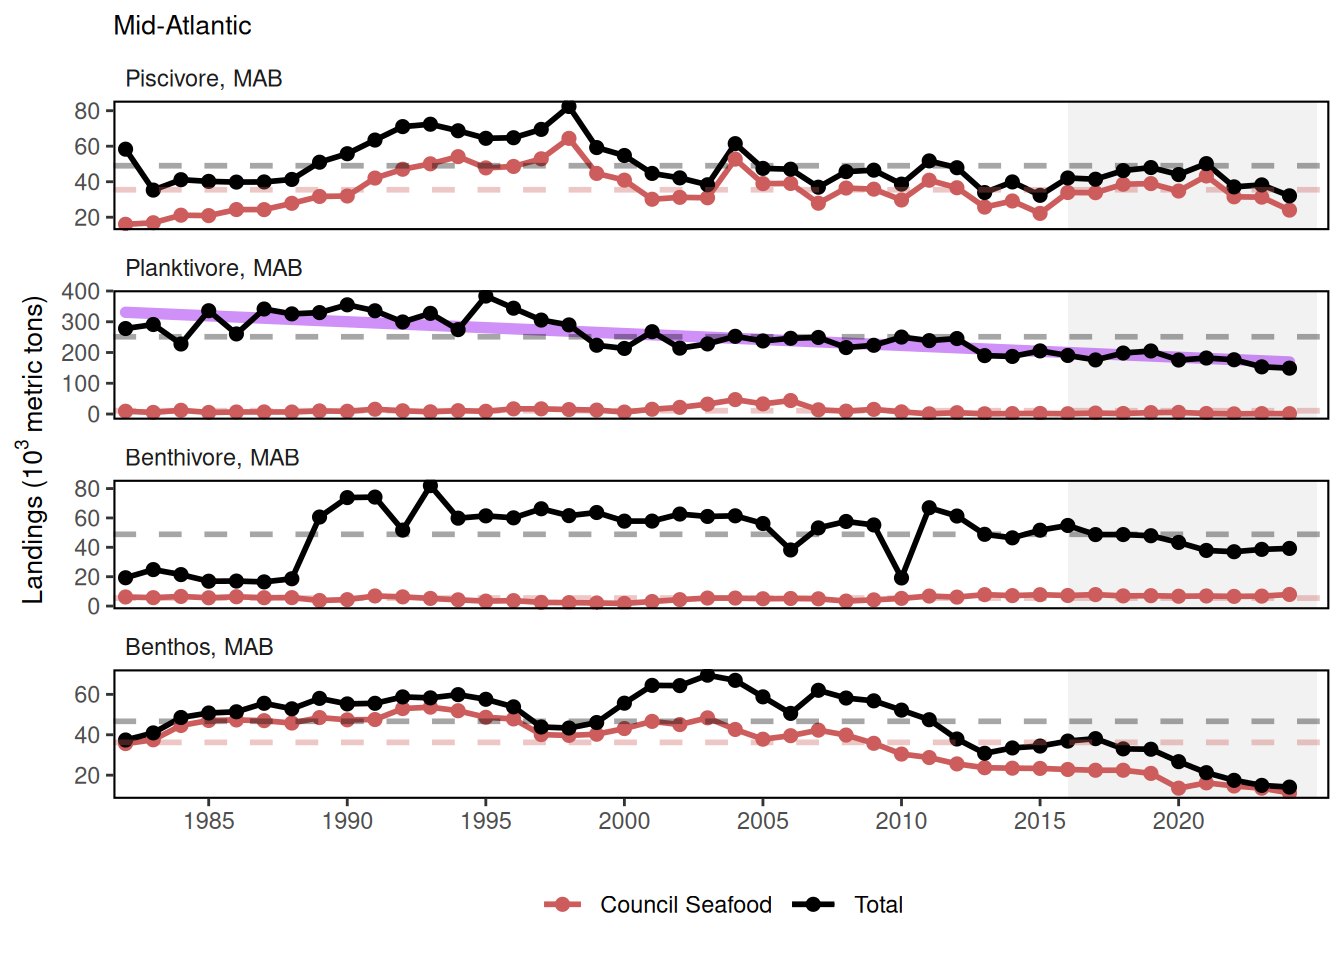
New England, landings, guild, 2019
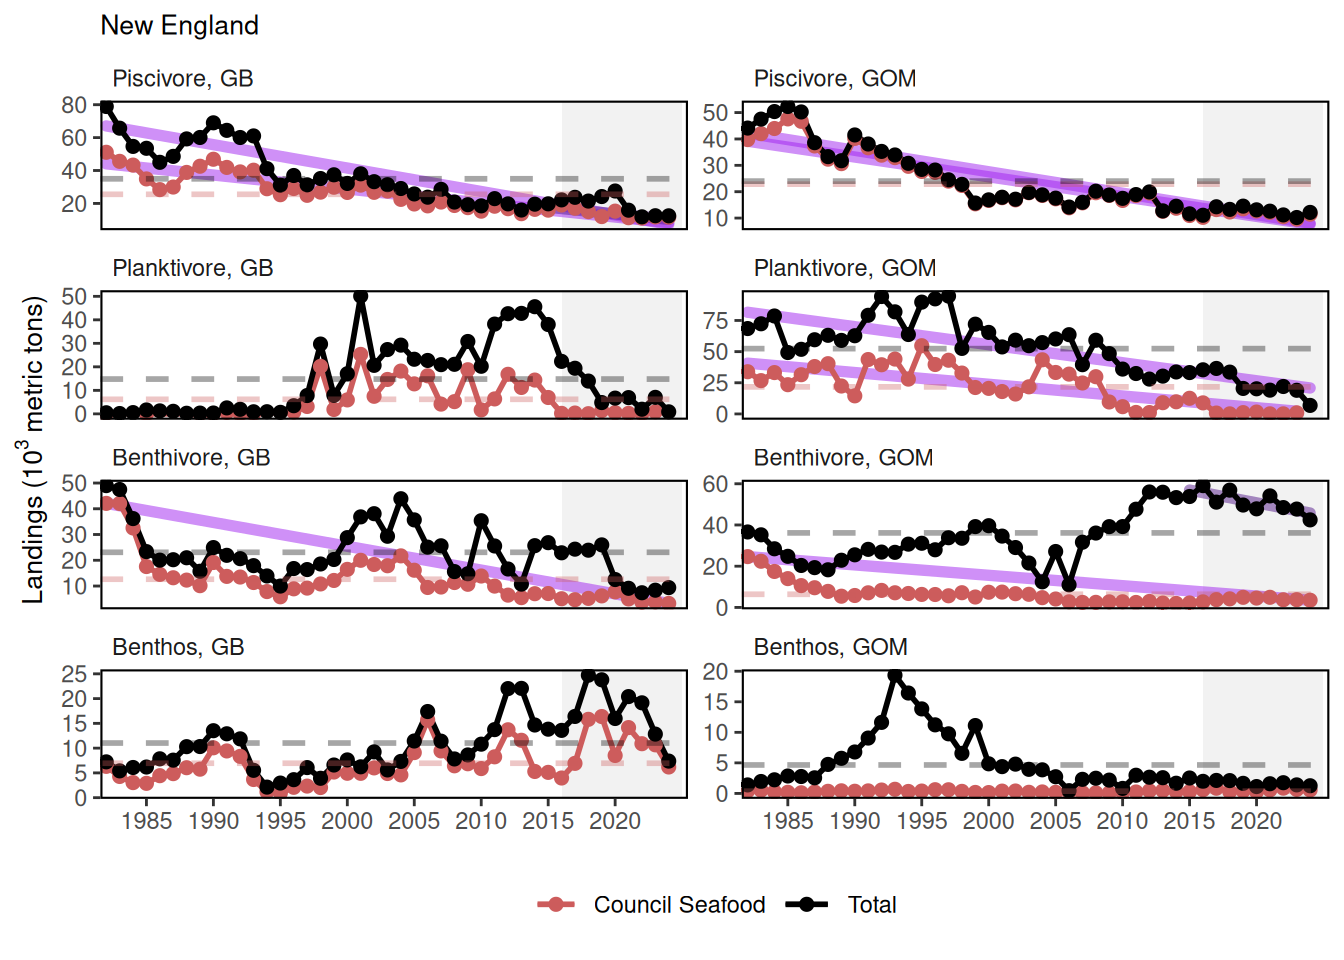
Mid-Atlantic, revenue, guild, 2019
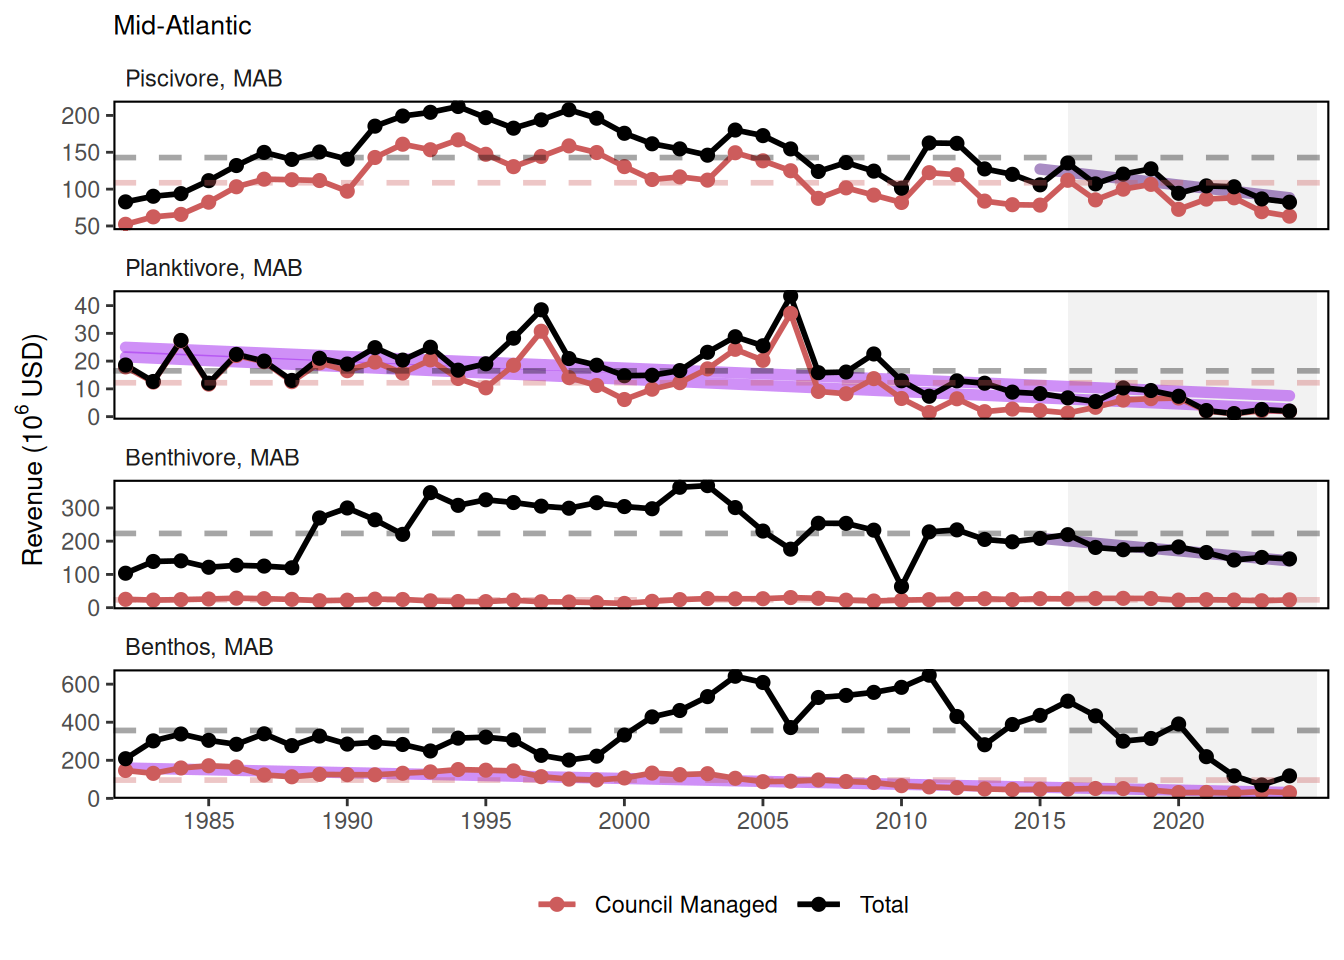
New England, revenue, guild, 2019
69.3 Implications
Landings is a key indicator of the State of the Ecosystem report. It is the key driver in fisheries and is impacted by many of the other indicators presented throughout the report. Changes in landings can occur from a number of different factors including but not limited to the underlying ecosystem, changes in climate, fisheries economics, and management measures.
Revenue is a key indicator of the State of the Ecosystem report. Revenue is largely driven by landings and fisheries economics. There are many factors that can effect revenue. Revenue is used as a proxy for profit but only tells one side of the story. Ultimately there is a need to get a better sense of fisheries costs to adequately address commercial profits.
69.5 Get the data
Point of contact: EDAB, edab.data@noaa.gov
ecodata dataset: ecodata::comdat
Tech Doc link: https://noaa-edab.github.io/tech-doc/comdat.html
69.5.2 Accessibility Constraints
Please email Andrew.Beet@NOAA.gov for further questions. Access to data will require a non-disclosure agreement with NOAA.