67 Commercial Landings Data
Description: Commercial landings data pull
Found in: State of the Ecosystem - Gulf of Maine & Georges Bank (2017+), State of the Ecosystem - Mid-Atlantic (2017+)
Indicator category: Database pull
Contributor(s): Andy Beet
Data steward: Andy Beet andrew.beet@noaa.gov
Point of contact: Andy Beet andrew.beet@noaa.gov
Public availability statement: Raw data are not publicly available due to confidentiality of individual fishery participants.
67.1 Methods
Fisheries dependent data for the Northeast Shelf extend back several decades. Data from the 1960s are housed in the Catch Accounting and Monitoring System (CAMS) at the Greater Atlantic Regional Fisheries Office (GARFO) which contains the commercial fisheries dealer purchase records (weigh-outs) collected by National Marine Fisheries Service (NMFS) Statistical Reporting Specialists and state agencies from Maine to Virginia. The data format has changed slightly over the time series with three distinct time frames as noted in Table 67.1 below.
| Table | Years |
|---|---|
| WOLANDS | 1964 - 1981 |
| WODETS | 1982 - 1993 |
| CFDETS_AA | > 1994 |
The landings records data are pulled from the Commercial database from 1964 to present year and an algorithm is applied to associate landings that are not allocated to a statistical area using similar characteristics of the trip to trips with known areas. Foreign landings are then pulled from the Northwest Atlantic Fisheries Organization (NAFO) website and merged with domestic landings.
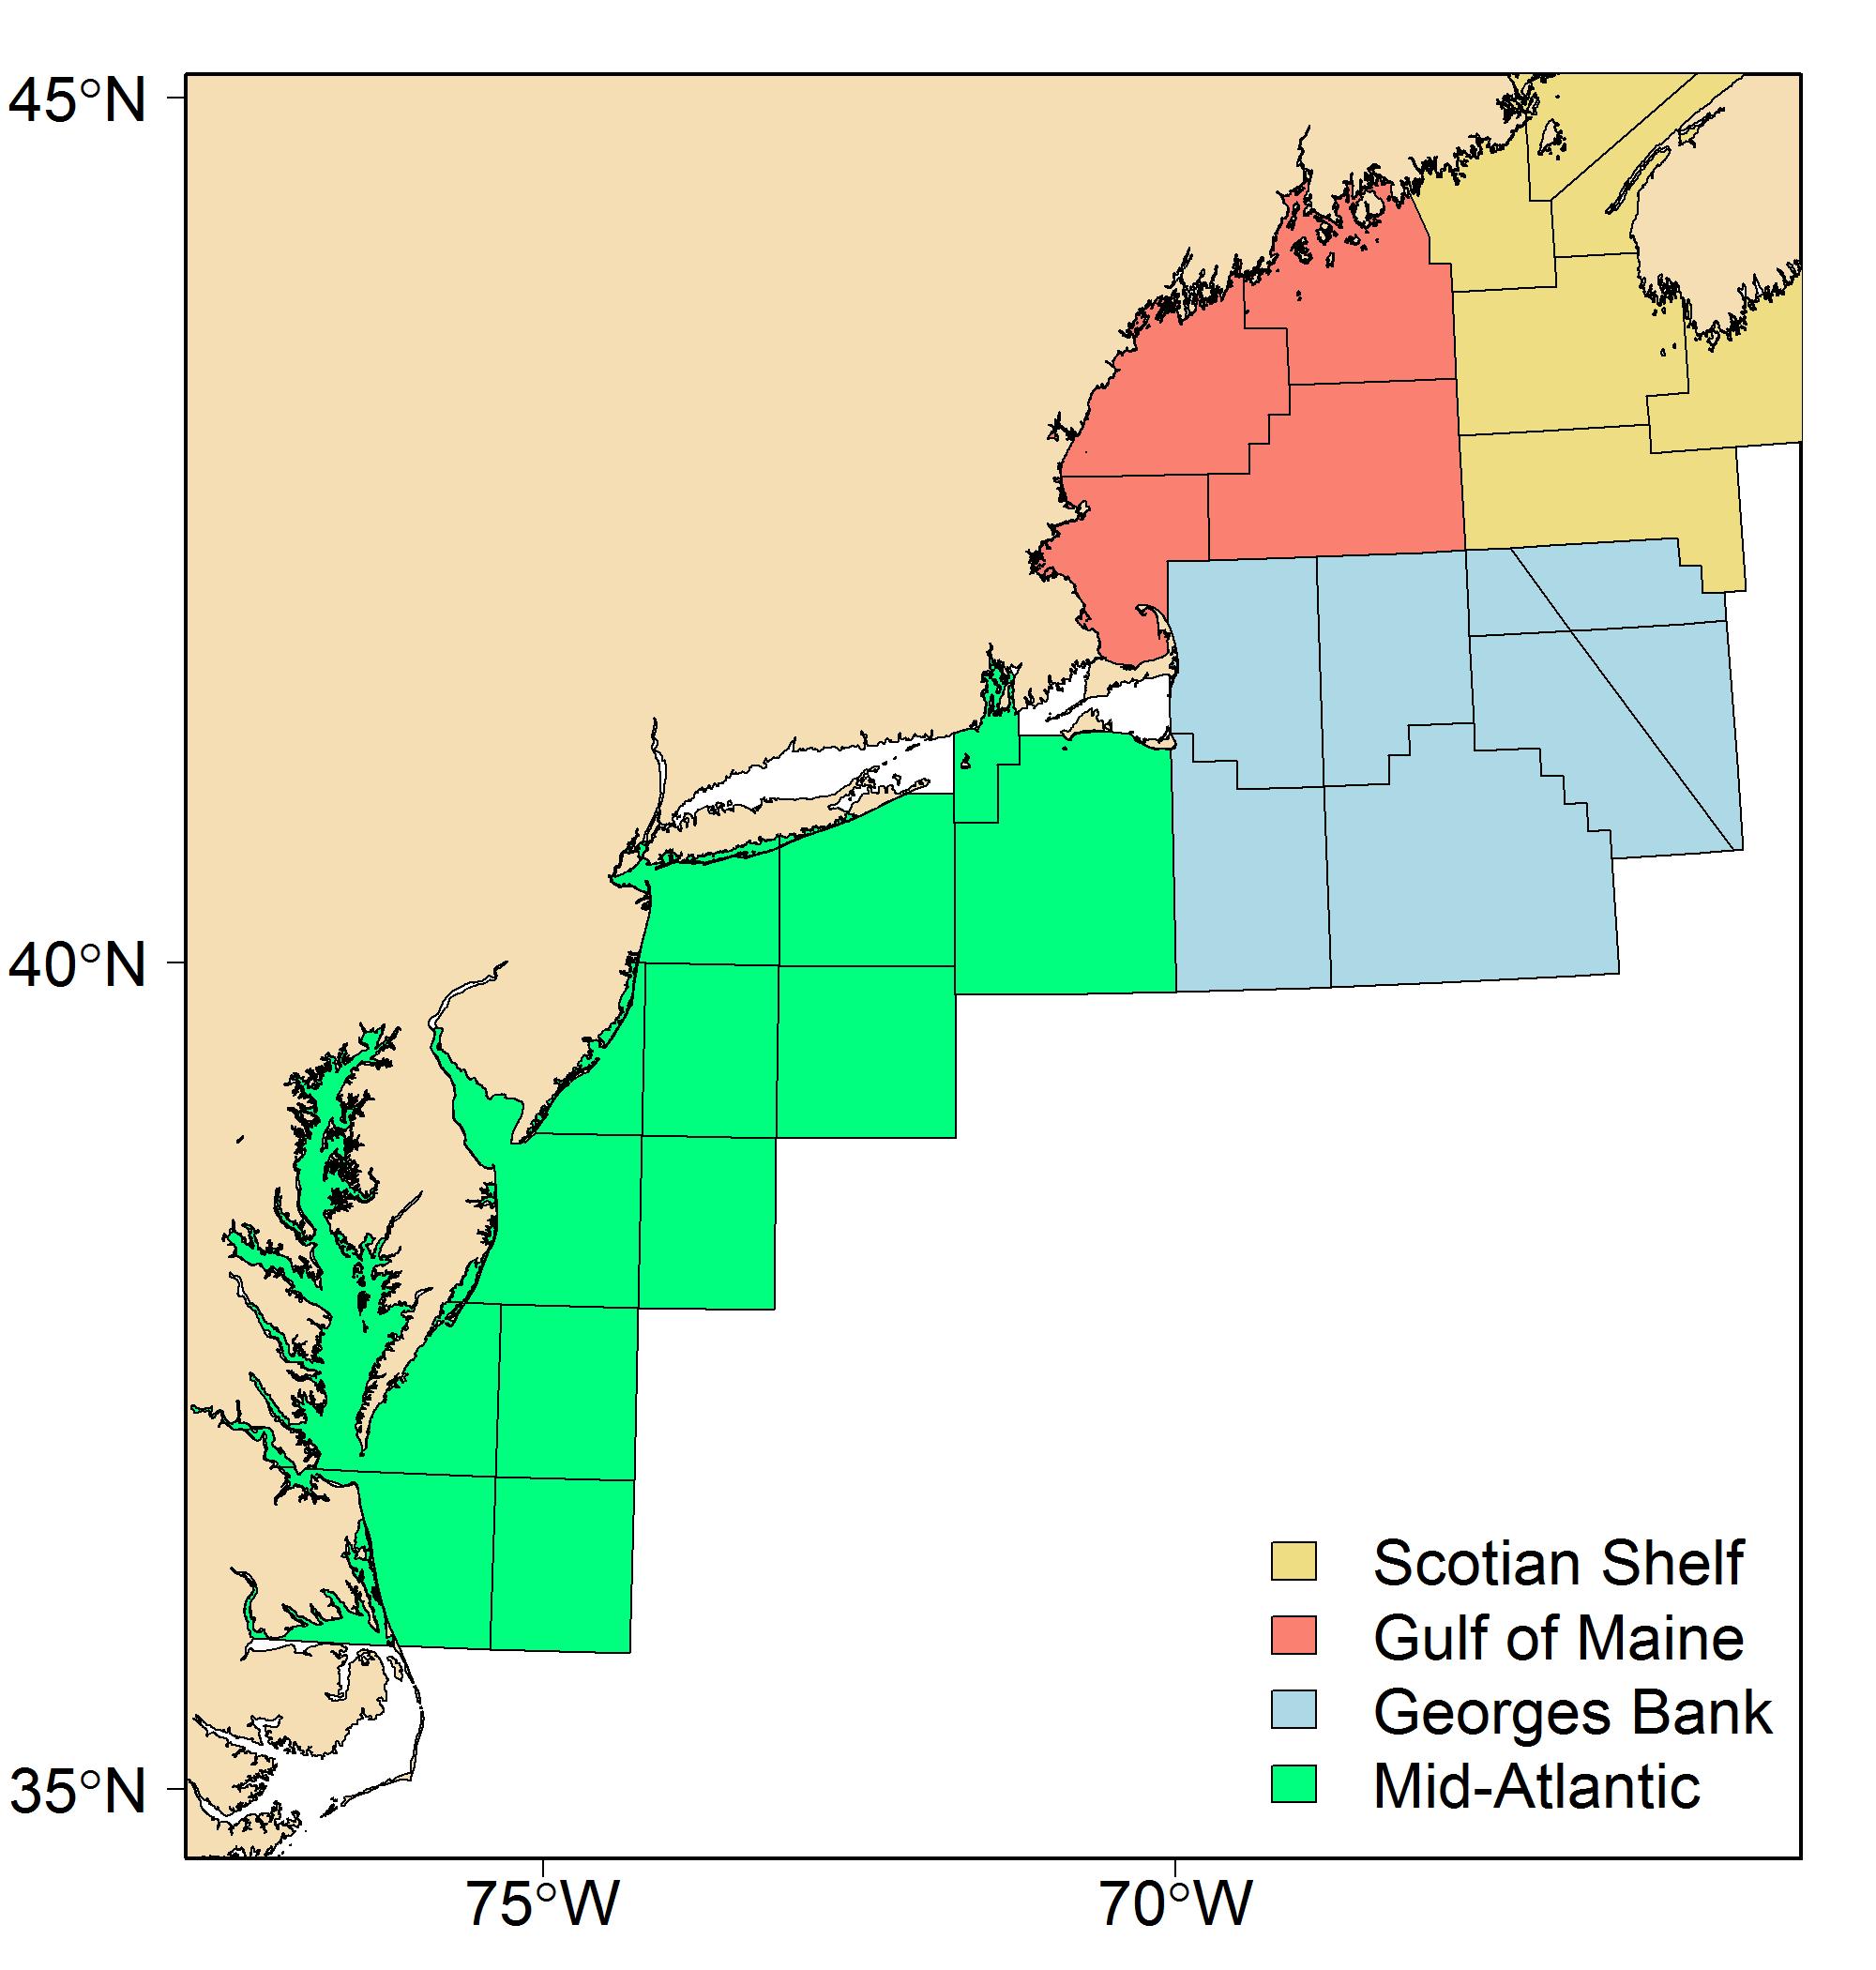
Figure 67.1: Map of the Greater Atlantic Region Statistical Areas. Colors represent the Ecological Production Unit (EPU) with which the statistical area is associated.
The R package comlandr is used to pull the data. Specifically, the package pulls the temporal and spatial information as well as vessel and gear characteristics associated with the landings in addition to the weight, value, and utilization code of each species in the landings record. The package allows for landed weights as well as live weights. For all but shellfish species, landed weights are used for the State of the Ecosystem report. Landings are aggregated by species, utilization code, and area as well as by month, gear, and tonnage class. All weights are then converted from pounds to metric tons. Landings values are also adjusted for inflation using the Producer Price Index by Commodity for Processed Foods and Feeds: Unprocessed and Prepared Seafood. Inflation is based on January of the terminal year of the data pull ensuring that all values are in current dollar prices.
Several species have additional processing steps after the data is pulled. Skates are typically landed as a species complex. In order to segregate the catch into species, the ratio of individual skate species in the NEFSC bottom trawl survey is used to disaggregate the landings. A similar algorithm is used to separate silver and offshore hake which can be mistaken for one another. Finally, Atlantic herring landings are pulled from a separate database as the most accurate weights are housed by the State of Maine. The comlandr package pulls from the State database and replaces the less accurate numbers from the federal database.
The majority of landings data are associated with a Greater Atlantic Region Statistical Areas (Figure 67.1). For those that are not, the package attempts to assign them to an area using similar characteristics of trips where the area is known. To simplify this task, landings data are further aggregated into quarter and half year, small and large vessels, and eight major gear categories (Table 67.4). Landings are then proportioned to areas that meet similar characteristics based on the proportion of landings in each area by that temporal/vessel/gear combination. If a given attribute is unknown, the algorithm attempts to assign it one, once again based on matched characteristics of known trips. Statistical areas are then assigned to their respective Ecological Production Unit (Table 67.2).
| EPU | Stat Areas |
|---|---|
| Gulf of Maine | 500, 510, 512, 513, 514, 515 |
| Georges Bank | 521, 522, 523, 524, 525, 526, 551, 552, 561, 562 |
| Mid-Atlantic | 537, 539, 600, 612, 613, 614, 615, 616, 621, 622, 625, 626, 631, 632 |
| Major gear | |
|---|---|
| 1 | Otter Trawls |
| 2 | Scallop Dredges |
| 3 | Other Dredges |
| 4 | Gillnets |
| 5 | Longlines |
| 6 | Seines |
| 7 | Pots/Traps |
| 8 | Midwater |
| 9 | Other |
The final step is to pull the foreign landings from the NAFO database. US landings are removed from this extraction so as not to be double counted. NAFO codes and CAMS codes differ so the package rectifies those codes to ensure that the data is seamlessly merged into the domestic landings. Foreign landings are flagged so that they can be removed if so desired.
67.1.2 Data extraction
comlandr is an R package used to extract relevant data from the database.
67.1.2.1 Data processing
The landings data were formatted for inclusion in the ecodata R package
67.1.3 Data analysis
Fisheries dependent data is used in several indicators for the State of the Ecosystem report; the more complicated analyses are detailed in their own sections (ie. bennet index). The most straightforward use of this data are the region total and aggregate landings indicators. Regional totals sum landings three ways: 1) All landings regardless of management authority and eventual use (i.e. food or bait), 2) All landings used for seafood but regardless of management authority, and 3) All landings used for seafood and managed by the regional fisheries management council for whom the report is presented.
Landings are also calculated by aggregate groups per region. These are calculated by first assigning the various species into aggregate groups. Landings are then summed by year, EPU, aggregate group, and whether they are managed by the regional fisheries management council or not. Proportions of managed landings to total landings are also calculated and have been reported in some reports.
catalog link https://noaa-edab.github.io/catalog/comdat.html