4 Survey Data
Description: Survdat (Survey database)
Found in: State of the Ecosystem - Gulf of Maine & Georges Bank (2017+), State of the Ecosystem - Mid-Atlantic (2017+)
Indicator category: Database pull
Contributor(s): Andy Beet
Data steward: Andy Beet andrew.beet@noaa.gov
Point of contact: Andy Beet andrew.beet@noaa.gov
Public availability statement: Source data are available to qualified researchers upon request (see “Access Information” here).
Note: Due to the COVID-19 pandemic there were no surveys in 2020
4.1 Methods
The Northeast Fisheries Science Center (NEFSC) has been conducting standardized bottom trawl surveys in the fall since 1963 and spring since 1968. The surveys follow a stratified random design. Fish species and several invertebrate species are enumerated on a tow by tow basis (Azarovitz 1981). The data are housed in the NEFSC’s survey database (SVDBS) maintained by the Ecosystem Survey Branch.
Direct pulls from the database are not advisable as there have been several gear modifications and vessel changes over the course of the time series (Miller et al. 2010). Survdat was developed as a database query that applies the appropriate calibration factors for a seamless time series since the 1960s. As such, it is the base for many of the other analyses conducted for the State of the Ecosystem report that involve fisheries independent data.
The R package survdat is used to pull and process the data. For the purposes of the State of the Ecosystem reports only the spring and fall data are used. survdat identifies those research cruises associated with the seasonal bottom trawl surveys and pulls the station and biological data. Station data includes tow identification (cruise, station, and stratum), tow location and date, as well as several environmental variables (depth, surface/bottom salinity, and surface/bottom temperature). Stations are filtered using a station, haul, gear (SHG) code for tows prior to 2009 and a tow, operations, gear, and aquisition (TOGA) code from 2009 onward. The codes that correspond to a representative tow are SHG <= 136 or TOGA, T <= 1, O <= 3, G <= 2. Biological data includes the total biomass and abundance by species, as well as lengths and number at length.
survdat applies the calibration factors. There are four calibrartion factors applied (Table 4.1). Calibration factors are pulled directly from SVDBS. Vessel conversions were made from either the NOAA Ship Delaware II or NOAA Ship Henry Bigelow to the NOAA Ship Albatross IV which was the primary vessel for most of the time series. The Albatross was decommissioned in 2009 and the Bigelow is now the primary vessel for the bottom trawl survey.
| Name | Code | Applied |
|---|---|---|
| Door Conversion | DCF | <1985 |
| Net Conversion | GCF | 1973 - 1981 (Spring) |
| Vessel Conversion I | VCF | Delaware II records |
| Vessel Conversion II | BCF | Henry Bigelow records |
4.1.1 Data sources
survdat is an R package that allows for queries of the NEFSC survey database (SVDBS).These data are available to qualified researchers upon request. More information on the data request process is available under the “Access Information” field here.
4.1.2 Data extraction
Extraction methods are described above. The R package survdat was used in the survey data extraction process.
4.1.3 Data analysis
The fisheries independent data obtained using survdat is used in a variety of
SOE products; Aggregate biomass, Survey diversity metrics, Expected number of species, Species Condition, Massachusetts inshore survey
Since 2020, survey strata where characterized as being within an Ecological Production Unit based on where at least 50% of the area of the strata was located (Figure 4.1). While this does not create a perfect match for the EPU boundaries it allows us to calculate the variance associated with the index as the survey was designed.
Prior to 2020, survdat would post stratified into EPUs by labeling stations with the EPU that contained them.
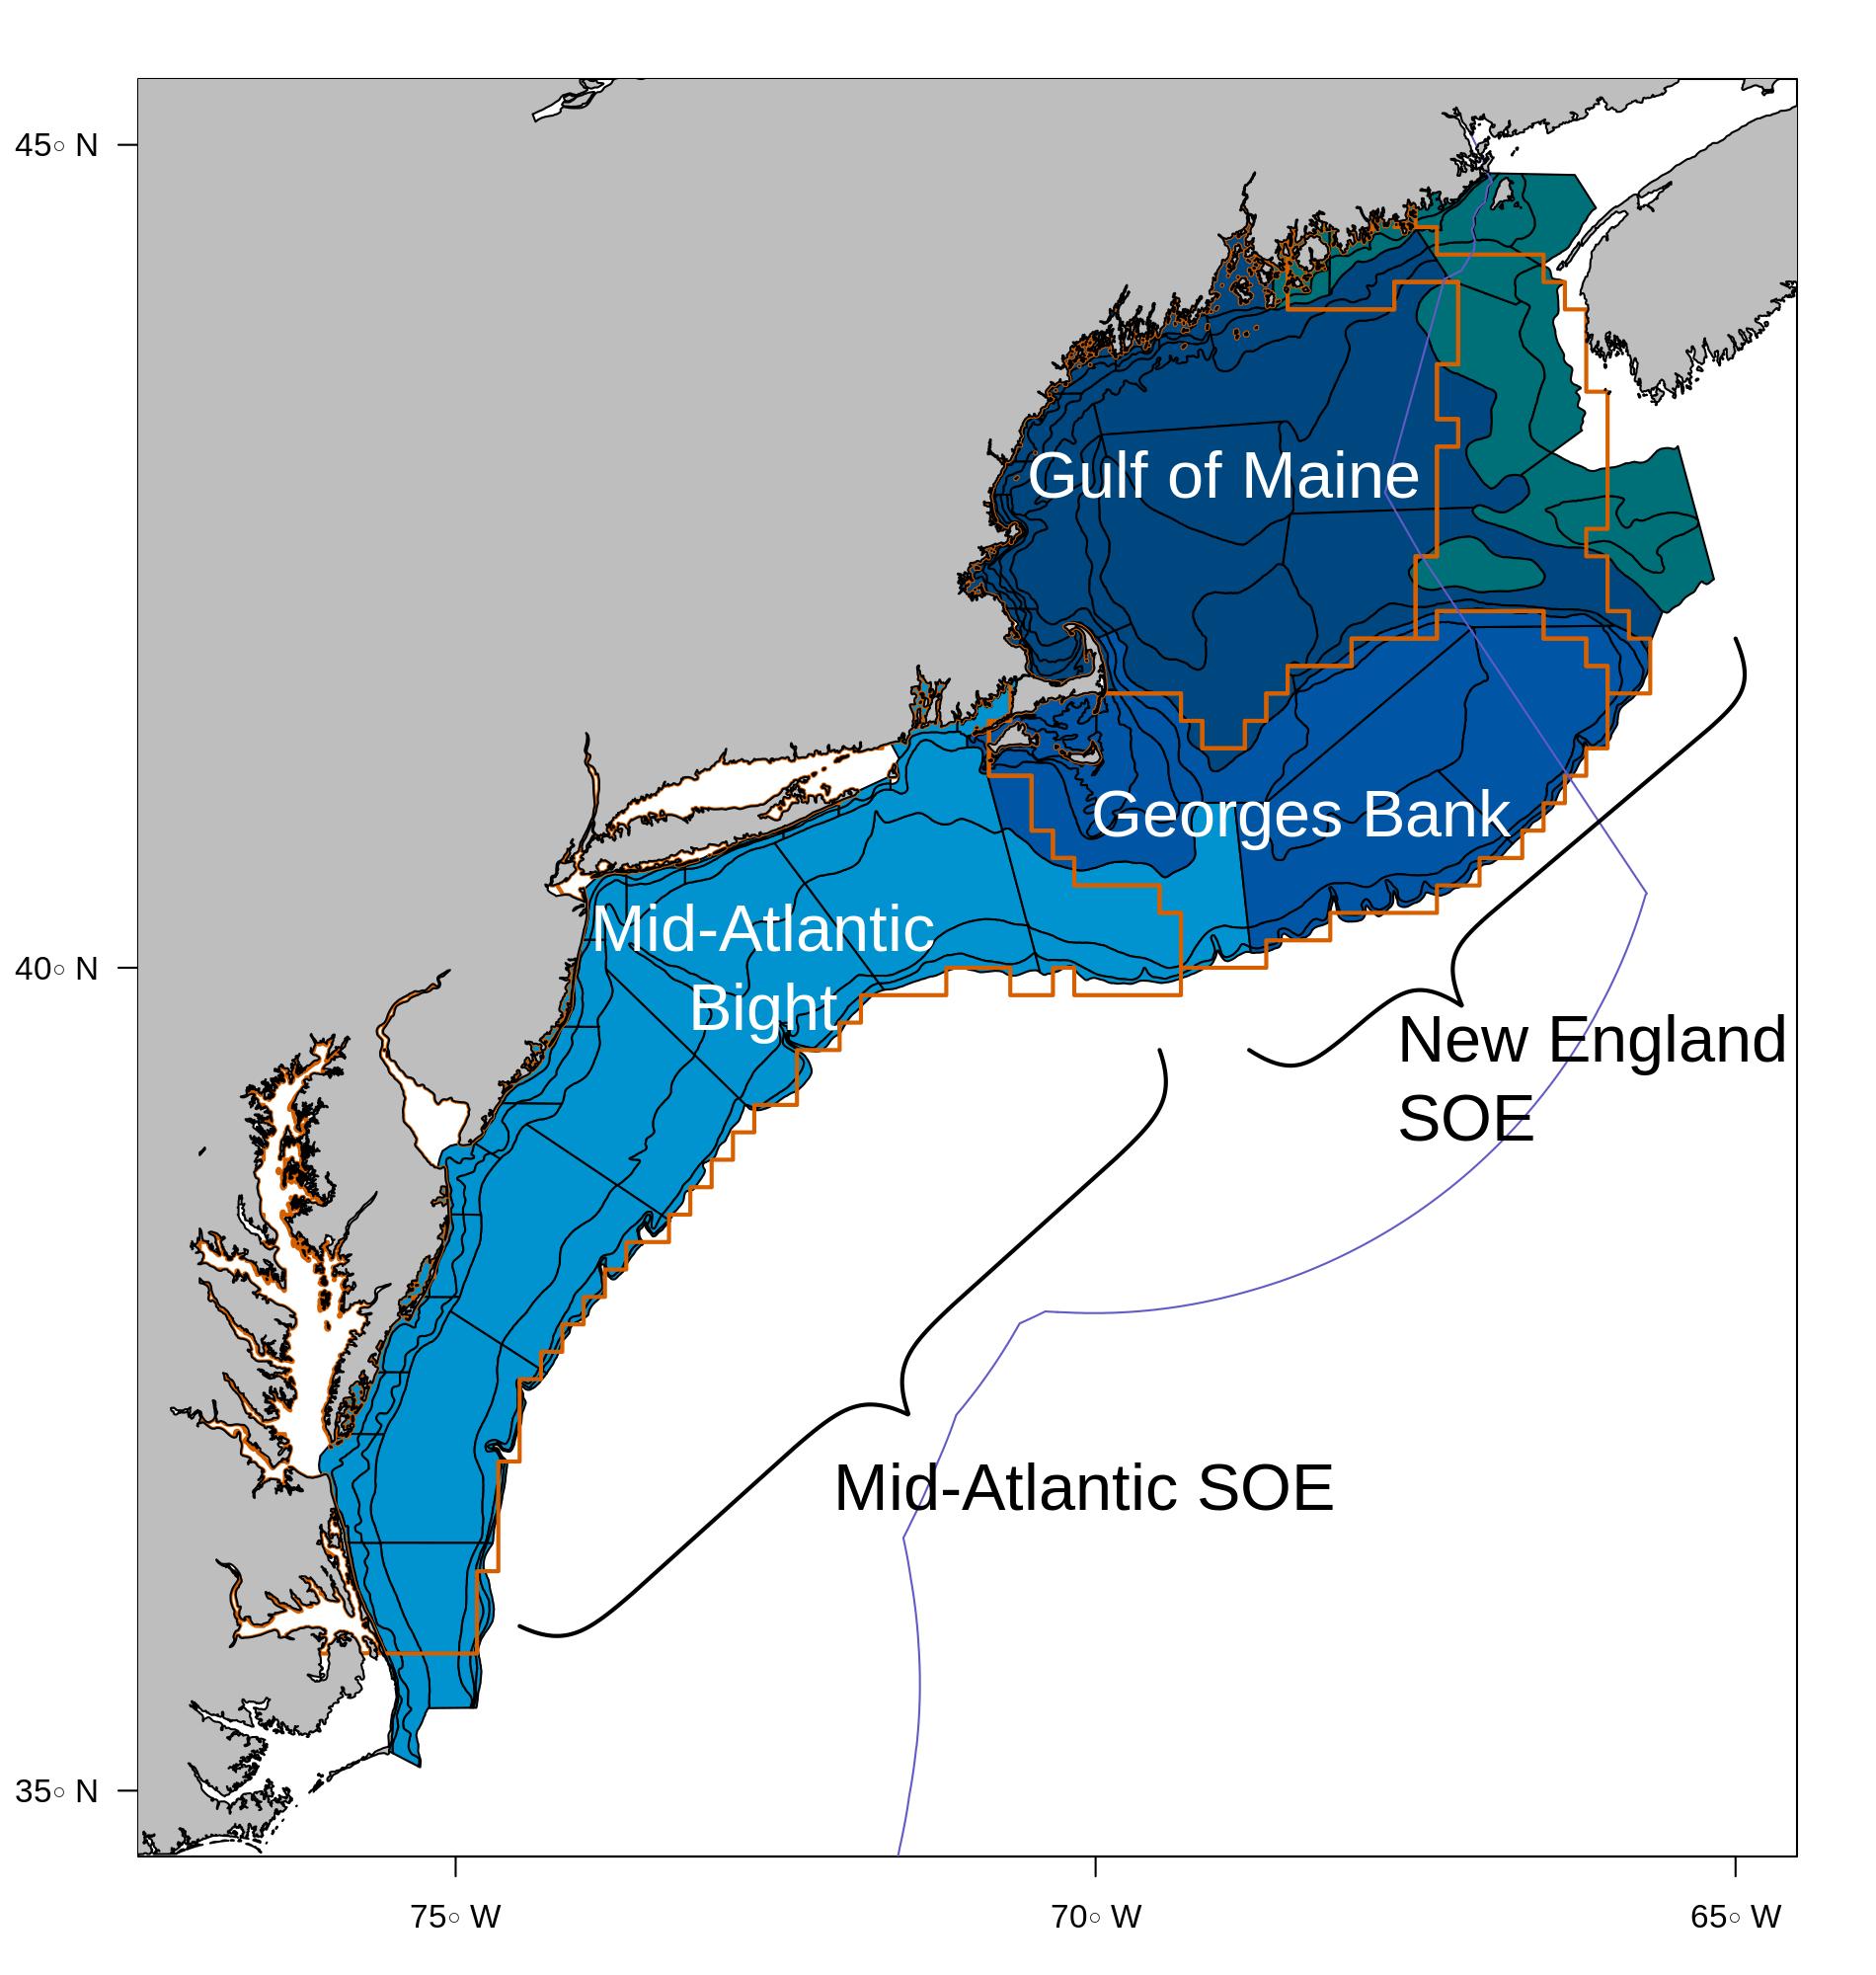
Figure 4.1: Map of the Northeast Shelf broken into the four Ecological Production Units by strata.Strata were assigned to an EPU based on which one contained at least 50% of the area of the strata.
catalog link No associated catalog page