97 Storminess Indicator
Description: Long-term trends in storminess based on wind speed and wave height exceeding specific extreme thresholds that are related to the effect on fisheries and fishing behavior.
Indicator category: Database pull with analysis
Found in:
Contributor(s): Art DeGaetano (Cornell, Northeast Climate Center), Gabe Larouche (Cornell, Northeast Climate Center), Kimberly Hyde (NEFSC), Ellen Mecray (NOAA/NESDIS/NCEI)
Data steward: Art DeGaetano Arthur.T.DeGaetano@noaa.gov
Point of contact: Art DeGaetano Arthur.T.DeGaetano@noaa.gov
Public availability statement: Source data is freely available to the public (see Data Sources).
97.1 Methods
97.1.1 Data sources
European Centre for Medium-Range Weather Forecasts atmospheric reanalysis version 5 (ERA5) accessed via the Copernicus Climate Change Service https://cds.climate.copernicus.eu/cdsapp#!/dataset/reanalysis-era5-single-levels?tab=form. The 3-hour data cover the Earth on a 30km grid and are freely available to the public.
97.1.2 Data extraction
The following variables were extracted from the input data: + 10m_u_component_of_wind + ’10m_v_component_of_wind + Mean_sea_level_pressure + Mean_wave_period + significant_height_of_combined_wind_waves_and_swell
Extractions were limited to the region bounded by 80°W, 50°N, 60°W, and 20°N.
Extraction code fetch_data.py is available at: https://github.com/nrcc-cornell/regional-swh
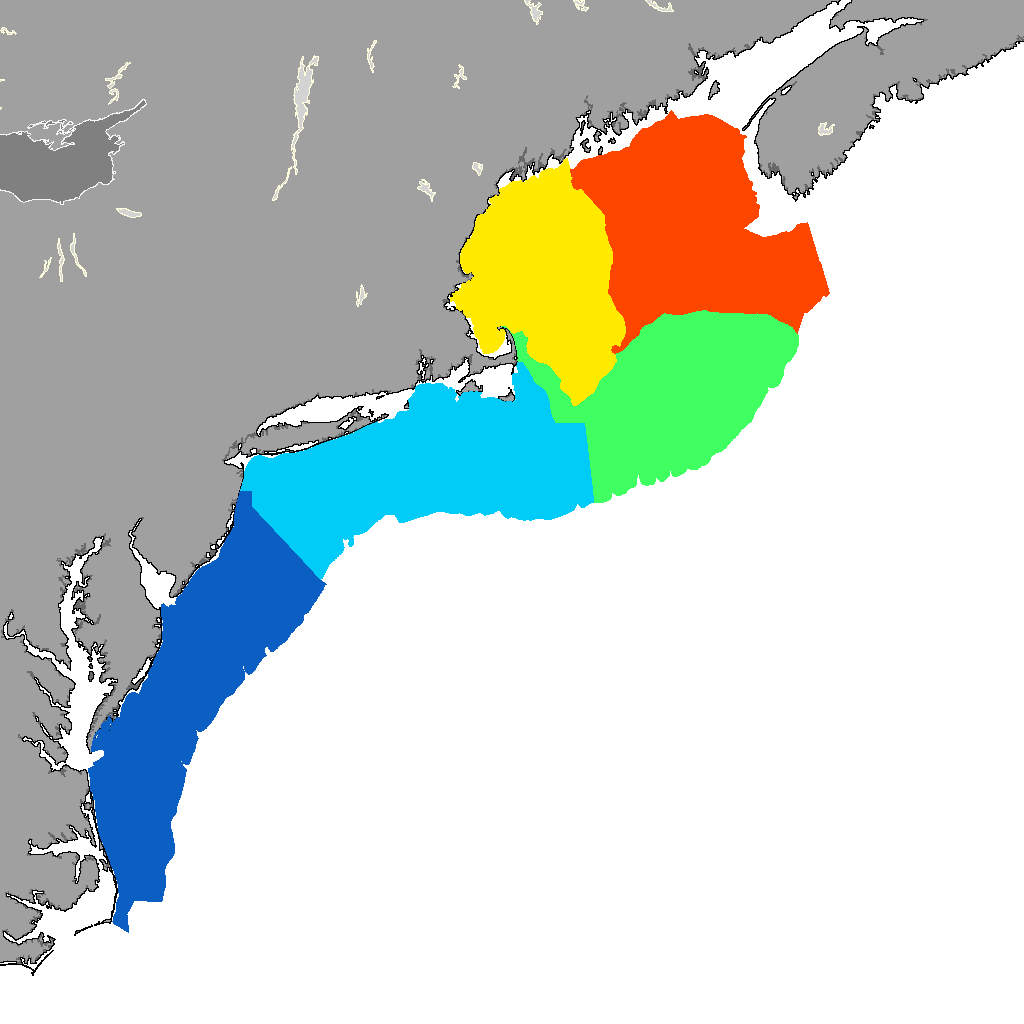
Data were subset into five regions: southern Mid-Atlantic bight, northern Mid-Atlantic bight, Georges Bank, western Gulf of Maine, eastern Gulf of Maine.
97.1.3 Data processing
Code for processing wind process_data.py and wave data can be found at: https://github.com/nrcc-cornell/regional-swh
The wind index was defined using four thresholds set at the beginning of the processing code. Gale_thres = 34 kts, temporal_thres = 3 hours, intervene = 96 hours, and st = 0.25. These translate to the index defining storminess events as windspeeds ≥34kts that persist for at least 3hrs, are separated from previous events by at least 96 hrs and occur at more than 25% of the 30km grid points within a region. For wave height data, the same thresholds are used with the exception of gale_thres being replaced with wave_t=5. This sets the index to events with >5m wave heights.
The data were analyzed at their base 1-hour temporal and 30 km spatial resolutions. At each gridpoint falling within a region (e.g. southern Mid-Atlantic bight) the raw data were screened to identify winds exceeding the gale threshold. Then each point was further analyzed to determine if at least 3 consecutive hours exceeded the threshold. If more than 25% of the grid points within the region met these criteria, an event was indicated and the annual event tally for the region was increased by one, provided it was separated from a previous event by >96 hours.
Code used to process storminess data for inclusion in ecodata can be found on github - NOAA-EDAB/ecodata.
catalog page No associated catalog page