82 Regime Shift Analysis
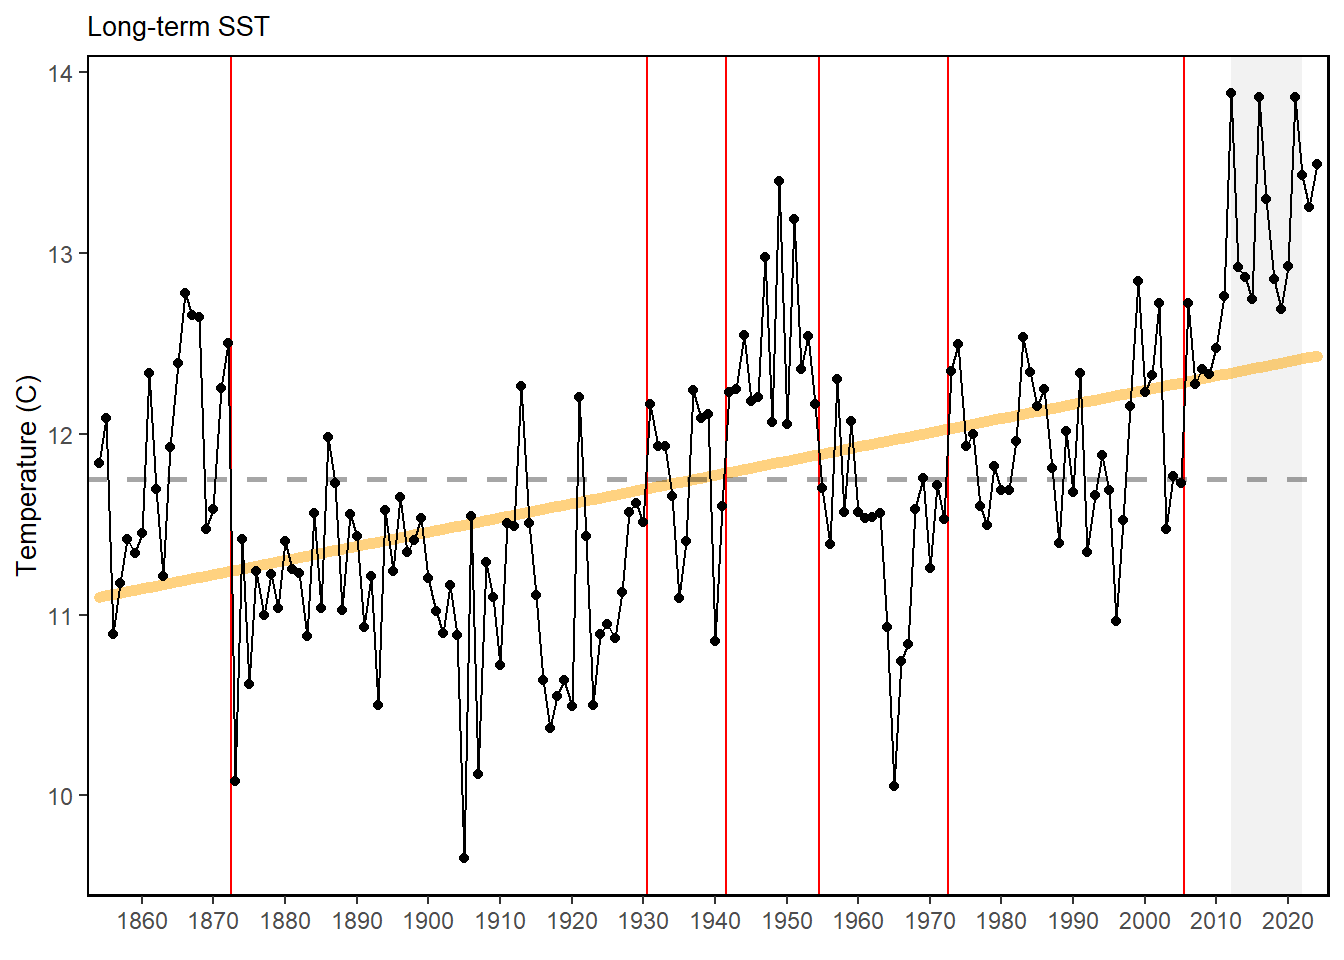
Description: Qualitative regime shift analysis with plotting tool
Found in: State of the Ecosystem - Gulf of Maine & Georges Bank (2023+), State of the Ecosystem - Mid-Atlantic (2023+)
Indicator category:
Contributor(s): Kimberly Bastille
Data steward: NA
Point of contact: Kimberly Bastille, kimberly.bastille@noaa.gov
Public availability statement: NA
82.1 Methods
The regime analysis uses the rpart package to calculate breaks in the time series. rpart creates regression trees using classification and recursive partitioning. This methodology was outlined “Classification and regression trees”, a 1984 book written by Leo Breiman and others.
The code used to calculate the statistics behind the plotting visuals can be found in ecodata. Lines 12-16 show the tree calculations and the pruning.
There are many ways to calculate regime shifts. This method had been applied previously for select indicators and has been scaled up to apply to other time series datasets for the State of the Ecosystem reports.