76 Bennet Indicator
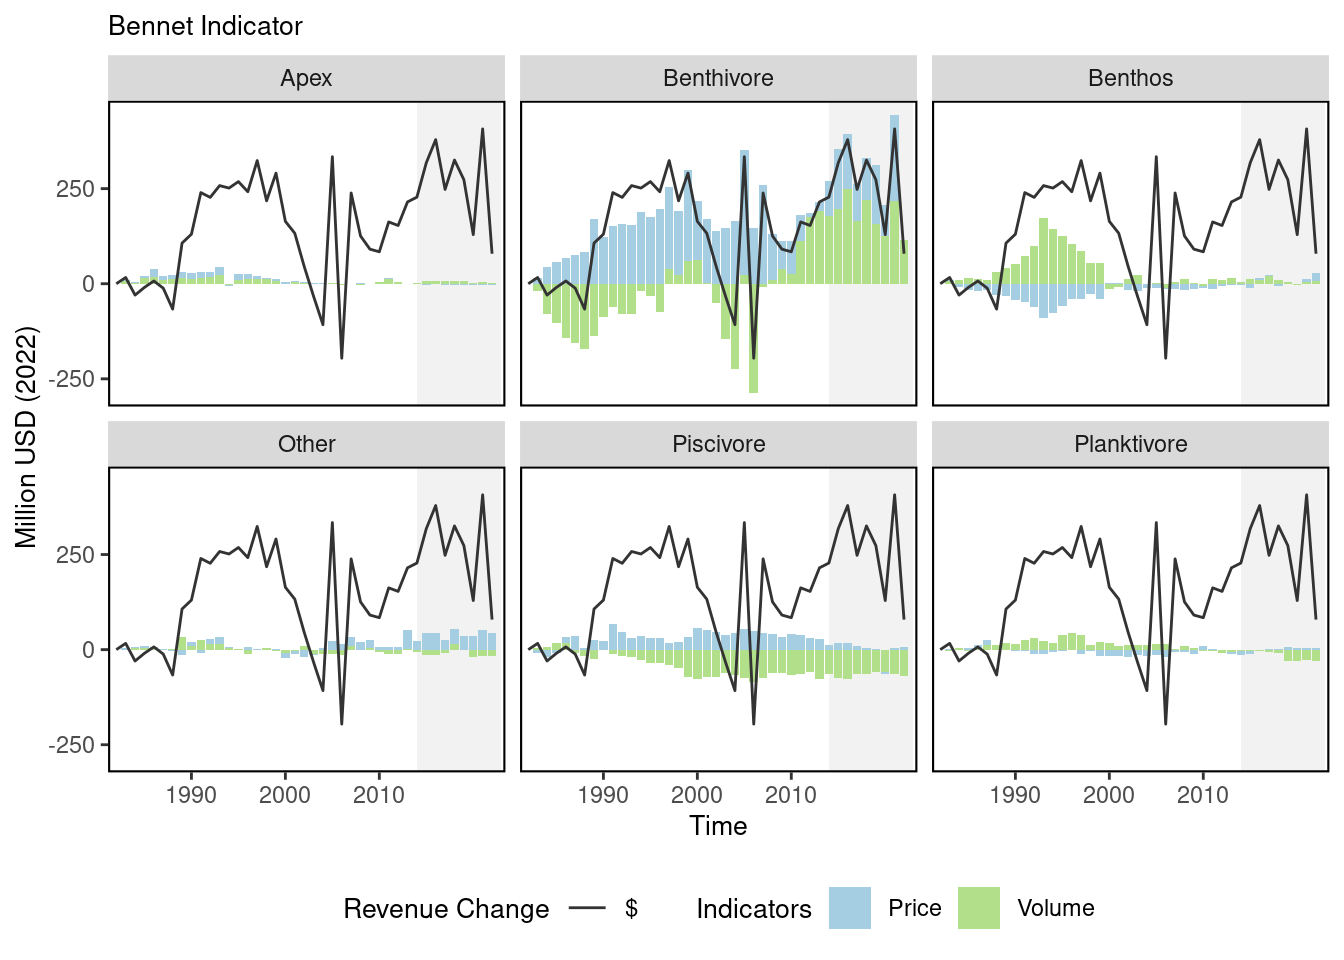
Description: The data presented here are changes in revenue ($ real) split into a price indicator and a volume indicator. The sum of the price and the volume indicator is equal to the revenue change relative to a base year, which is 1982.
Indicator family:
Contributor(s): John Walden, Geret DePiper, Sean Lucey
Affiliations: NEFSC
76.1 Introduction to Indicator
The Bennet (1920) indicator (BI) was first used to show how a change in social welfare could be decomposed into a sum of a price and quantity change indicator ([111]). It is called an indicator because it is based on differences in value between time periods, rather than ratios, which are referred to as indices. The BI is the indicator equivalent of the more popular Fisher index ([112]), and has been used to examine revenue changes in Swedish pharmacies, productivity change in U.S. railroads ([113]), and dividend changes in banking operations [114]. An attractive feature of the BI is that the overall indicator is equal to the sum of its subcomponents [112]. This allows us to examine whether increasing (decreasing) volumes, increasing (decreasing) prices, or some combination of the two is responsible for revenue change between time periods. The volume and price indicators can be further decomposed allowing us to examine the extent to which changing quantities or prices of each output is driving revenue change.
Revenue in an EPU in a given year is the product of quantities landed and prices received from all species groups (or guilds) within the EPU. The change in revenue between any two time points can be decomposed into a volume indicator (VI) and a price indicator (PI).
The overall BI is the sum of the VI and PI, and is equal to the overall revenue change. Since revenue change is being driven by changes in the individual prices and quantities landed of each species group within an EPU, changes at the EPU level can be examined separately by taking advantage of the additive property of the indicator. For example, if there are five different species groups, the sum of each group’s VI will equal the overall EPU VI, and likewise, the sum of the PI for each group will equal the overall PI for the EPU.
76.2 Key Results and Visualizations
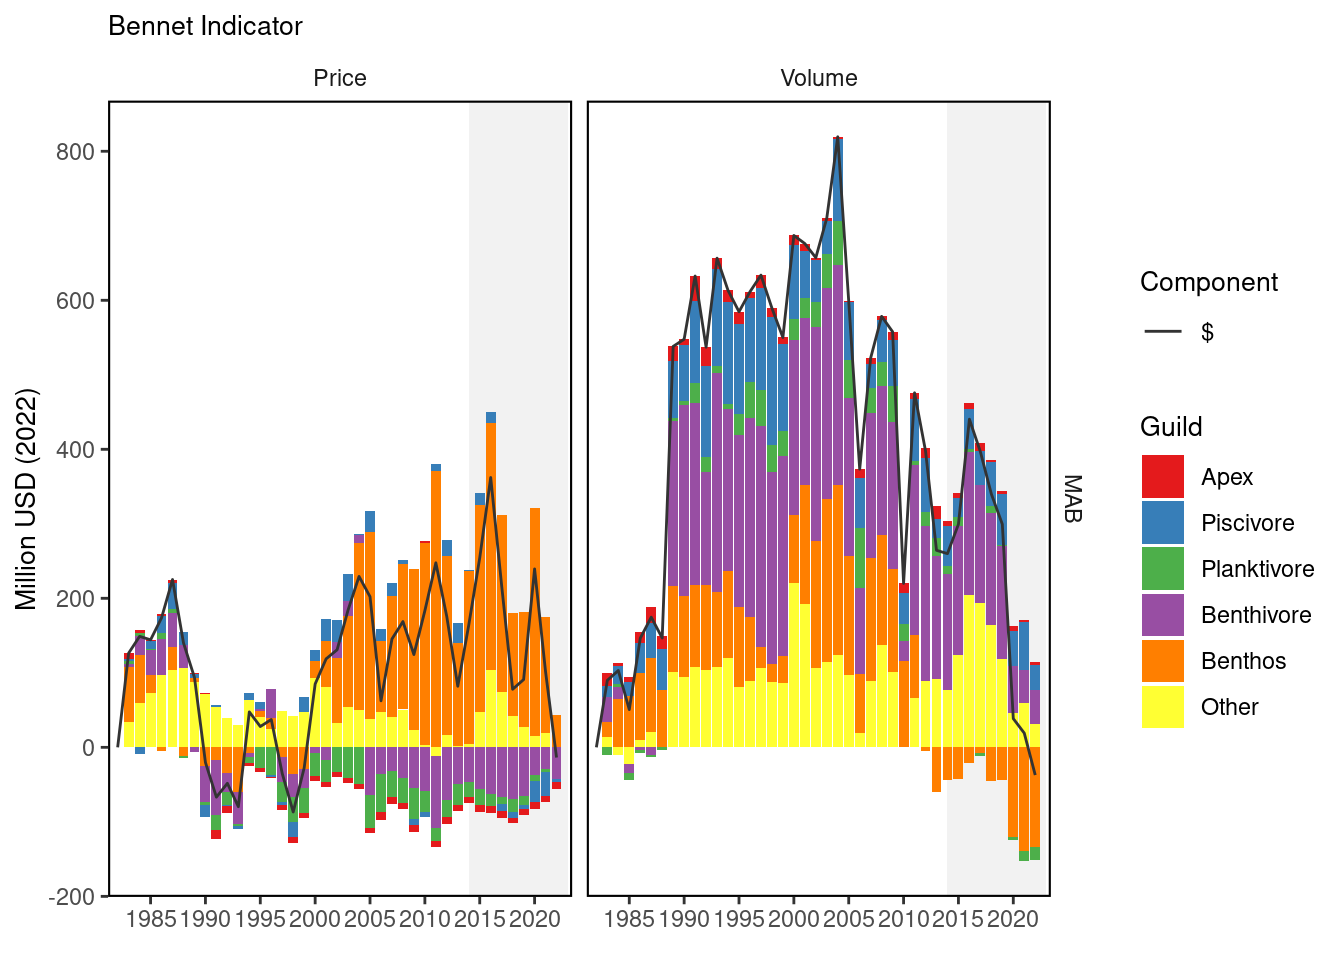
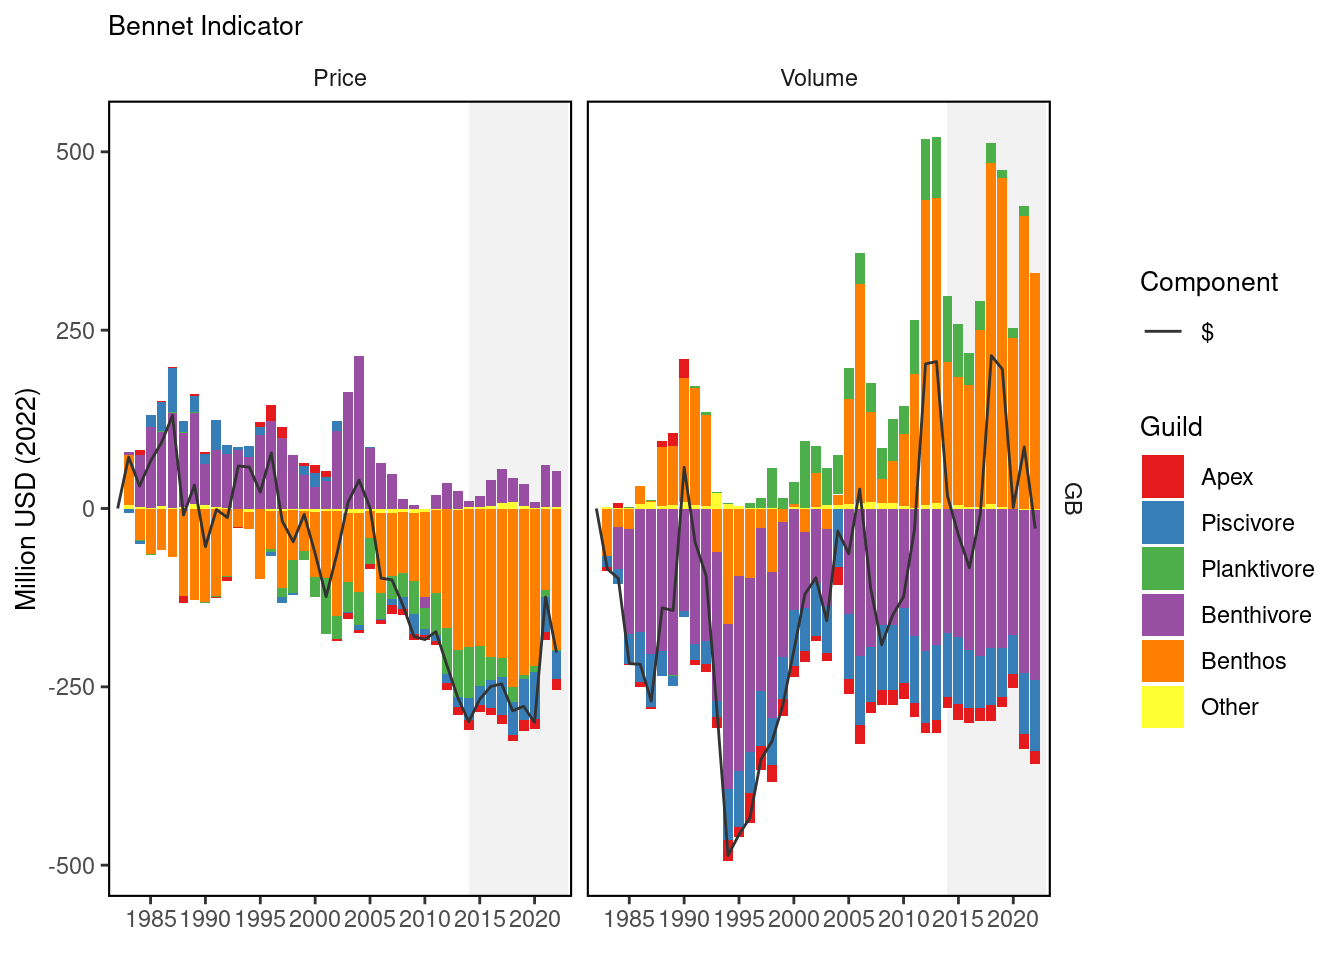
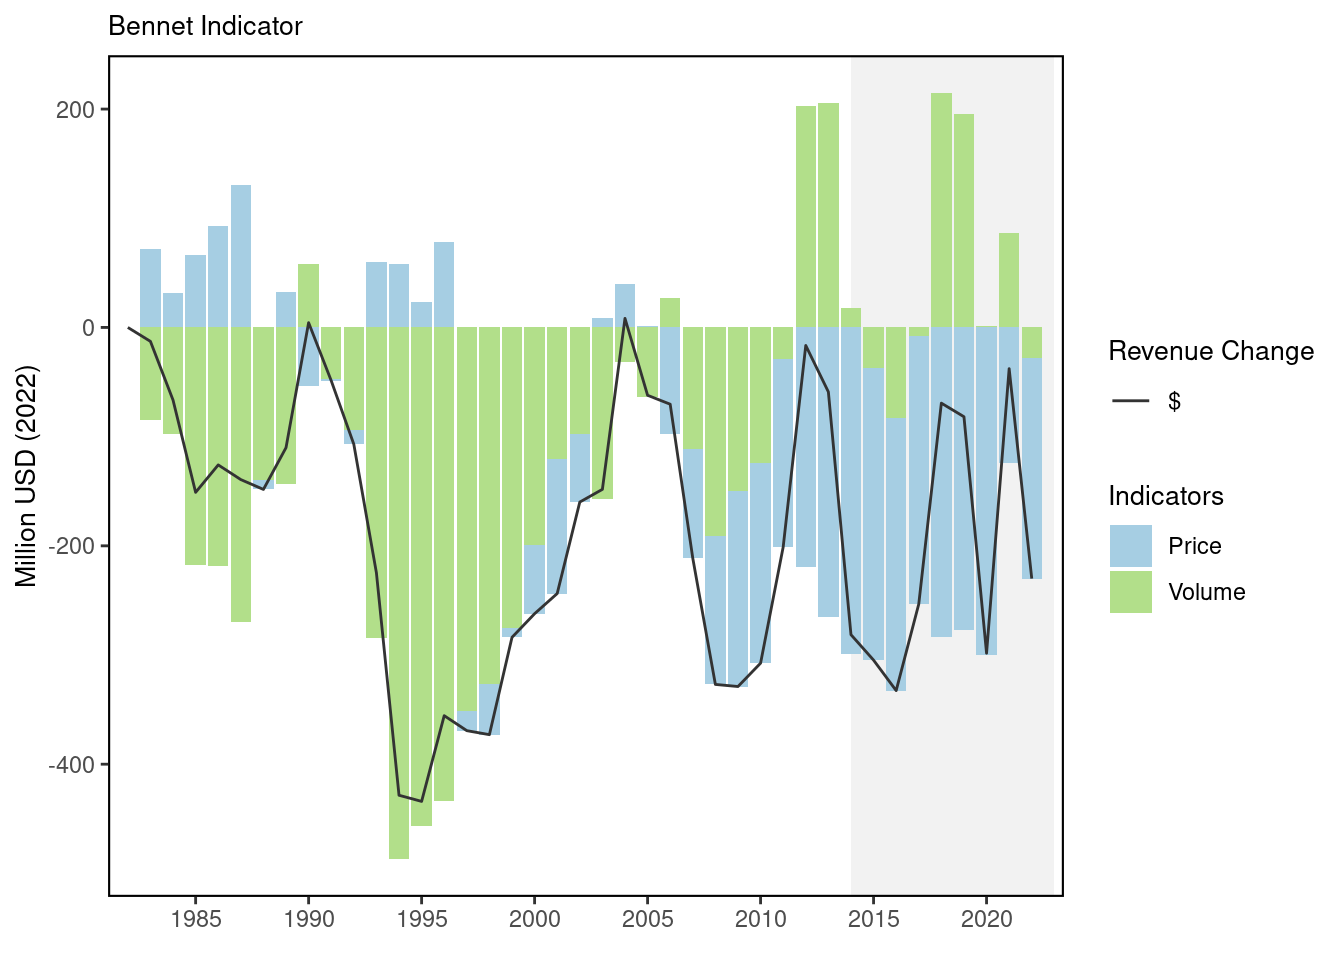
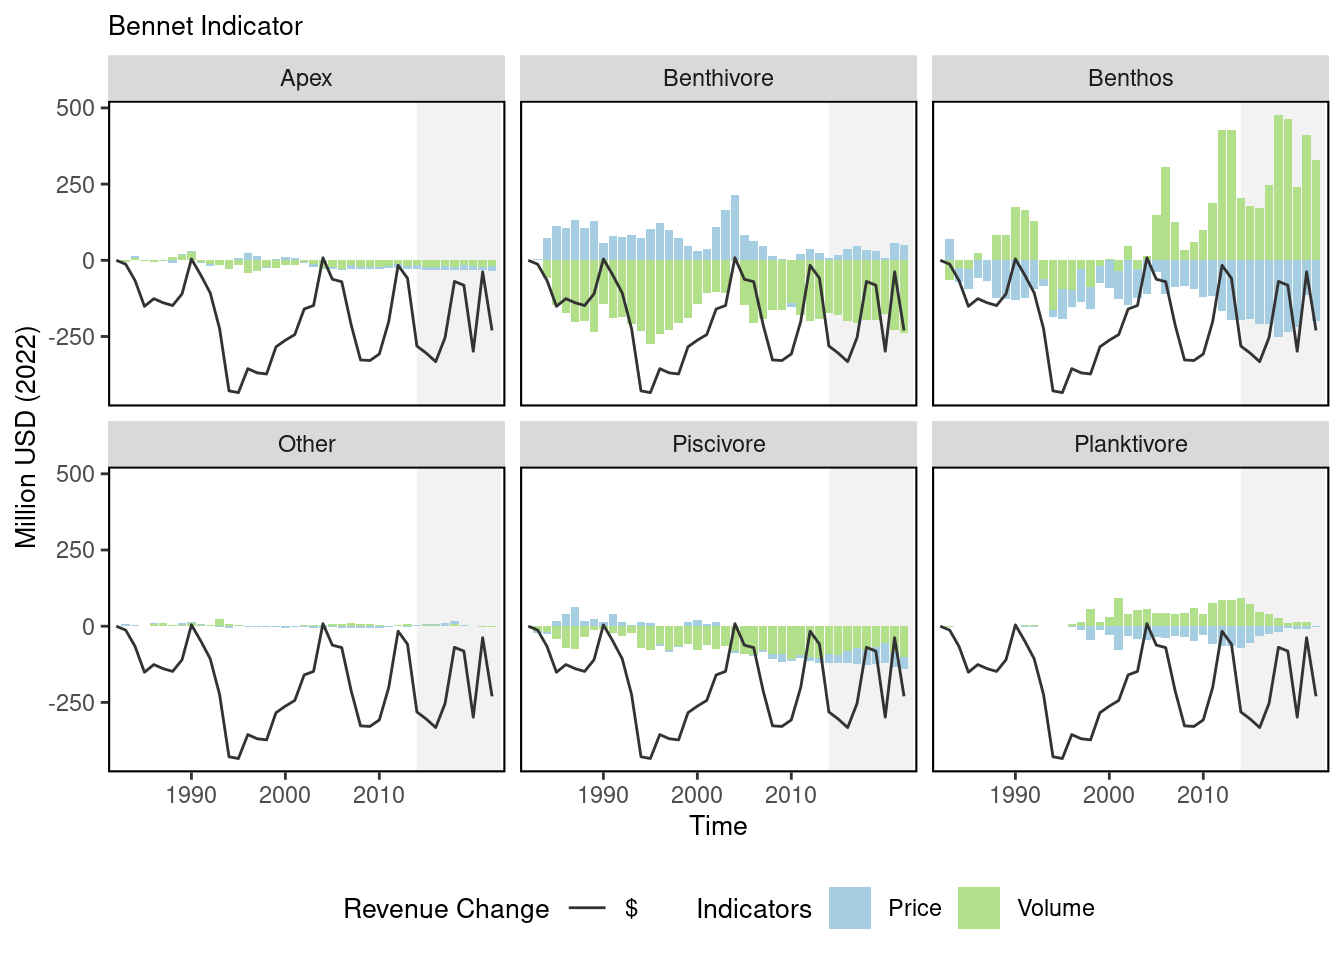
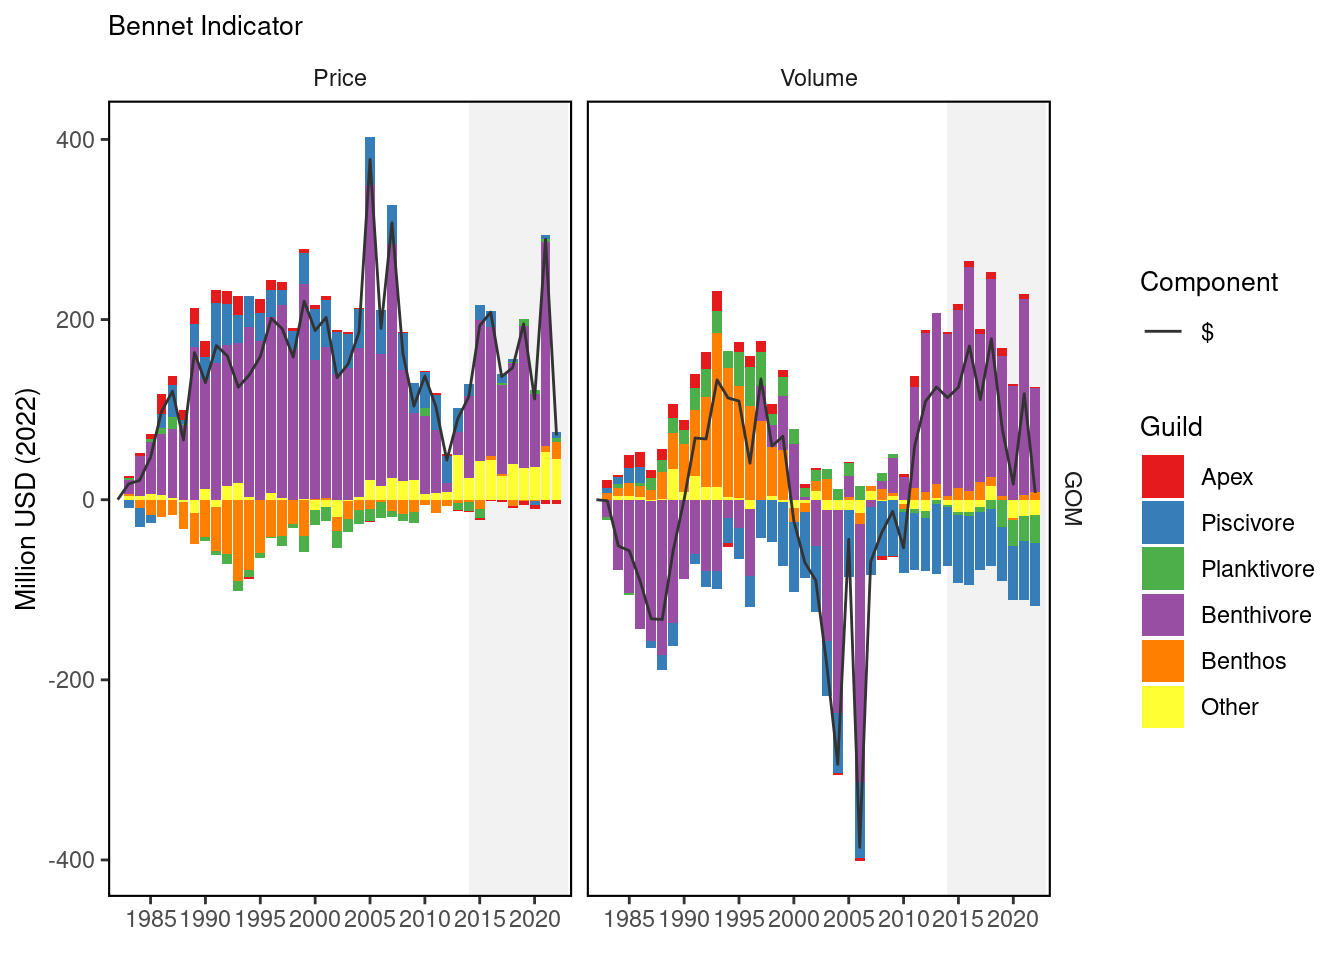
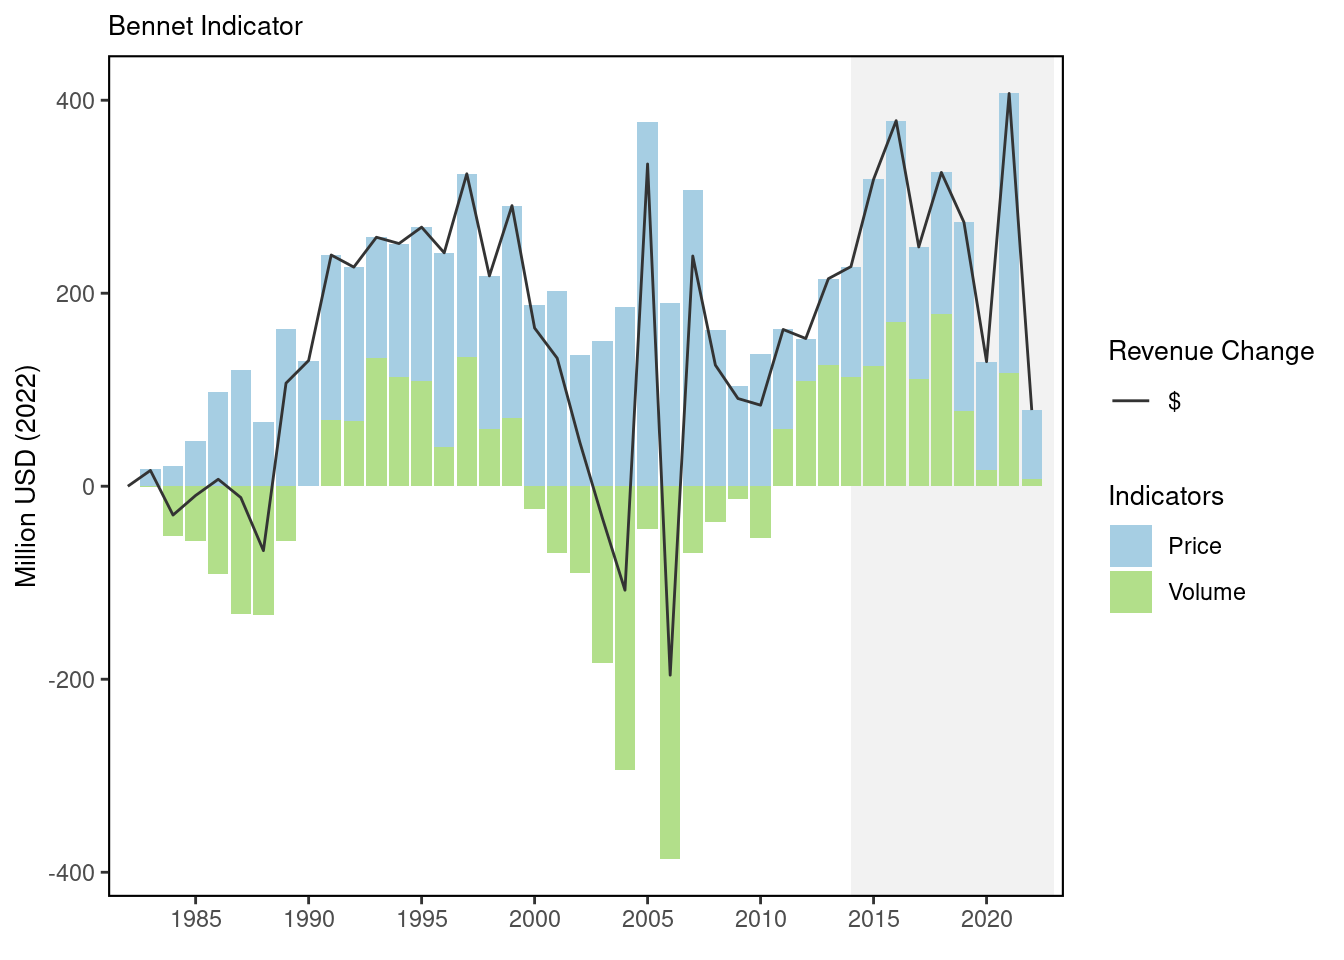
Breaking down the VI and PI further for Georges Bank shows that the negative VI is primarily due to changes in the Benthivore and Piscivore categories. Since 2010, there have been large positive gains in volumes for the Benthos category, leading to positive gains in the overall VI during some years. This is likely reflecting improvements in scallop harvests since the area rotation system has been implemented. The PI for Georges Bank shows a generally negative trend, particularly since 2004. Prices for the Benthivores contributed positively to the PI, but declines in the PI for the benthos category were the greatest contributor to the negative PI. All prices are adjusted for inflation, and positive changes means that prices are increasing faster than inflation, while negative prices means that they are not keeping pace with inflation. Gulf of Maine revenue has generally exceeded 1982 levels except for very short time periods, the last being 2004 and 2006. Generally, revenue has been higher due to increasing prices (PI). Since 2010, both increasing volumes (VI) and prices (PI) have contributed to positive revenue change. The VI indicator showed a cyclical type of pattern between 1982 and 2023 with the VI being mostly influenced by the Benthivore and Benthos categories. After 2010, the Benthivore category was the biggest influence on the VI. This was likely due to increases in lobster landings. The PI was positive for the entire time period, and this was due to increase in the Benthivore category. The Piscivore and “Other” categories showed positive prices throughout the time-period, while the Benthos category was generally negative before turning positive after 2015. In the Mid-Atlantic region prices were higher than 1982 levels with the exception of four years prior to 2000. Examination of the VI in more detail showed positive contributions to revenue gains from all categories peaking in 2003, followed by declines in subsequent years. The PI showed a positive trend for most of the years in the time series with the indicator increasing from 1999 through 2016, before declining. The PI gain after 1999 was mainly due to the Benthos category.
76.3 Indicator statistics
Spatial scale: The BI, PI and VI are calculated for the GB, GOM and MAB EPU separately
Temporal scale: The BI, PI and VI are all calculated on an Annual Basis.
Synthesis Theme:
76.4 Implications
In the first 20 years of the series, this was due to declining volumes, while in the later part of the series it was due to both declining volumes and prices compared to 1982. In terms of volumes, the positive gains in the Benthos category was offset by declines in the Benthivore category. This reflects a shift to an EPU whose value is being generated from shellfish rather than finfish.
Since 2007 increases in the Gulf of Maine VI for the Benthivore category has increased substantially, and has been the biggest contributor to the positive VI. Along with this gain, the PI for the Benthivore category has been positive for the entire time period. The increase in the Benthivore VI is thought to have been caused by increasing lobster harvests in the Gulf of Maine. Positive prices and volumes for this category contributed to the overall revenue gain seen, particularly after 2007.
For the Gulf of Maine and Georges Bank region, the decomposed VI shows that these two regions are becoming more reliant on shellfish for their landings, which likely increases risk for revenue losses if these volumes can’t be sustained. The overall BI for Gorges Bank was negative for all years in the time series, which is troubling because it shows that except for two years this particular EPU never achieved the same level of performance in terms of revenue as in 1982.
Although the Mid-Atlantic region showed declining revenue trends since 2016, revenue from harvested species is still greater than 1982 levels. The decline in revenue since 2016 is due to both declining prices and volumes. Declining volumes were due to the Benthos, Benthivore and “Other” category, while declining prices were due to the Benthos category. The declining Benthos category may be partially caused by decreases in surfclam and ocean quahogs in the southern part of their range as harvest have shifted northward.
76.5 Get the data
Point of contact: John Walden (john.walden@noaa.gov); Geret DePiper (geret.depiper@noaa.gov)
ecodata name: ecodata::bennet
Variable definitions
- Volume Indicator (VI): Change in Revenue compared to the base time period in deflated dollars attributed to changes in landings for harvested species (volumes).
- Price Indicator (PI): Change in Revenue compared to the base time period in deflated dollars attributed to changes in prices for species harvested.
- Bennet Indicator (BI): The Sum of a Volume Indicator (VI) and Price Indicator (PI) in inflation adjusted dollars, which is equal to the change in revenue.
Indicator Category:
76.7 Accessibility and Constraints
Please email john.walden@noaa.gov for further information and queries of Bennet Indicator source data.
tech-doc link https://noaa-edab.github.io/tech-doc/bennet.html