26 Benthic Invertebrate Indices
Last updated July 23, 2026
Description: Aggregate macrobenthos and megabenthos invertebrate indices from fish stomach contents
Contributor(s): Maxwell Grezlik, Sarah Gaichas, James Gartland, Brian E. Smith, Sarah Weisberg, Sean Lucey
Affiliations: NEFSC
Indicator Family:
Indicator Category:
Synthesis Theme:
26.1 Introduction to Indicator
Benthic invertebrates provide supporting ecosystem services as important prey for many economically important fish species on the Northeast US shelf. Changes to the benthic invertebrate forage base could have important implications for regional food webs. However, we lack direct measurements of benthic invertebrate biomass for most unexploited taxa. Spatially explicit indices of abundance for benthos groups were estimated using spatio-temporal modeling (VAST, [12]; [13]).
We define Macrobenthos as bottom-dwelling invertebrates retained on a 0.5-1.0 mm sieve. These include polychaete worms, small crustaceans, bivalves (non-commercial), gastropods, nemerteans, tunicates, cnidarians, brittle stars, sea cucumbers, and sand dollars.
We define Megabenthos as sea stars (Echinodermata: Asteroidea) and large Arthropods (horseshoe crabs (Merostomata), mantis shrimp (Crustacea: Stomatopoda), and crabs (Crustacea: Decapoda: Brachyura and Anomura other than hermit crabs)).
The indices developed here use similar methods to the Forage Fish Index. The spatially-explicit macrobenthos and megabenthos indices estimate the combined biomass of 833 and 105 taxa, respectively, using stomach contents information from 88 predator/size combinations from fish collected on bottom trawl surveys.
In addition to an index of benthic invertebrate biomass in each EPU, the coastwide center of gravity for the combined benthic biomass was estimated to evaluate whether distributions of benthic invertebrate biomass have changed over time.
26.2 Key Results and Visualizations
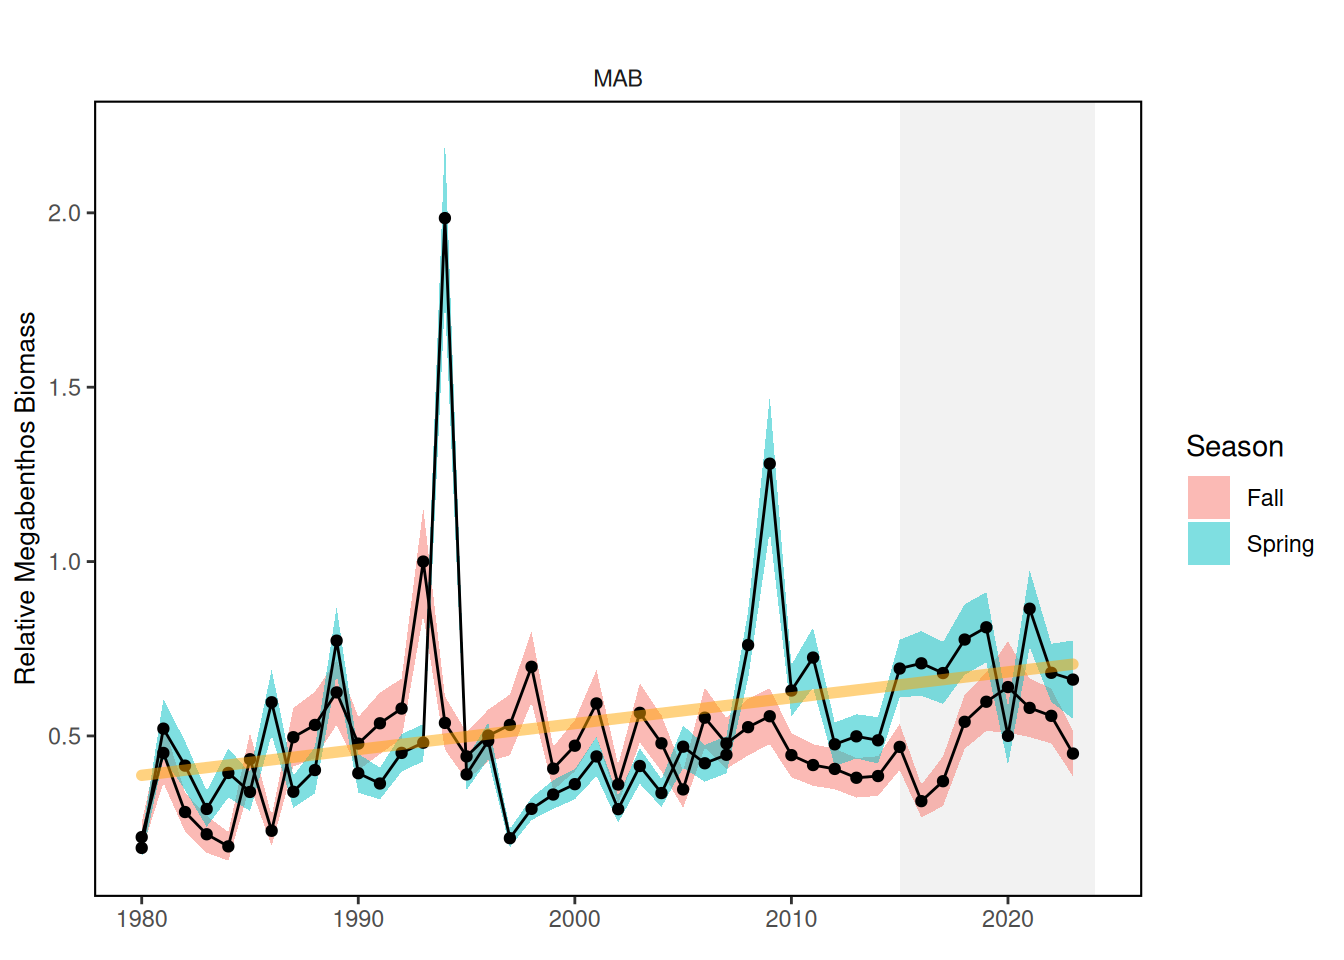
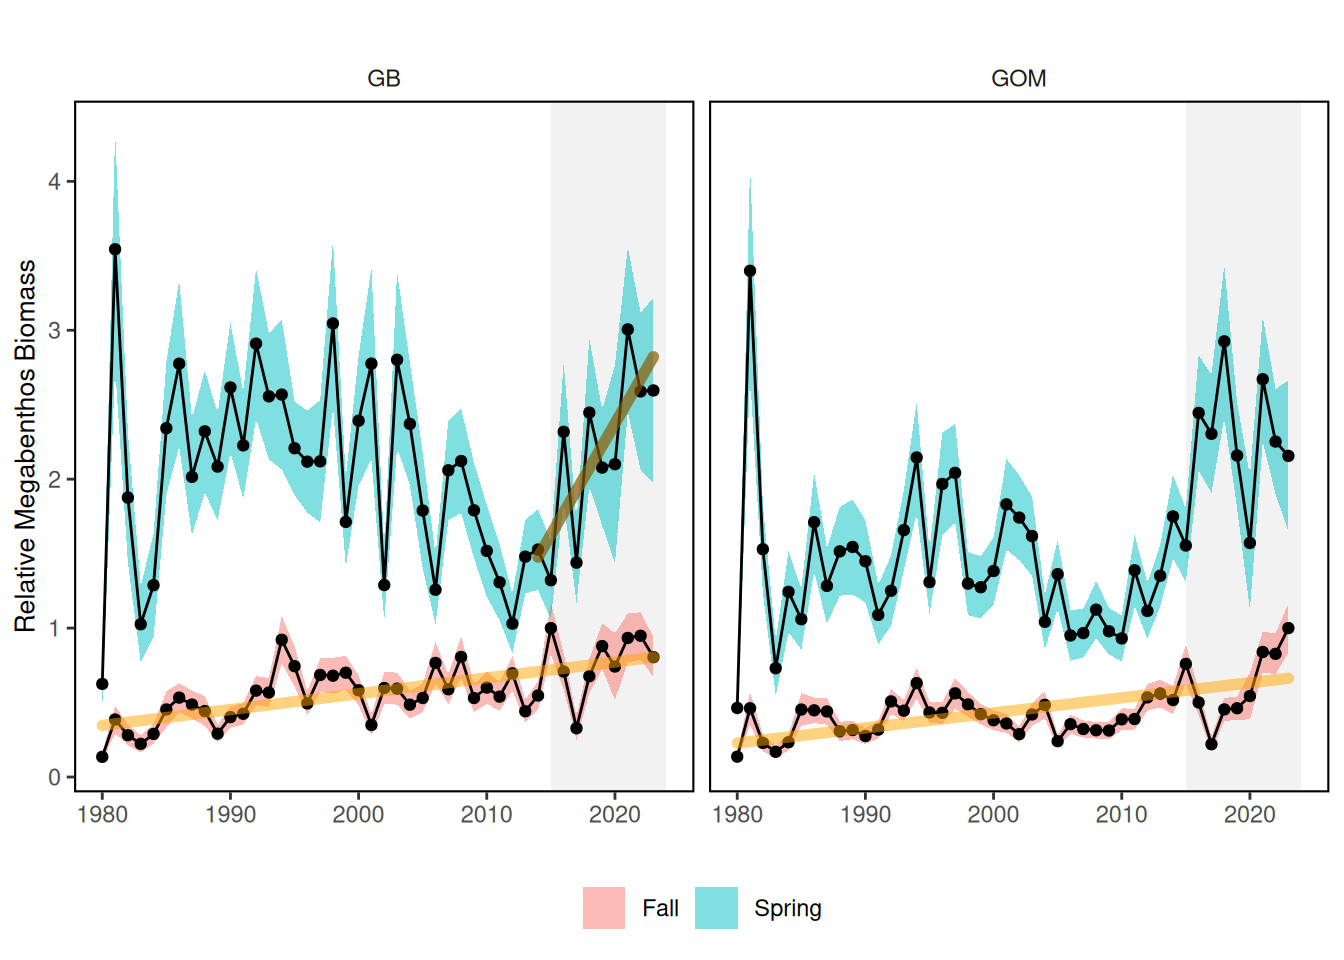
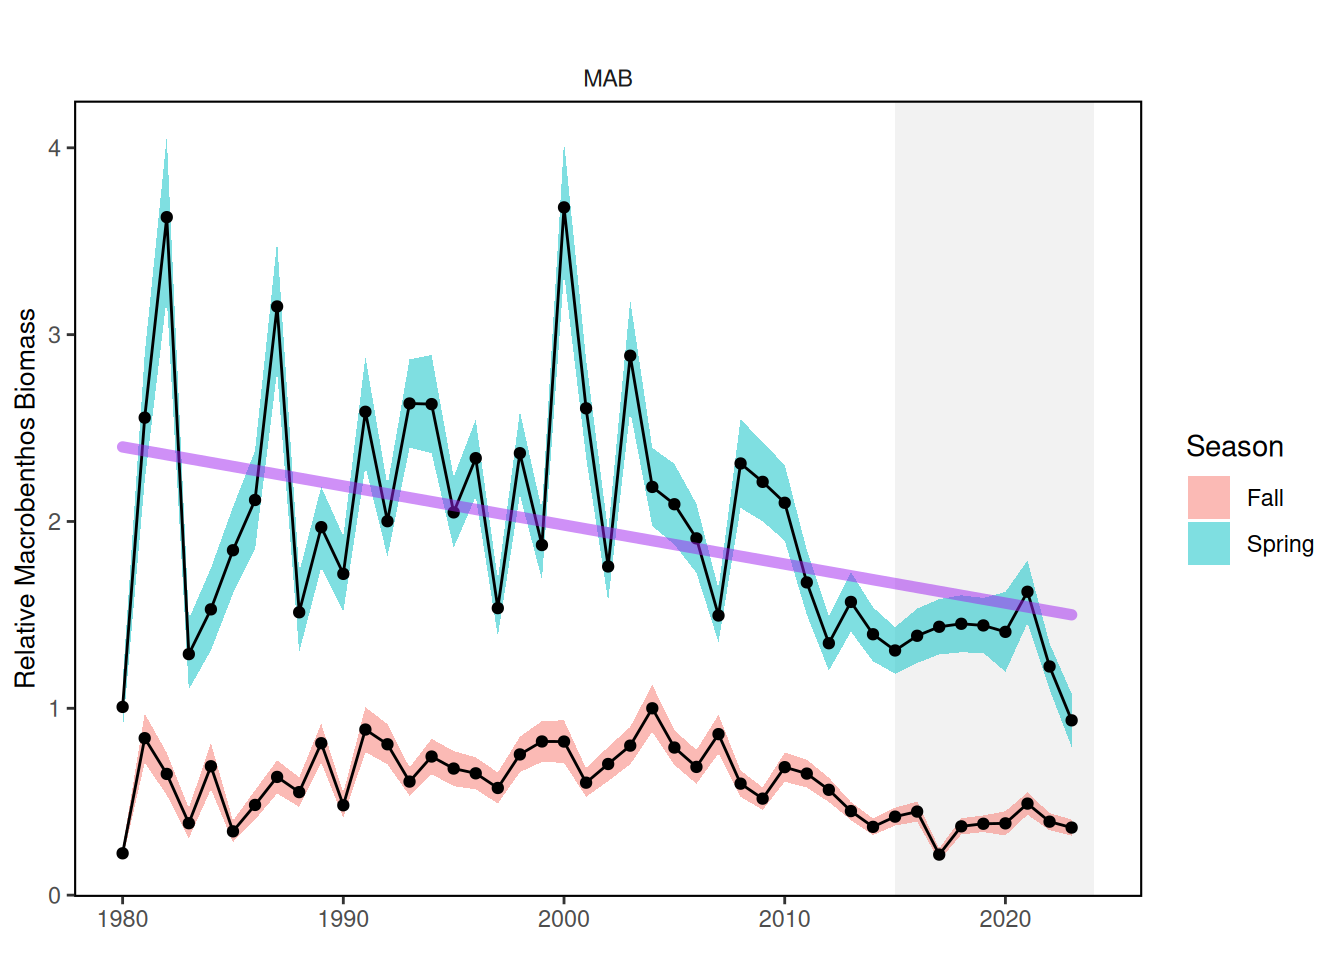
Time series extend from 1980-2024. Macrobenthos and Megabenthos are included on separate plots for each EPU.
Variables plotted are seasonal (Fall or Spring) Macrobenthos or Megabenthos Biomass Estimates with standard error bands.
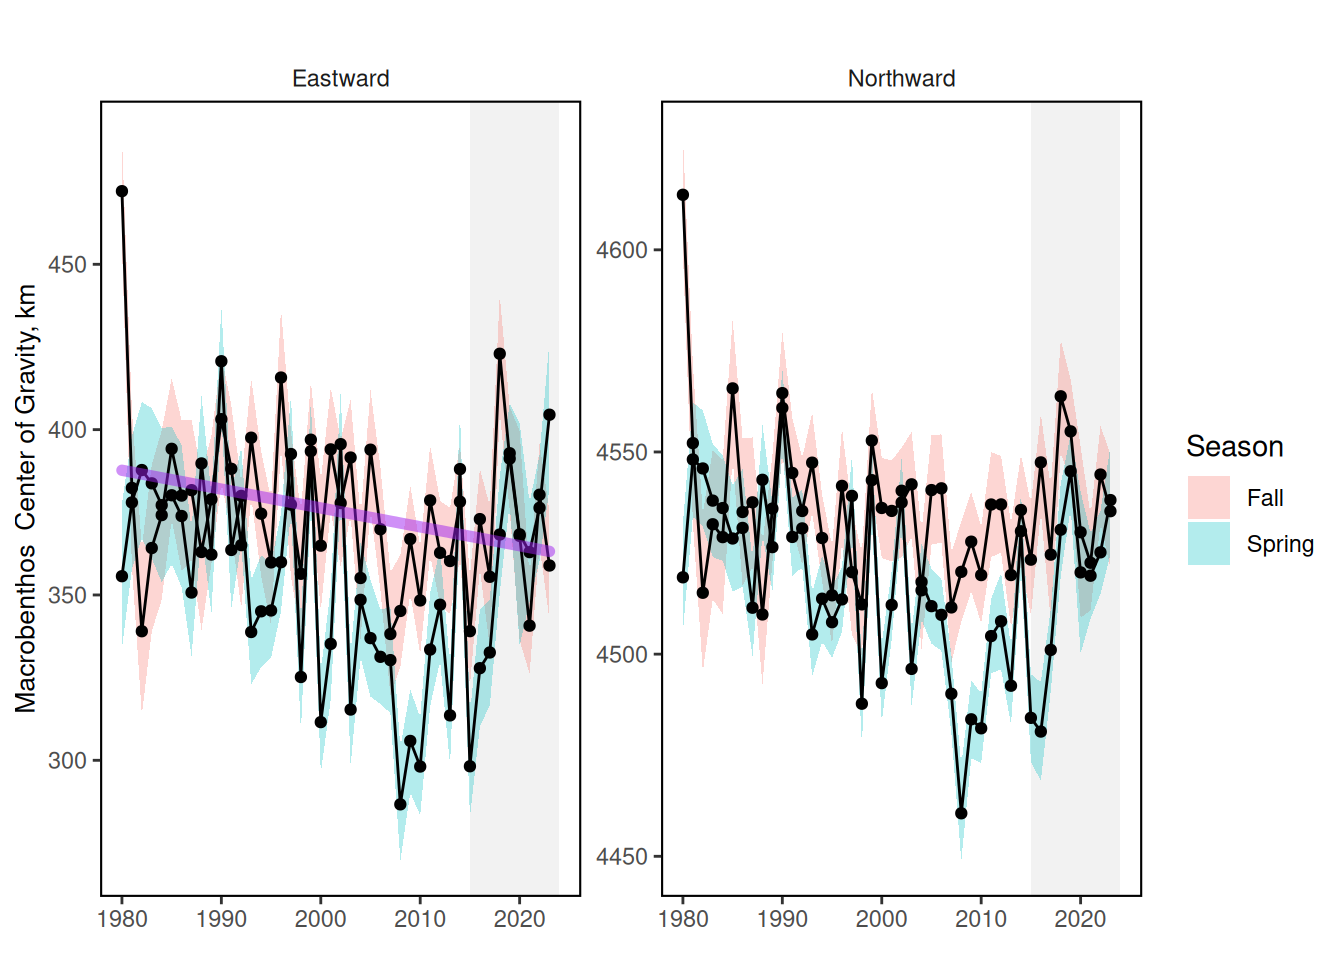
Eastward and Northward components of the Center of Gravity, along with the Center of Gravity SE, are plotted for Fall and Spring Macrobenthos or Megabenthos Biomass.
Mid-Atlantic, Megabenthos, index
New England, Megabenthos, index
Mid-Atlantic, Macrobenthos, index
New England, Macrobenthos, index
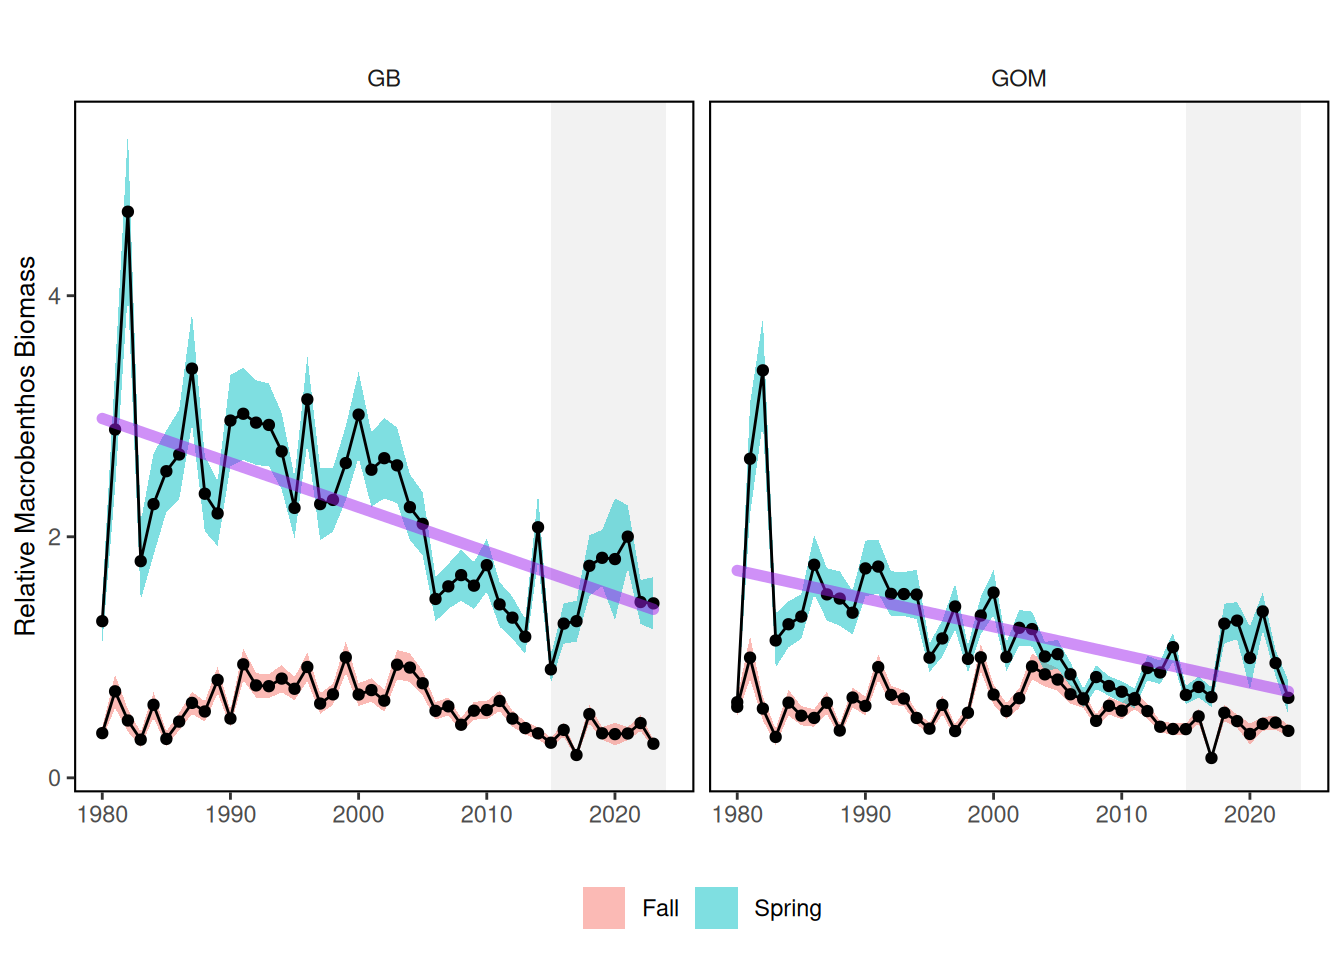
Mid-Atlantic, Megabenthos, cog
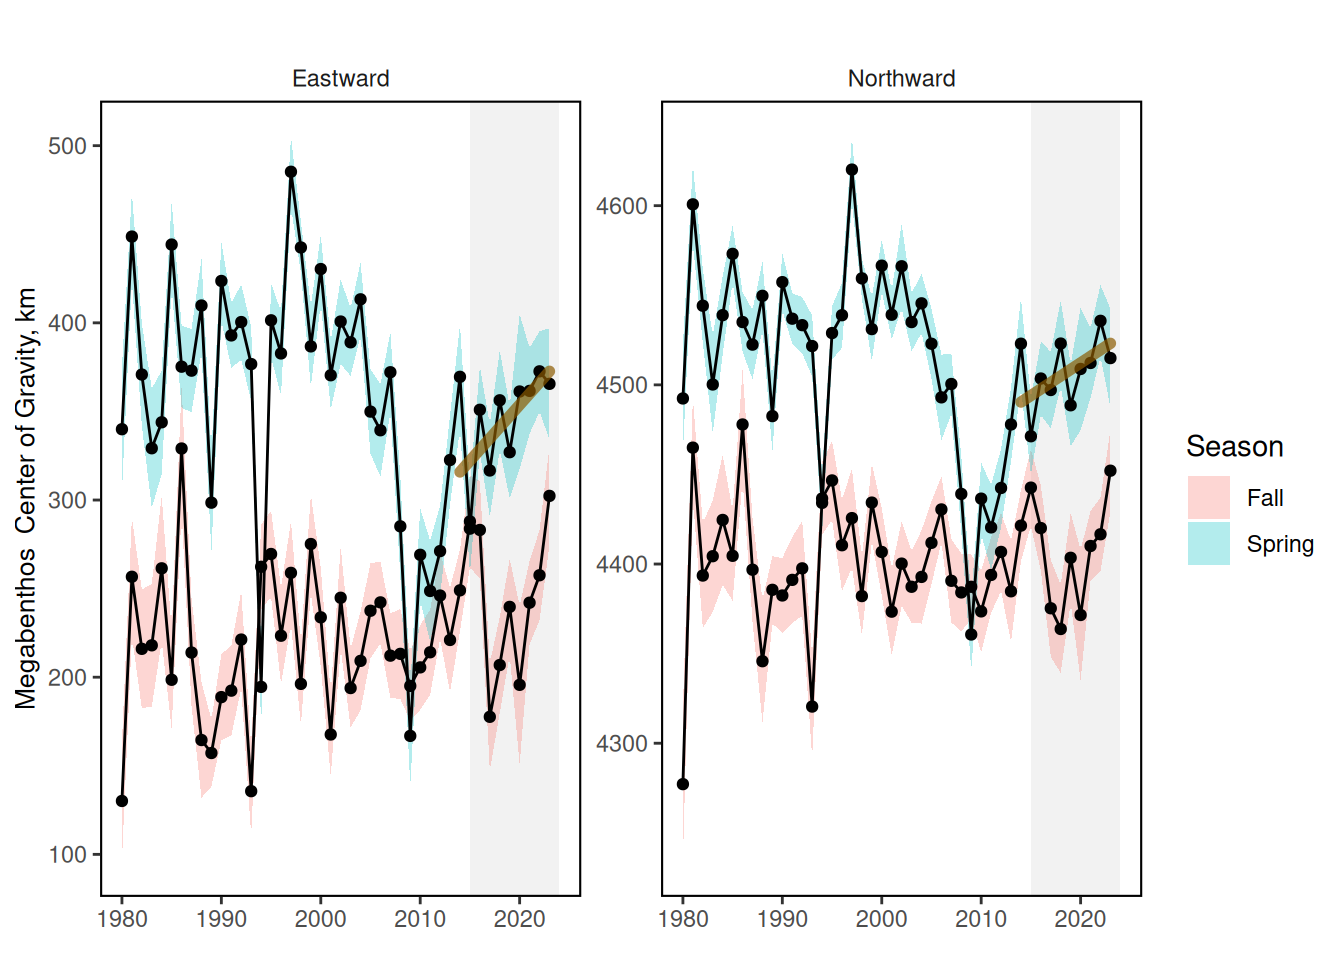
New England, Megabenthos, cog
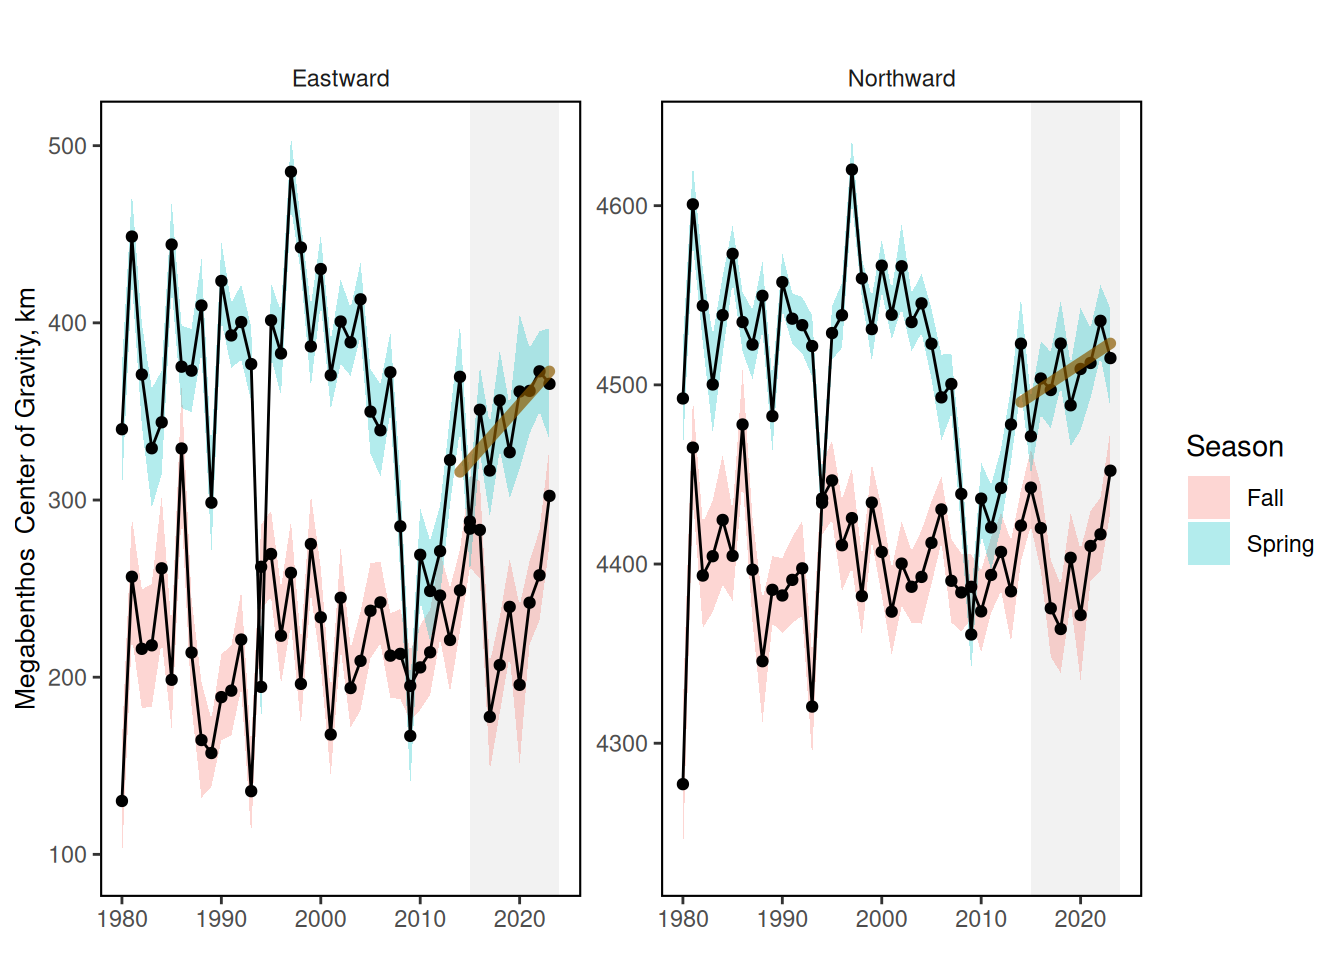
Mid-Atlantic, Macrobenthos, cog
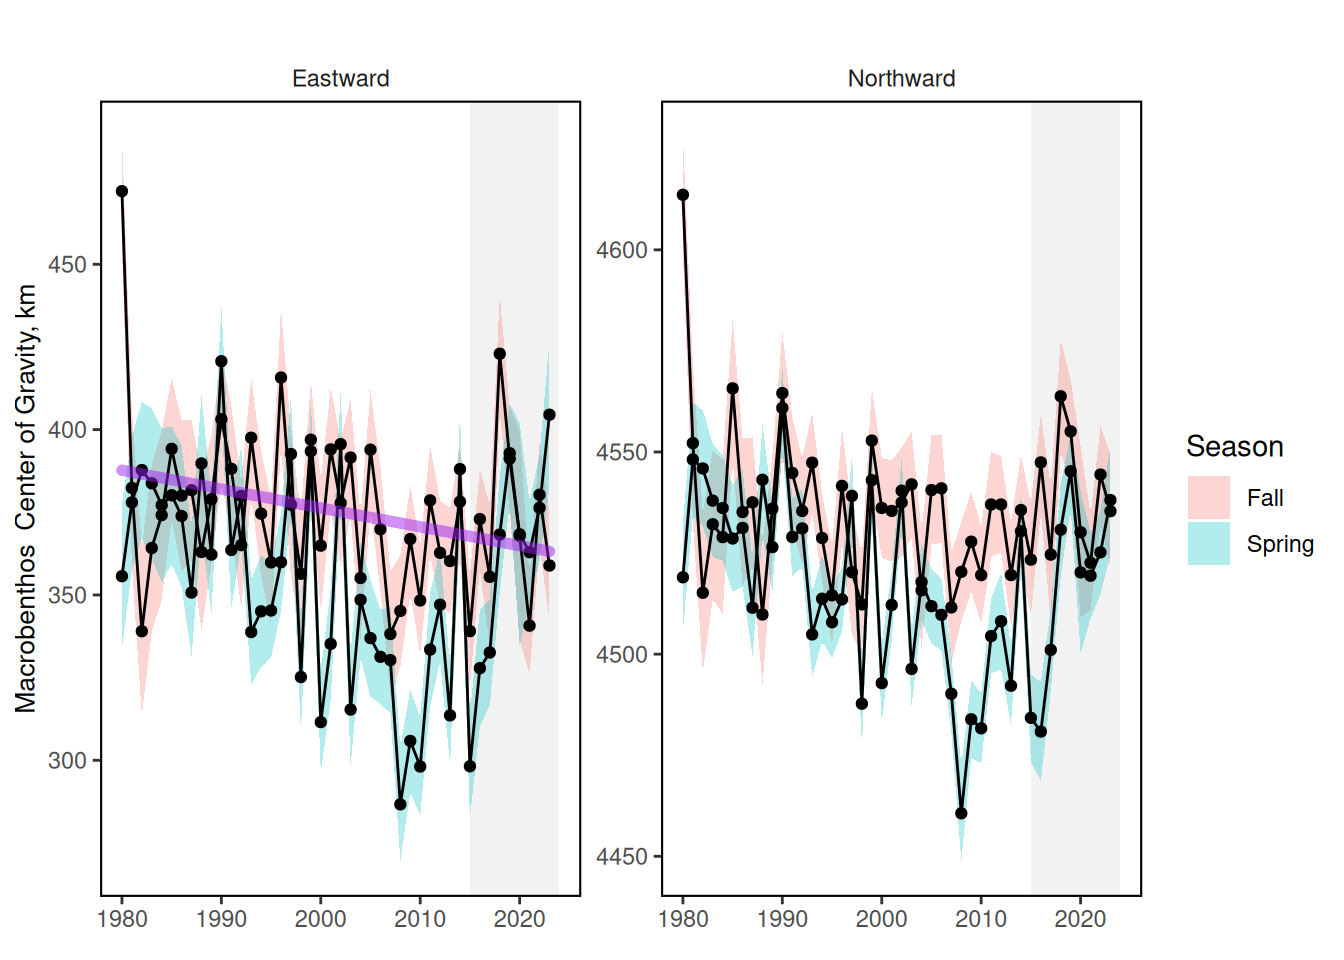
New England, Macrobenthos, cog
26.3 Implications
Macrobenthos indices show long term declines in spring in all EPUs. In contrast, Megabenthos indices show long term increases in fall in all EPUs. Megabenthos indices also show a recent trend in spring in GB.
Center of gravity indicators show recent trends towards the east in spring for Megabenthos in all EPUs. Macrobenthos center of gravity shows a significant long term trend towards the west and south in spring over time. This is the opposite direction observed for aggregate forage fish and surveyed fish species in aggregate.
26.4 Indicator statistics
Spatial scale: by EPU and full shelf
Temporal scale: Spring (January-June), Fall (July-December)
Variable definitions
26.5 Get the data
Point of contact: Maxwell Grezlik (maxwell.grezlik@noaa.gov)
ecodata dataset: ecodata::benthos_index
Tech Doc link: https://noaa-edab.github.io/tech-doc/benthos_index.html
26.5.1 Public Availability
Source data are publicly available. Initial model development (used in the SOE published in 2023-2025) is available at: https://github.com/NOAA-EDAB/benthos_index.html Code for data updates (used in the SOE published in 2026-present) is available at: https://github.com/NEFSC/READ-EDAB-VAST_indices/tree/main/benthos