33 Fish Productivity Indicators
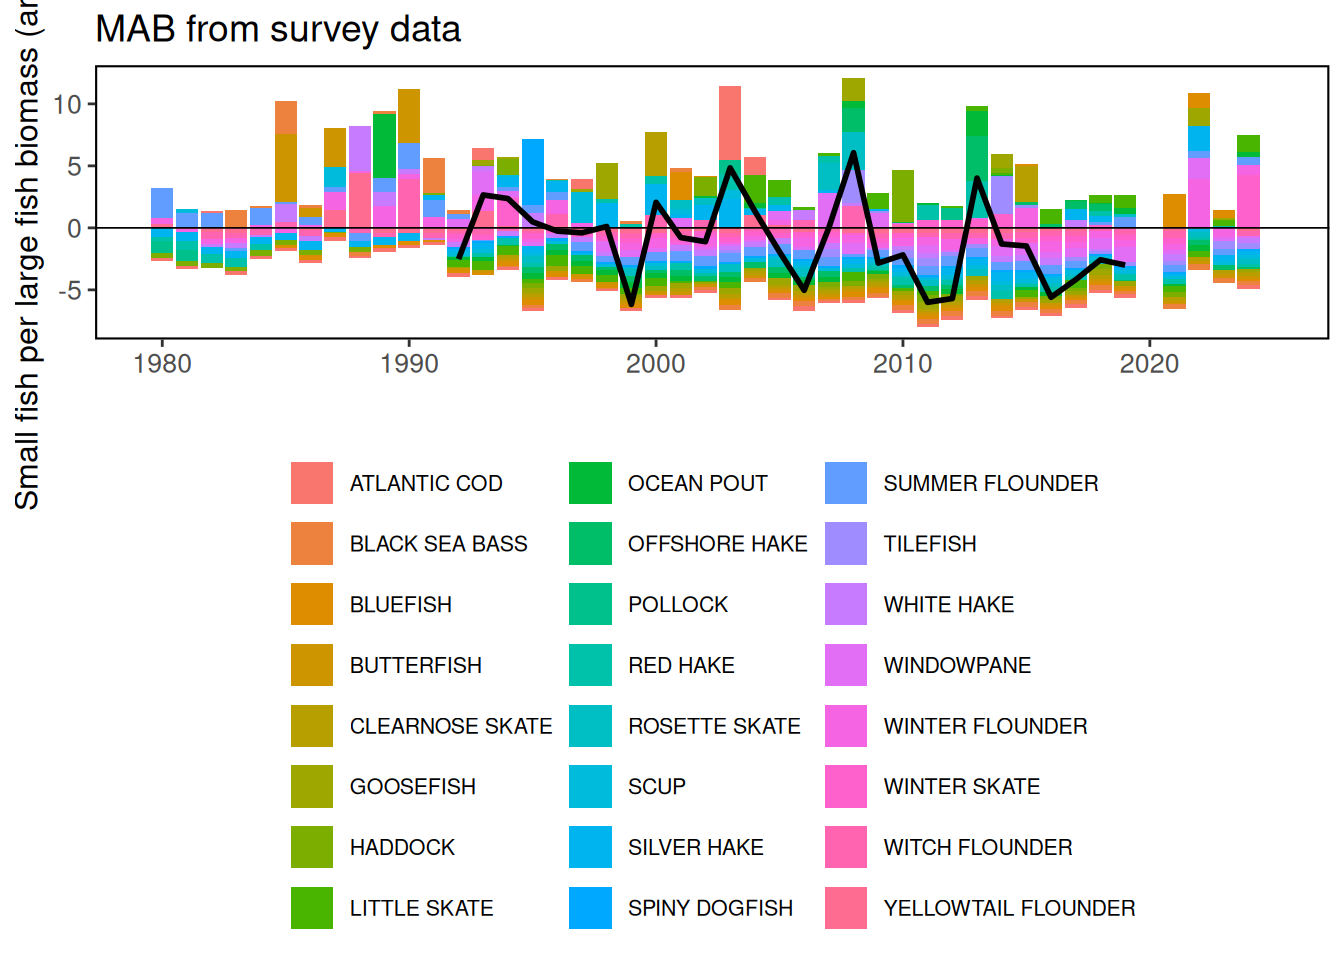
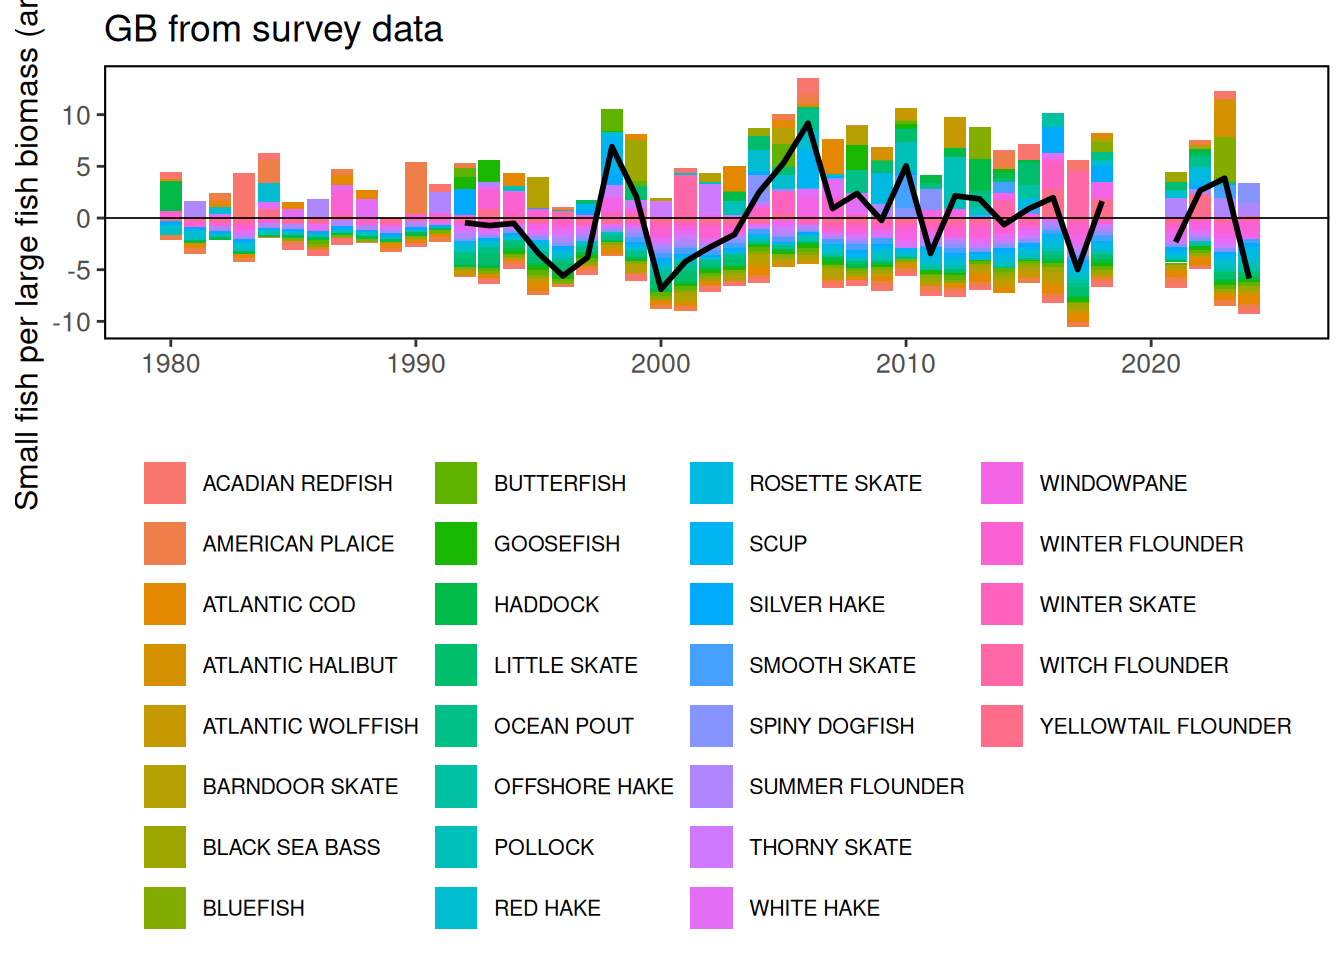
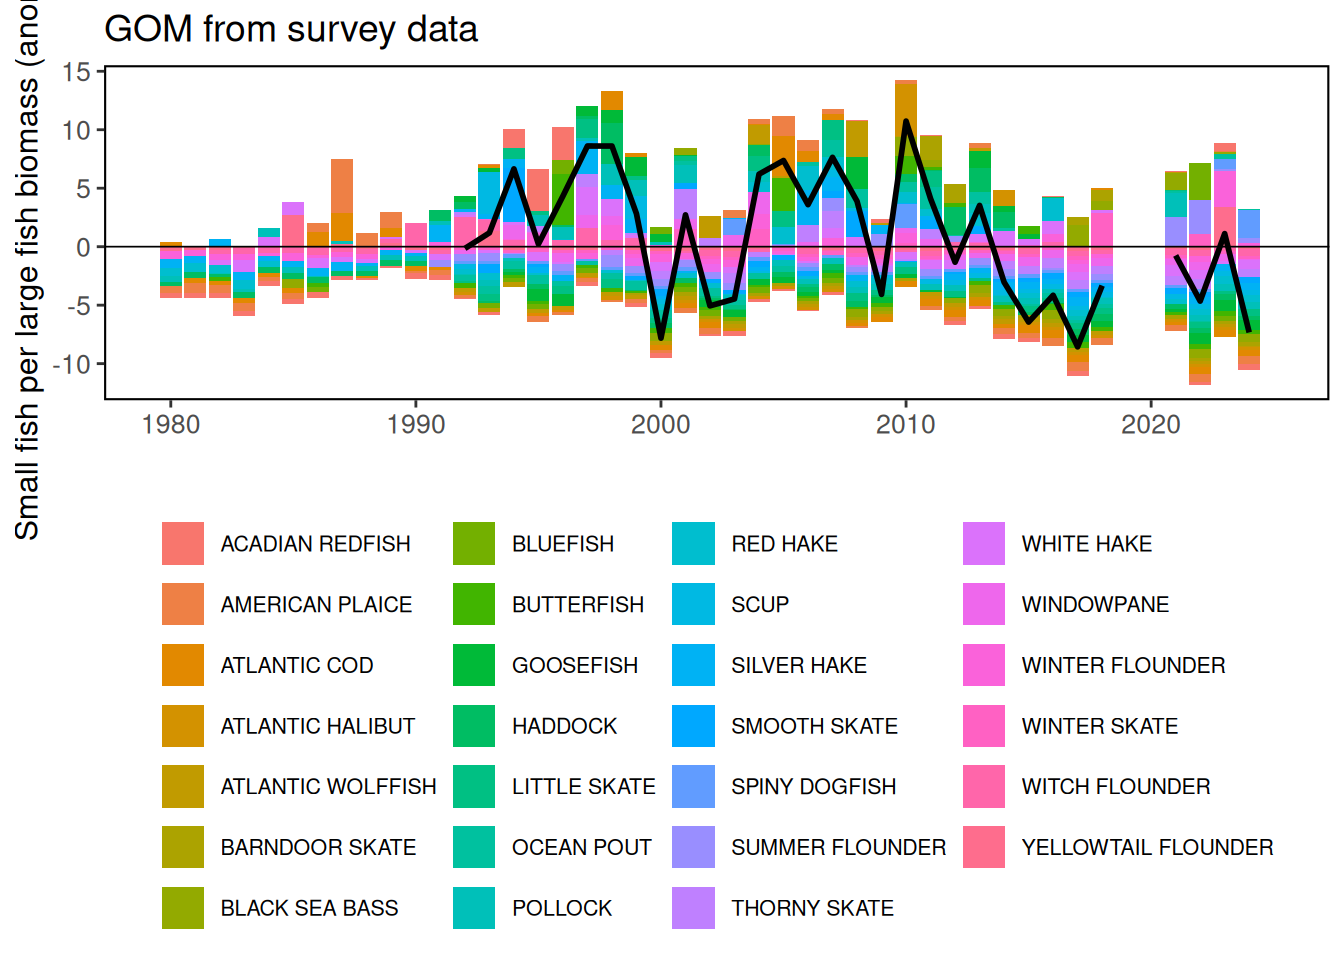
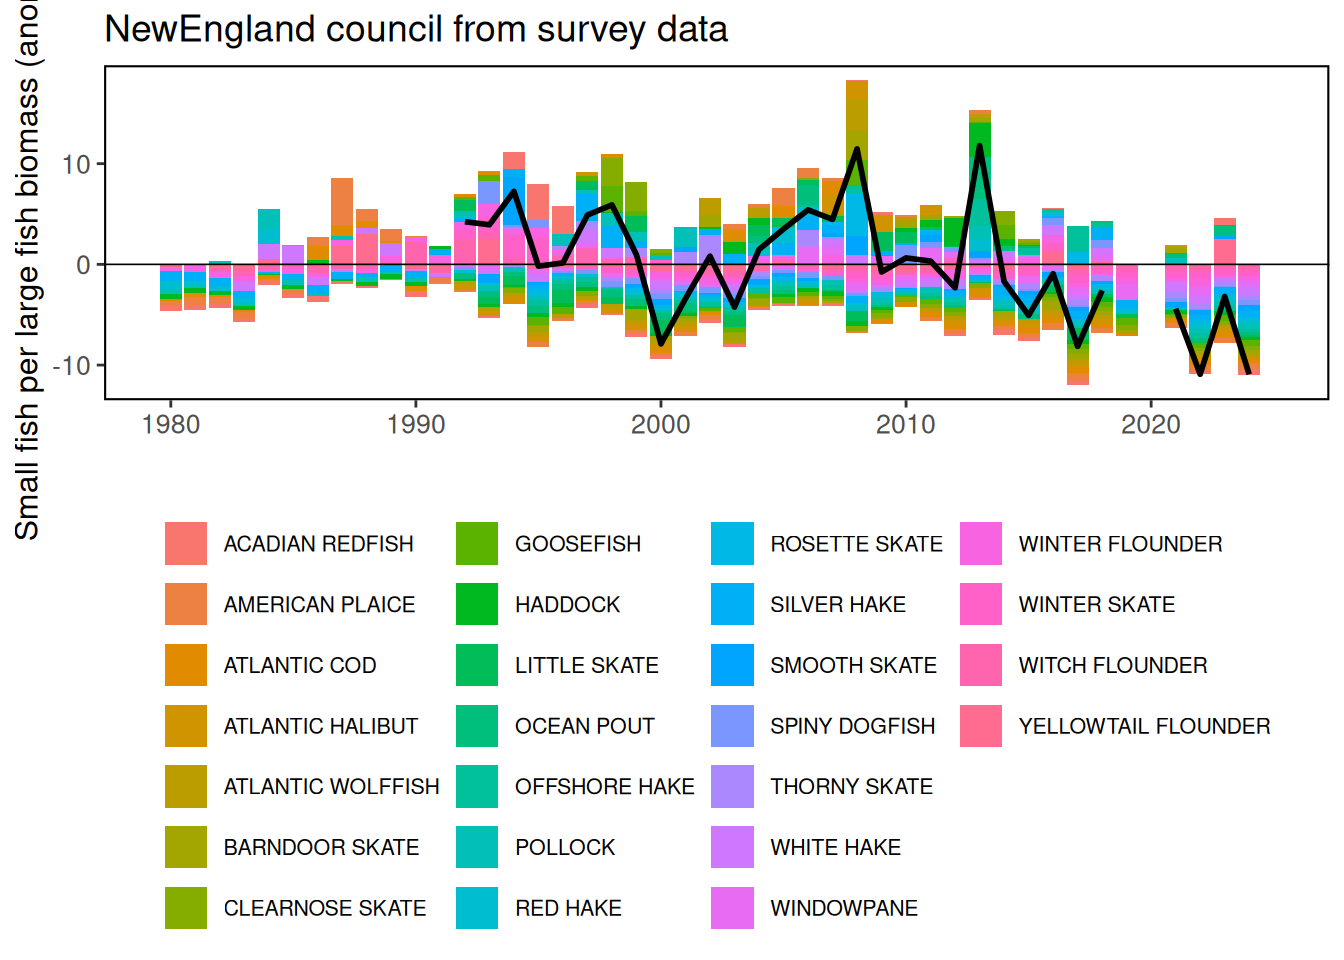
Description: Amount of small fish produced per large fish biomass over time
Indicator family:
Contributor(s): Maxwell Grezlik, Sarah Gaichas, Andy Beet, Kimberly Bastille, Sean Lucey, and Charles Perretti
Affiliations: NEFSC
33.1 Introduction to Indicator
The amount of young fish produced by a population tells us both about the health of individual populations and about the productivity throughout the ecosystem when we look across multiple stocks. This has implications for both managing fisheries (lower productivity often leads to lower harvest) and for other components of the ecosystem.
These indicators are based on the work of Perretti [14]. We updated the data used in that analysis to describe patterns of aggregate fish productivity in the Mid-Atlantic, Georges Bank, and Gulf of Maine by evaluating changes in reproductive output relative to adult population size across multiple stocks. Both survey information and stock assessment information is used in separate indicators.
33.2 Key Results and Visualizations
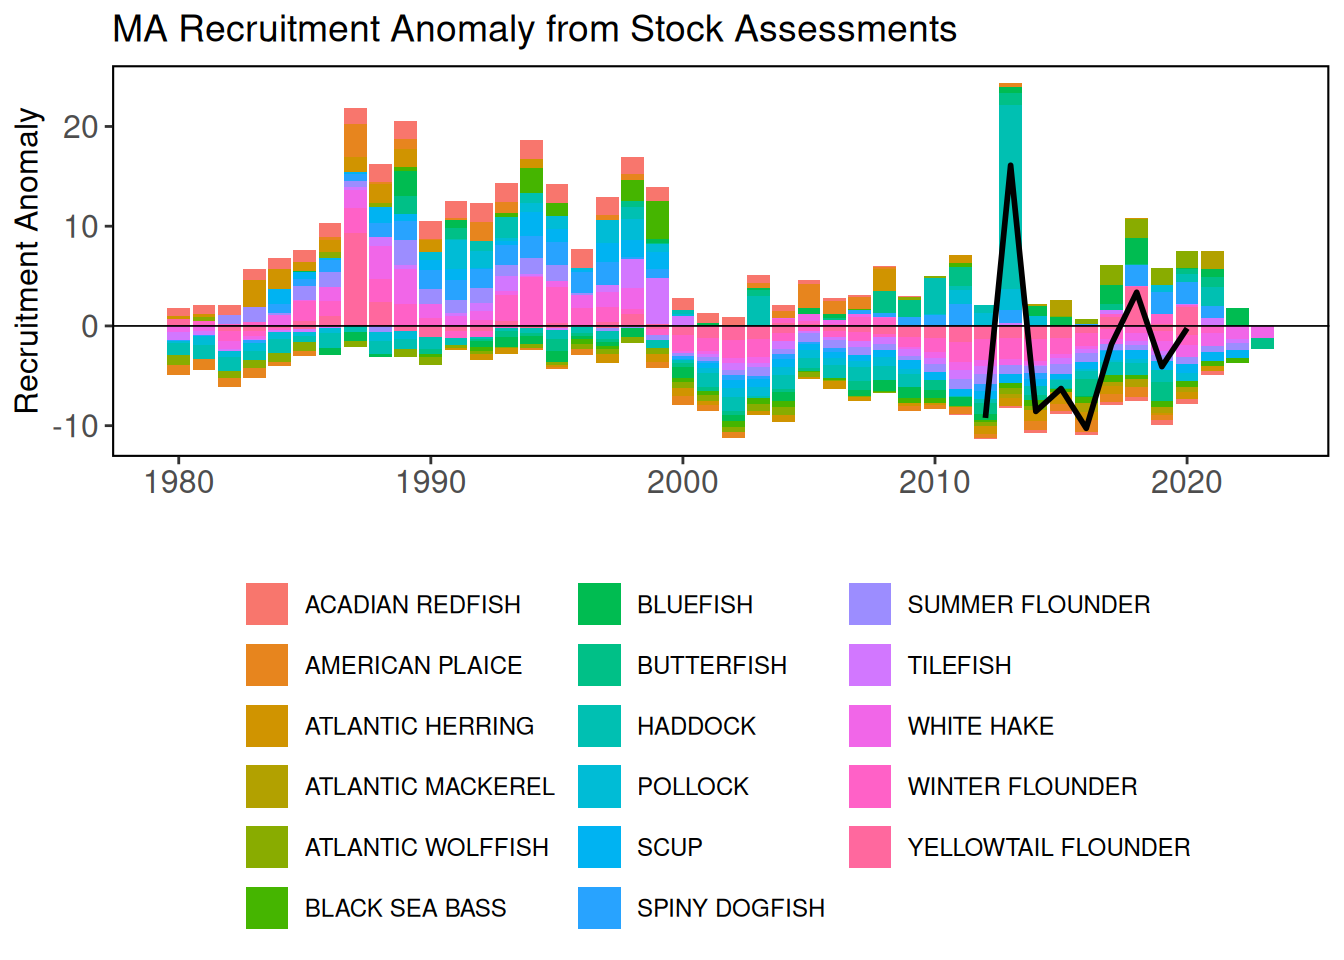
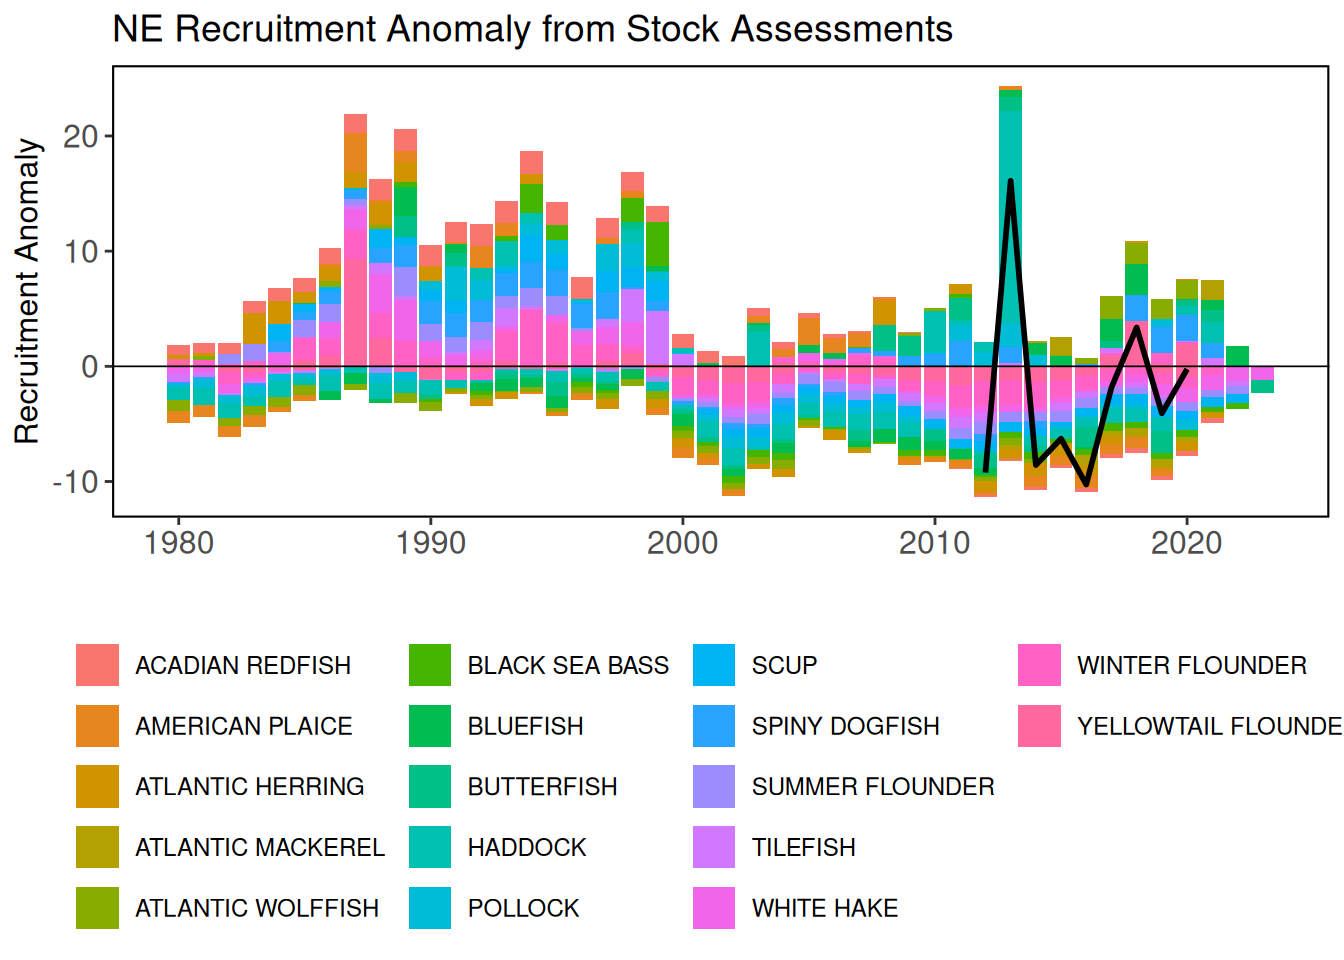
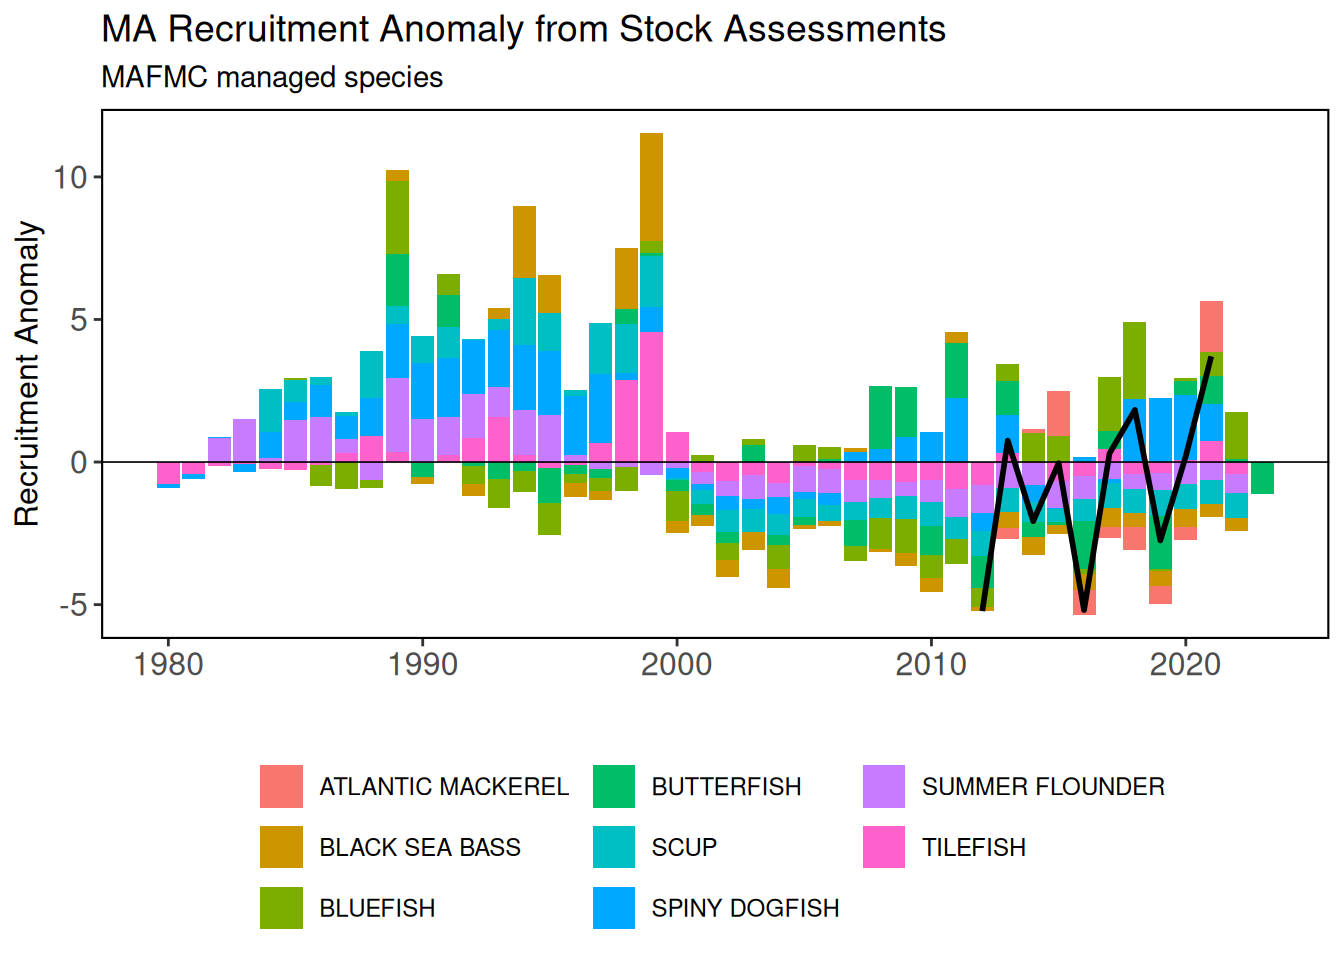
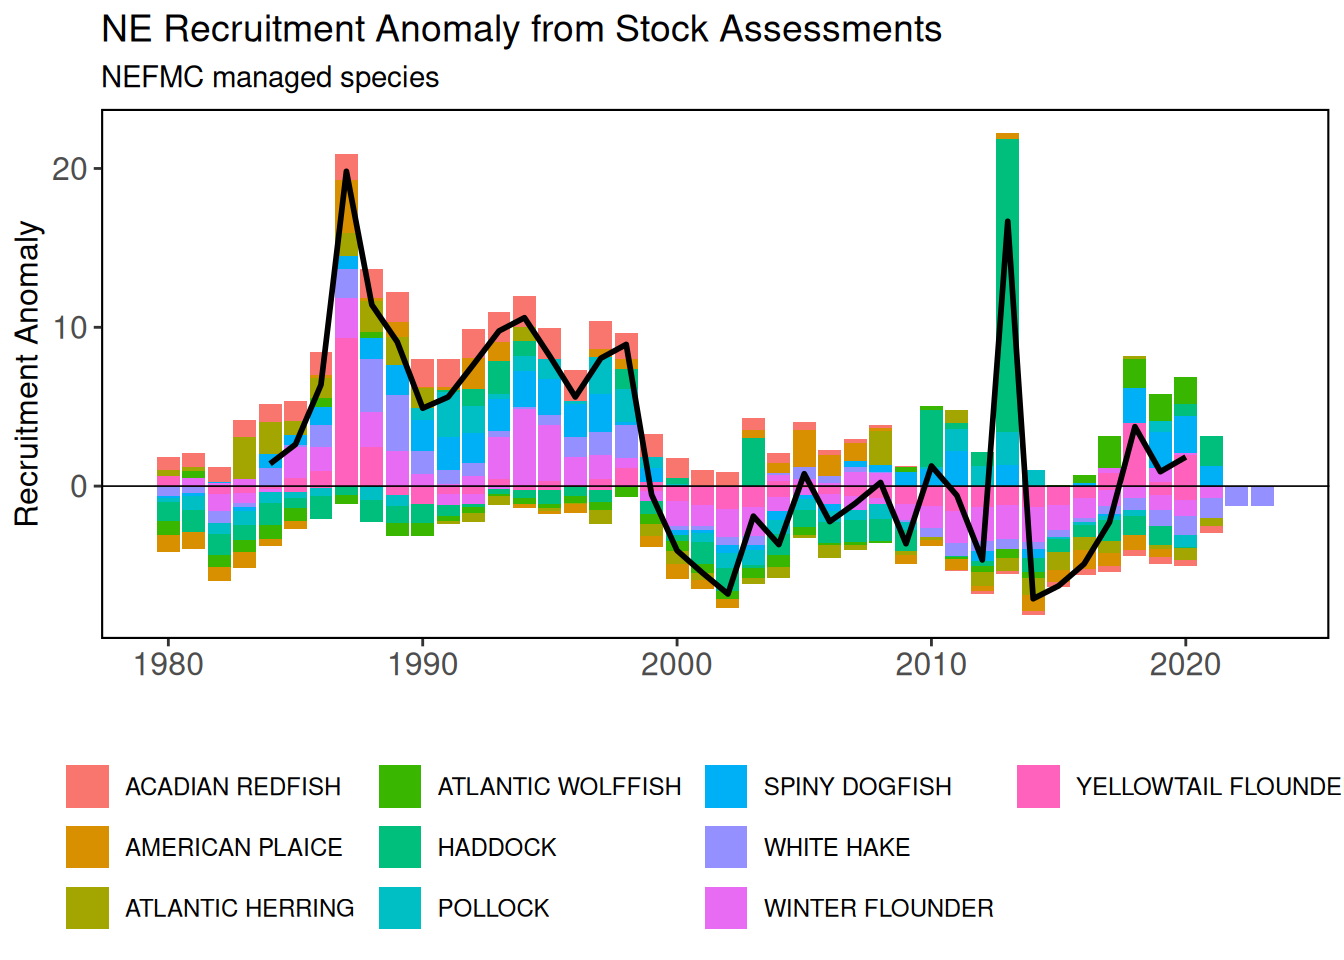
The small fish per large fish anomaly indicator, derived from NEFSC bottom trawl survey data, shows that productivity has been declining in the Mid-Atlantic region since 2003. A similar analysis based on stock assessment model outputs (recruitment per spawning stock biomass anomaly) for stocks primarily inhabiting the Mid-Atlantic region also shows a decline in productivity. The indicators show great variability in the Gulf of Maine and Georges Bank, with both regions being below average for much of the past decade.
#> [1] "Assessment plots combine data across EPUs. See plot for EPU = GB."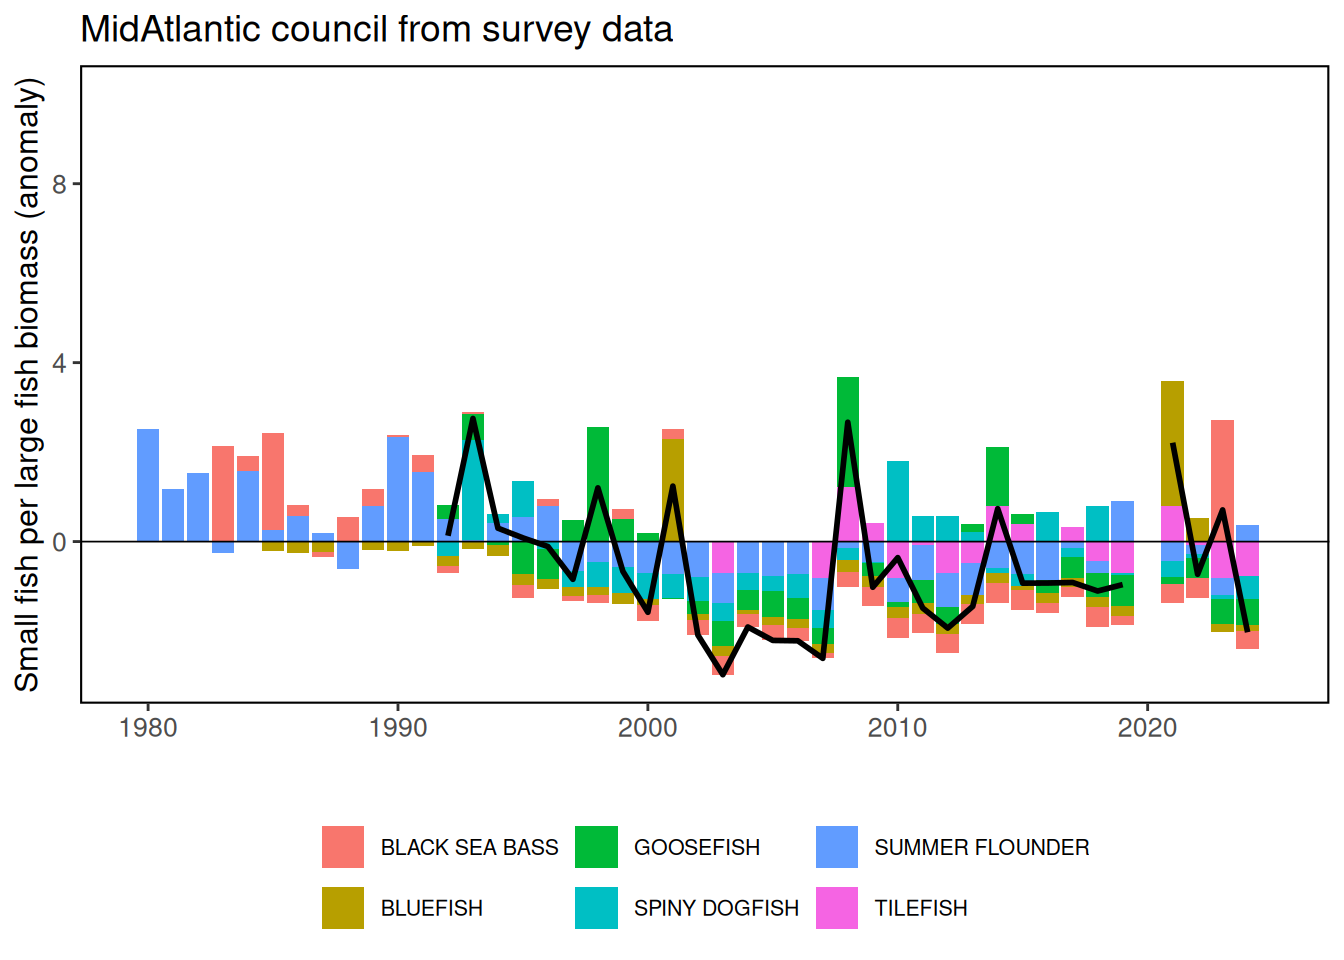

#> [1] "Assessment plots combine data across EPUs. See plot for EPU = GB."33.4 Implications
The apparent decline in productivity across multiple managed species in the MAB, along with generally poor fish conditions in 2024, also suggest changing ecosystem productivity at multiple levels. During the 1990s high relative abundance of smaller bodied copepods and a lower relative abundance of Calanus finmarchicus was associated with regime shifts to higher fish recruitment [14]. The unprecedented climate signals along with the trends toward lower productivity across multiple managed species indicate a need to continually evaluate whether management reference points remain appropriate, and to evaluate if ecosystem regime shifts have occurred or reorganization is in progress.
33.5 Get the data
Point of contact: EDAB, edab.data@noaa.gov
ecodata name: ecodata::productivity_anomaly
Variable definitions
- Variable names are organized using this format: [region] stock name - variable type and source 3. Variables ending with “_Survey” are survey derived recruits/spawner anomalies
- Variables ending with “-Assessment” are assessment derived quantities 5. Survey stock names are in ALL CAPS 6. NE LME prepended to a survey stock name means the anomalies are coastwide
- Assessment stock names are in Sentence case 8. Units for survey variables are the Z score of (number of recruits in year+1/biomass of adults in year)
- Units for plotted assessment variables are the Z score of (numbers of recruits per kg spawning biomass with recruits aligned to spawning biomass year using age at recruitment)
- Other variables are available in the assessment derived dataset but are not plotted. To be added later.
Indicator Category:
33.7 Accessibility and Constraints
No response
tech-doc link https://noaa-edab.github.io/tech-doc/productivity_anomaly.html