14 Inshore Survey (New England)
Description: The data presented here represent the biomass time series for aggregate species groups from the Maine/New Hampshire inshore bottom trawl surveys conducted in Maine and New Hampshire state waters.
Indicator family:
Contributor(s): Robyn Linner
Affiliations: Maine
14.1 Introduction to Indicator
Each species caught on the survey are organized into trophic groups including, “piscivore”, “benthivore”, “planktivore” and “benthos” for each spring and fall survey. The aggregate weight of each trophic group is calculated for each tow, and then stratified mean biomass (kg/tow) is calculated. The survey is stratified by both region and depth, and the stratified mean is weighted based on the size (area in km^2) of each region-depth strata to ensure representative averages. More information on survey strata can be found here.
14.2 Key Results and Visualizations
The average biomass of piscivores appears to be changing more drastically than those of the other trophic groups. There was a general increasing trend in both spring and fall from 2015-2024, but indices dropped considerably in 2025. General trends for planktivores have been similar for spring and fall surveys in the past, with indices showing an increase until 2010, followed by values lower than the time series mean in recent years. In 2025, both seasons showed increases in the biomass index, although the fall index rose only slightly while the spring index almost doubled. Trends for benthivores have also been similar between seasons, rising into the mid 2010s before declining slightly. Indices have been relatively stable since 2020. Bethos species are the least common tropic group caught on the survey, with indices less than 4 kg/tow for the majority of the timeseries except for two years in the spring when benthos species were prominent in catch.
#> [1] "Indicator for 'NewEngland' report only"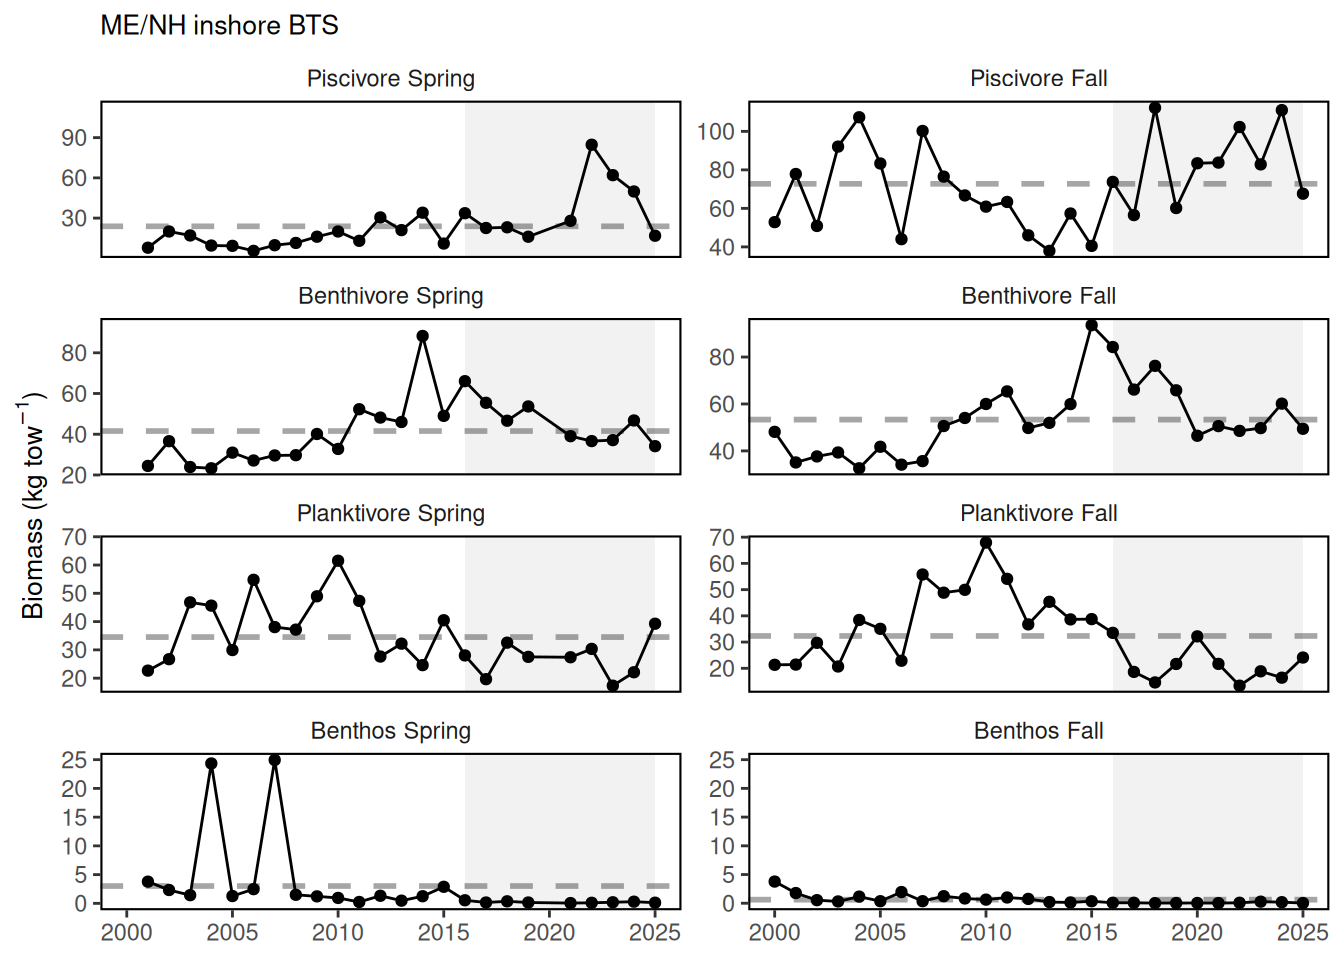
14.3 Indicator statistics
Spatial scale: Waters off of Maine and New Hampshire out to the 12-mile line
Temporal scale: Biannual survey in spring (late April-May), and fall (late September-October)
Synthesis Theme:
14.4 Implications
Indices for each trophic group have varied over time but have, for the most part, shown similar trends between seasons. This may suggest that although species composition varies from spring to fall, the relative biomass of each trophic group available to the survey remains fairly consistent throughout a given year, changing together from year to year. In the last decade, the general rise in piscivores and declines in several of the other categories may suggest an ecosystem change. With time, decreased biomass in the lower trophic levels could fail to support piscivores, leading to declines in their biomass as well. 2025 showed very different trends, with a sharp decrease in piscivores in both seasons and an increase in planktivores, particularly in the spring. This change may suggest that trophic levels are rebalancing but may also be reflective of the fact that ocean temperatures in the spring were the coldest they had been since 2019. These colder waters appear to have caused silver and red hake (two of our most dominant species in recent years) to delay entering our survey area, which likely contributed to the sharp decline in piscivores observed in 2025.
14.5 Get the data
Point of contact: Robyn Linner (robyn.linner@maine.gov)
ecodata name: ecodata::ne_inshore_survey
Variable definitions
- Name: Apex Predator; Definition: Stratified mean biomass of apex predators; Units: kg tow^-1 2) Name: Benthivore; Definition: Stratified mean biomass of benthivores; Units: kg tow^-1
- Name: Benthos; Definition: Stratified mean biomass of benthos species; Units: kg tow^-1 4) Name: Piscivore; Definition: Stratified mean biomass of piscivores; Units: kg tow^-1
- Name: Planktivore; Definition: Stratified mean biomass of planktivores; Units: kg tow^-1
- Name: Other; Definition: Stratified mean biomass of species that did not fit into the other five categories; Units: kg tow^-1
Indicator Category:
14.7 Accessibility and Constraints
No response
tech-doc link https://noaa-edab.github.io/tech-doc/ne_inshore_survey.html