1 Chesapeake Bay Water Quality Standards Attainment
Description: Chesapeake Bay Water Quality Attainment Indicator
Indicator family:
Contributor(s): Qian Zhang, Richard Tian, and Peter Tango
Affiliations: University of Maryland
1.1 Introduction to Indicator
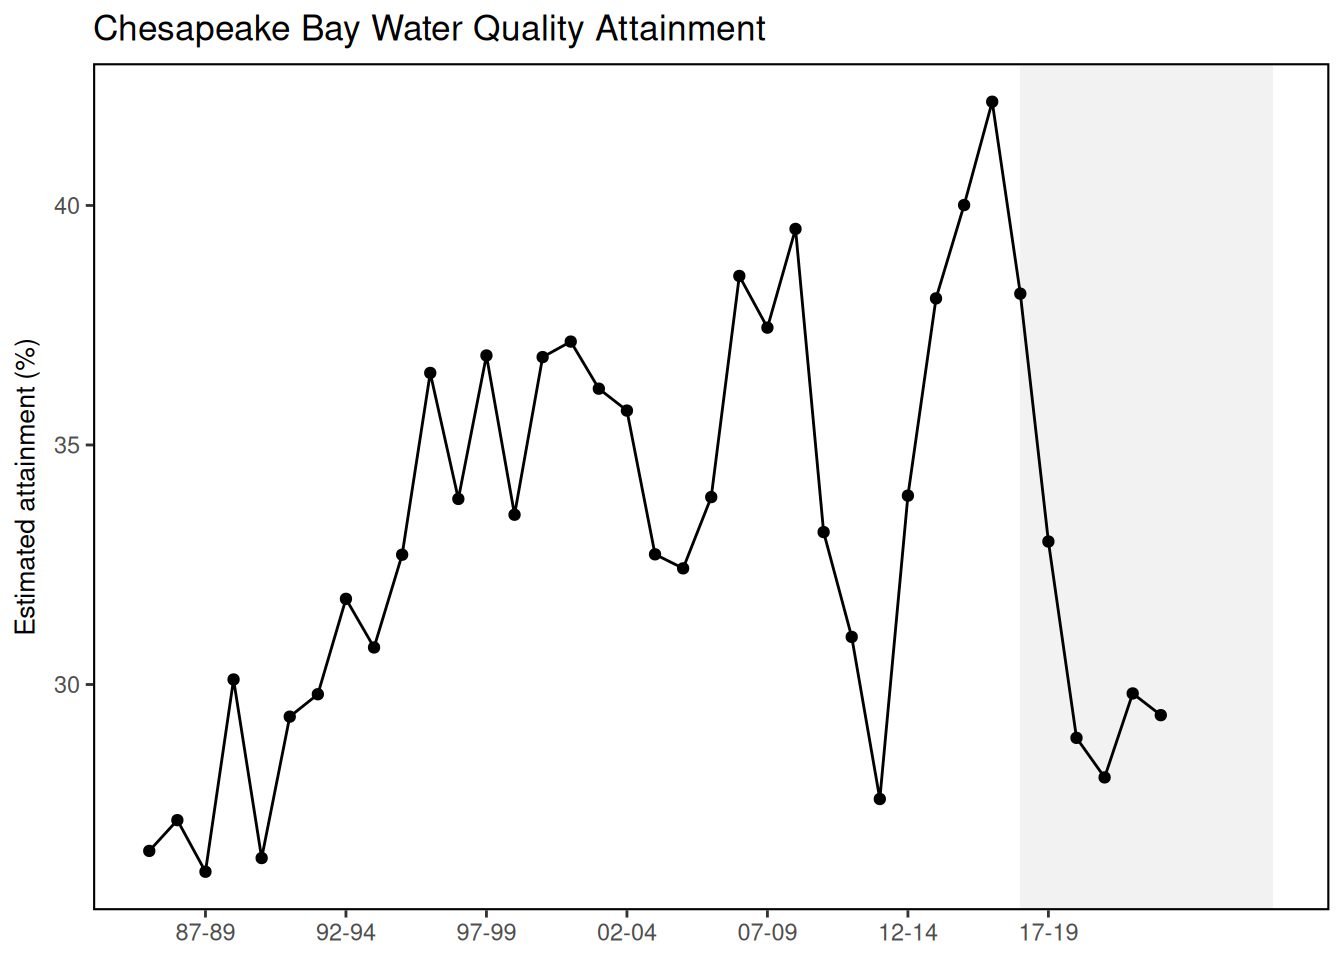
To protect the aquatic living resources of Chesapeake Bay, the Chesapeake Bay Program (CBP) partnership has developed a guidance framework of ambient water quality criteria with designated uses and assessment procedures for dissolved oxygen, chlorophyll-a, and water clarity/submerged aquatic vegetation (SAV) [2]. To achieve consistent assessment over time and between jurisdictions, a multimetric indicator was proposed by the CBP partnership to provide a means for tracking the progress in all 92 management segments of Chesapeake Bay [3,4]. This indicator has been computed for each three-year assessment period since 1985-1987, providing an integrated measure of Chesapeake Bay’s water quality condition over the last three decades.
1.1.0.1 Data sources
The multimetric indicator required monitoring data on dissolved oxygen (DO) concentrations, chlorophyll-a concentrations, water clarity, SAV acreage, water temperature, and salinity. SAV acreage has been measured by the Virginia Institute of Marine Science in collaboration with the CBP, which is available via http://web.vims.edu/bio/sav/StateSegmentAreaTable.htm. Data for all other parameters were obtained from the CBP Water Quality Database. These data have been routinely reported to the CBP by the Maryland Department of Natural Resources, Virginia Department of Environmental Quality, Old Dominion University, Virginia Institute of Marine Science, and citizen/volunteer monitoring initiatives.
1.1.0.2 Criteria attainment assessment
Monitoring data of DO, chlorophyll-a, and water clarity/SAV were processed and compared with water quality criteria thresholds according to different designated uses (DUs). These DUs are migratory spawning and nursery (MSN), open water (OW), deep water (DW), deep channel (DC), and shallow water (SW), which reflect the seasonal nature of water column structure and the life history needs of living resources. Station-level DO and chlorophyll-a data were spatially interpolated in three dimensions. Salinity and water temperature data were used to compute the vertical density structure of the water column, which was translated into layers of different DUs. Criteria attainment was determined by comparing violation rates over a 3-year period to a reference cumulative frequency distribution that represents the extent of allowable violation. This approach was implemented using FORTRAN codes, which are provided as a zipped folder. For water clarity/SAV, the single best year in the 3-year assessment period was compared with the segment-specific acreage goal, the water clarity goal, or a combination of both. For more details, refer to the Methods section of Zhang et al. [5].
1.2 Key Results and Visualizations
1.2.0.1 Indicator calculation
The multimetric indicator quantifies the fraction of segment-DU-criterion combinations that meet all applicable season-specific thresholds for each 3-year assessment period from 1985-1987 to 2021-2023. For each 3-year assessment period, all applicable segment-DU-criterion combinations were evaluated in a binomial fashion and scored 1 for “in attainment” and 0 for “nonattainment”. The classified status of each segment-DU-criterion combination was weighted via segments’ surface area and summed to obtain the multimetric index score. This weighting scheme was adopted for two reasons: (1) segments vary in size over four orders of magnitude, and (2) surface area of each segment does not change with time or DUs, unlike seasonally variable habitat volume or bottom water area [4]. For more details, refer to the Methods section of Zhang et al. [5].
The indicator provides an integrated measure of Chesapeake Bay’s water quality condition (Figure 1). In 2021-2023, 29.4% of all tidal water segment-DU-criterion combinations are estimated to have met or exceeded applicable water quality criteria thresholds.
1.3 Indicator statistics
Spatial scale: Chesapeake Bay
Temporal scale: 3-year assessment periods between 1985-1987 and 2021-2023.
Synthesis Theme:
1.4 Implications
Overall, the indicator has a positive trend of 0.19% per year between 1985-1987 and 2021-2023, suggesting that Chesapeake Bay is on a recovery trajectory. Although the p-value (0.16) does not meet the 0.1 threshold for statistical significance, it may indicate a weak trend that is largely impacted by the interannual variability in streamflow.
Patterns of attainment are variable among designated uses. A Mann-Kendall trend analysis for 1985–2023 (see Zhang et al. [5] for methodology) revealed statistically significant long-term improvements in deep water dissolved oxygen criterion attainment and shallow water bay grasses/water clarity criterion attainment. These improvements may indicate increasing resilience in the Bay ecosystem since restoration efforts began. Additional analyses were conducted using the non-binary metric of attainment deficit. The results revealed widespread long-term improvements in dissolved oxygen attainment across the Bay’s tidal waters, including statistically significant trends observed in open water, deep water, and all four salinity zones (i.e., tidal fresh, oligohaline, mesohaline, and polyhaline). These findings, consistent with recent interpretations [6,7], provide further evidence of the Bay’s increasing resilience following long-term nutrient management efforts.
1.5 Get the data
Point of contact: Qian Zhang, qzhang@chesapeakebay.net
ecodata name: ecodata::ches_bay_wq
Variable definitions
- Period: Assessment period 2. Year One: Starting year of the assessment period 3. Year Two: Ending year of the assessment period
- Total: The overall attainment indicator
- MSN-DO: Estimated attainment of the dissolved oxygen criterion for the migratory spawning and nursery designated use
- OW-DO: Estimated attainment of the dissolved oxygen criterion for the open water designated use
- DW-DO: Estimated attainment of the dissolved oxygen criterion for the deep water designated use
- DC-DO: Estimated attainment of the dissolved oxygen criterion for the deep channel designated use
- OW-CHLA: Estimated attainment of the chlorophyll-a criterion
- SW-Clarity/SAV: Estimated attainment of the bay grasses / water clarity criterion for the shallow water designated use
Indicator Category:
1.7 Accessibility and Constraints
No response
tech-doc link https://noaa-edab.github.io/tech-doc/ches_bay_wq.html