11 Aggregate Survey Biomass
Last updated July 23, 2026
Description: Aggregate biomass from Northeast Fisheries Science Center (NEFSC) bottom trawl survey.
Contributor(s): Sean Lucey, Andrew Beet, and Sarah Gaichas.
Affiliations: NEFSC
Indicator Family:
Indicator Category:
Synthesis Theme:
11.1 Introduction to Indicator
The NEFSC has been conducting bi-annual bottom trawl surveys along the Northeast US Continental Shelf for over 60 years. The survey is conducted in the spring and fall of each year. The fall survey began in 1964 and the spring in 1967. The survey is designed as a stratified random survey. We have calculated stratified means with sets of survey strata that closely align with our Ecosystem Production Unit boundaries. Species are aggregated into feeding guilds in order to gauge the relative stability and health of the system.
11.2 Key Results and Visualizations
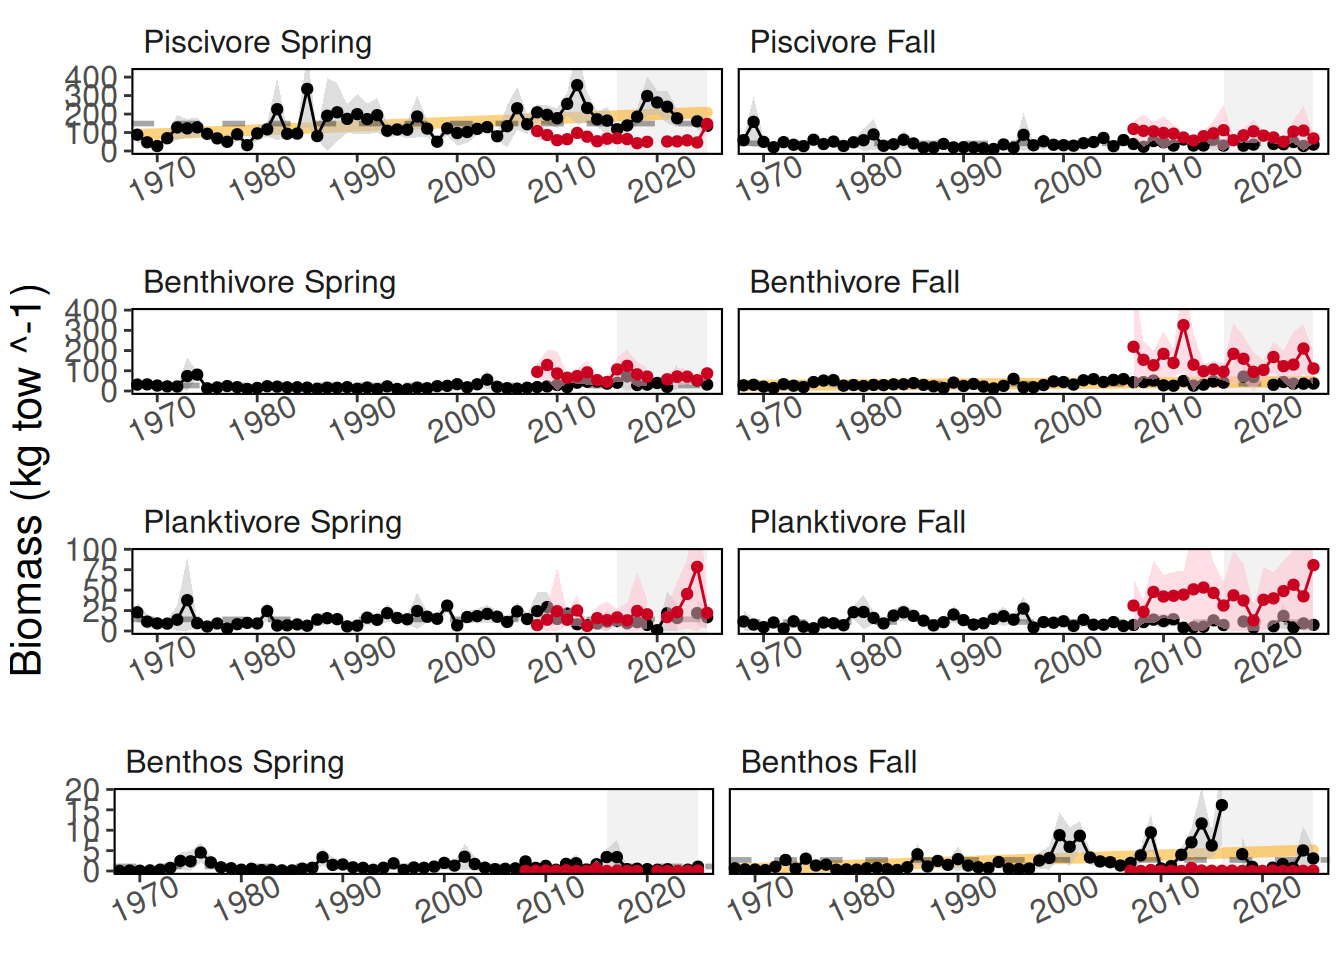
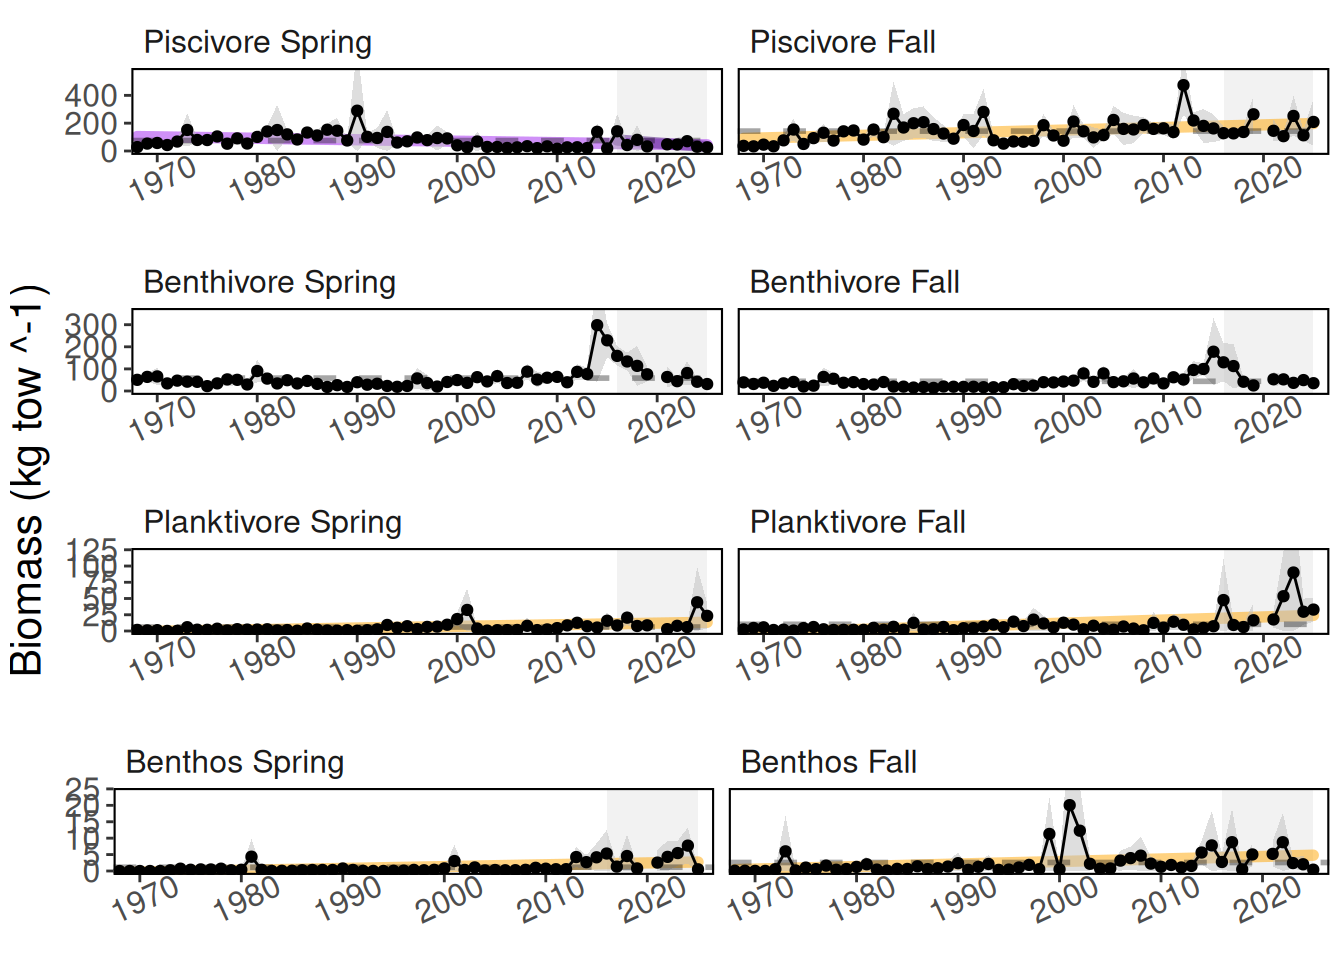
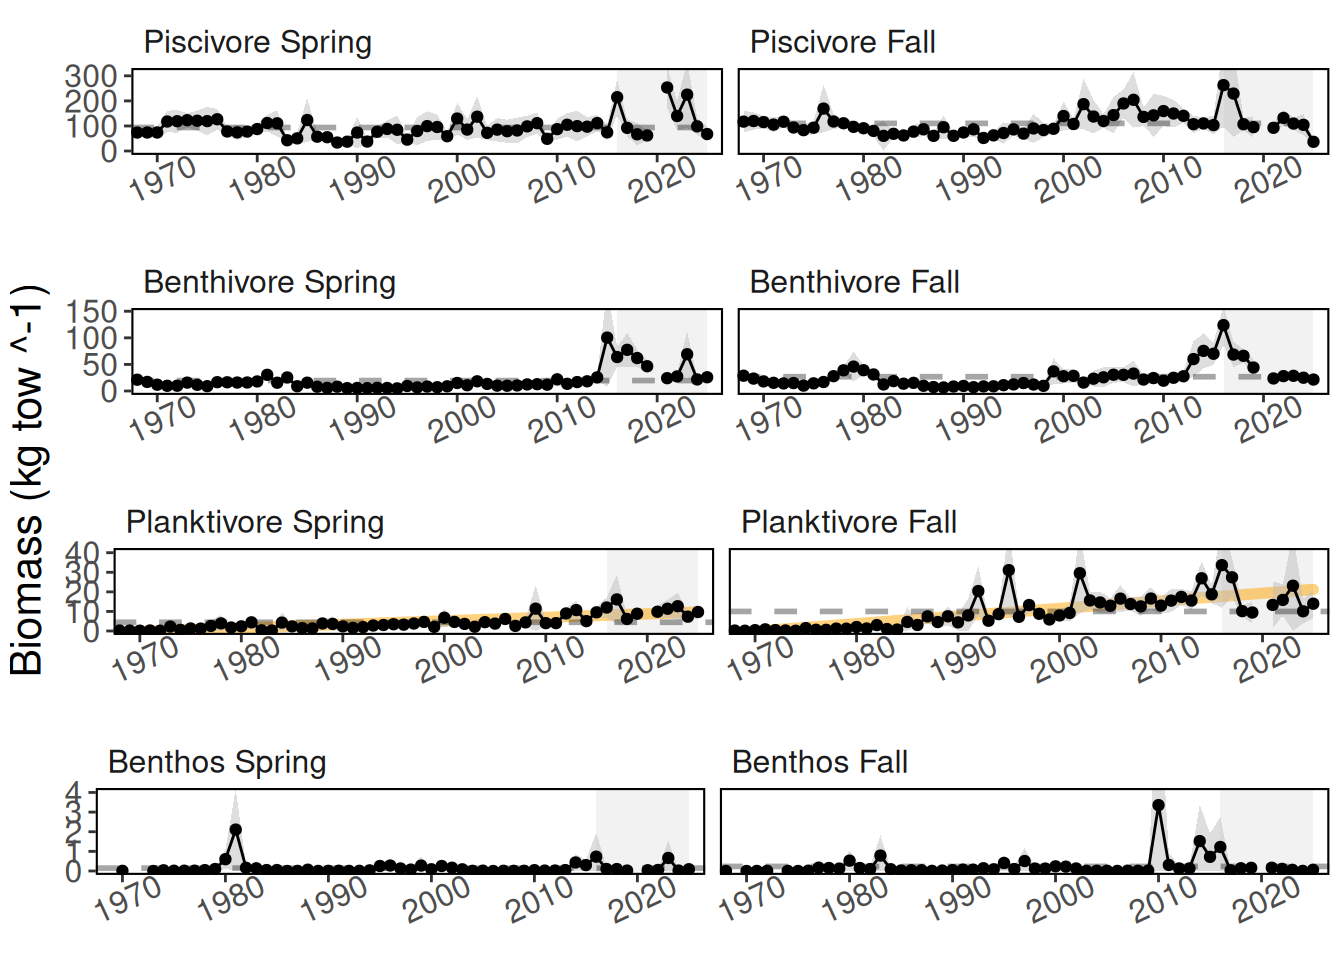
Aggregate biomass levels have been relatively stable over time. Black points represent data from the Northeast Fisheries Science Center (NEFSC) bottom trawl survey. Red points represent data from the NEAMAP inshore survey.
Mid-Atlantic Bight
Georges Bank
Gulf of Maine
11.3 Implications
Aggregate biomass is a holistic indicator that reveals the underlying ecosystem that the fisheries operates within. While there has been evidence of overfishing of key commercial species, the overall ecosystem is relatively stable.
11.4 Indicator statistics
Spatial scale: By EPU
Temporal scale: Spring (March-May) and Fall (September-November)
Variable definitions
11.5 Get the data
Point of contact: Andrew Beet (Andrew.Beet@NOAA.gov)
ecodata dataset: ecodata::aggregate_biomass
Tech Doc link: https://noaa-edab.github.io/tech-doc/aggregate_biomass.html