78 Community Social Vulnerability Indicators (CSVI)
Description: The data here consist of two sources; 1) Port Commercial Fishing Activity Indicator scores which is comprised of commercial fishing landings and permit data from 2007 through 2024 summarized to indicate port-level activity in commercial fishing. 2) Community Social Vulnerability Indicators (CSVI) generated from 2023 American Community Survey 5-yr estimates Dataset in the U.S. Census American Community Survey (ACS) for coastal communities at the Census Designated Place or County Subdivision level.
Note, the Mid-Atlantic analysis for the PCFA Indicator does not include data from North Carolina (NC) given delays in receiving data from the Southeast region. NC ports land a significant portion of fish from Southeast managed species and thus, we elected to not include NC to avoid the risk of underestimation.
Indicator family:
Contributor(s): Robert Murphy, Tanya Noteva, Changhua Weng
Affiliations: NEFSC
78.1 Introduction to Indicator
We report the top ten ports with the highest relative participation in commercial fishing for 2024 and each top port’s history of relative participation (2007-2024). This is a new indicator named the ‘Port Commercial Fishing Activity (PCFA) Indicator’ and is an adaptation of the previous fishing engagement indicator from the CSVIs. The new PCFA indicator provides a relative metric of the activity of a specific port in commercial fishing and utilizes the same data sources as previously included in the CSVI engagement indicator; the number of commercial fishing permits, the number of permitted dealers, the pounds of landed fish, and the value of landed fish. Instead of conducting an annual Principal Components Analysis, this new indicator method simply normalizes each column of data (across all years) using a min-max scaling approach (range = 0 – 1) and then takes the mean of each column to create a composite average score for each port by year. Note, the value of landed fish data is first normalized by year to account for inflation over time. The PCFA analysis is conducted for each region (MA and NE) separately such that scores are comparable within region only.
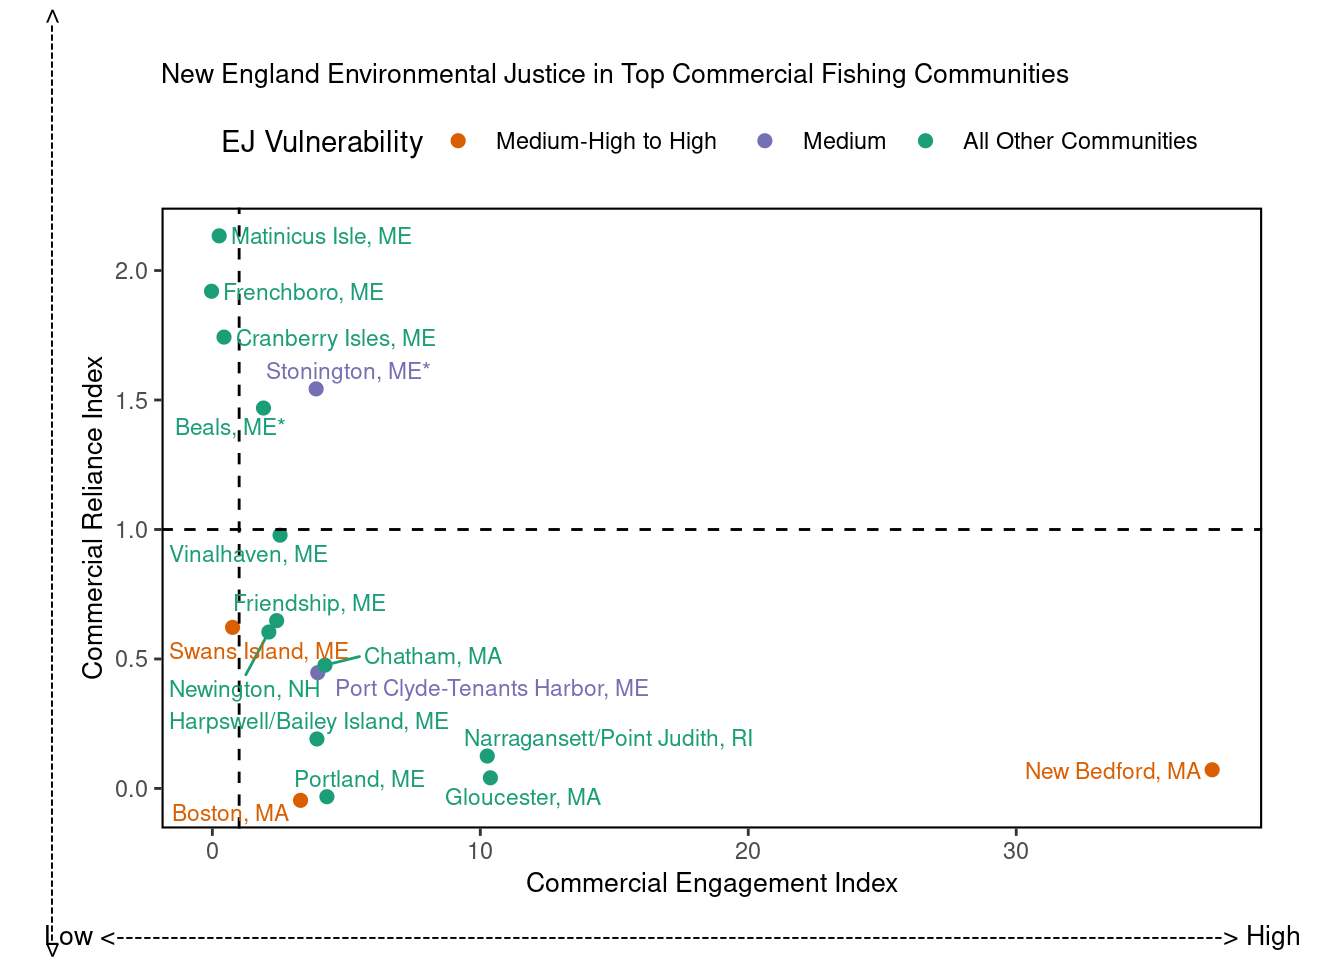
The Community Social Vulnerability Indicators utilize U.S. Census American Community Survey data and, as such, describe social characteristics at the municipality level (i.e., not just the fishing community). This includes metrics related to poverty, housing characteristics, and urban sprawl. In the SOE, we explore the CSVI scores as context for social attributes of the municipalities utilized by commercial fishing industry participants. In particular, we focus our analysis on three socio-demographic indicators; personal disruption, poverty, and population composition. The personal disruption index includes several variables that aim to characterize factors that may make it particularly challenging to respond to change because of personal circumstances affecting family life such as unemployment or educational level. The poverty index includes different metrics of poverty (e.g., families below poverty level and percent receiving cash public assistance income) such that a high score would indicate a community with a lower financial standing relative to other communities. The population composition index characterizes socio-demographic groups within communities that are traditionally thought to be increasingly vulnerable to change such as non-English speakers and female heads of households.
78.2 Key Results and Visualizations
The key results include two figures (one for each region) showing scores for the new PCFA indicator over time for the 2024 top fishing ports. Tables are also included that report CSVI results for 2023 (most recent year of data) generated from the U.S. Census American Community Survey for coastal municipalities. These CSVI tables provide important social characteristics at the municipality level. The municipalities house the top fishing ports identified in the PCFA analysis.
New England: Temporal comparisons of the new Port Commercial Fishing Activity Indicator (PCFA) revealed notable trends across several top fishing ports. For example, both New Bedford and Boston, MA have seen similar declines in fishing activity over the last two decades, whereby their 2024 PCFA scores are over 20% lower than their average scores from 2007-2011 (from hereon, percentage changes are reported in this same format). Gloucester, MA and Portland, ME have suffered even more precipitous 45% and 39% declines, respectively, in port activity. Importantly, New Bedford and Boston rank moderate or higher for all three socio-demographic CSVIs as well, suggesting that fishing industry participants that live in and/or utilize resources in this municipality may more vulnerable to change. Opposite trends (i.e., positive growth in fishing activity) were identified for several top communities including Chatham, MA and Stonington, Harpswell, and Friendship, ME; the latter of which benefited from a 95% increase in PCFA scores over time.
Mid-Atlantic: Temporal comparisons of the new Port Commercial Fishing Activity Indicator (PCFA) revealed notable trends across several top fishing ports. Six of the top 2024 communities experienced declines in PCFA scores from 15% - 35% compared to their average scores from 2007-2011 (from hereon, percentage changes are reported in this same format); Point Pleasant Beach, NJ; Ocean City, MD; Bronx, NY; Barnegat Light, NJ; Newport News, VA; Cape May, NJ. Of particular concern, the municipalities that house Bronx, NY and Newport News, VA both rank moderate or higher for all three socio-demographic CSVIs as well, suggesting that fishing industry participants that live in and/or utilize resources in this municipality may more vulnerable to change. Opposite trends (i.e., positive growth in fishing activity) were identified for the other four top communities, most notably Hampton Bays/Shinnecock, NY benefited from a 84% increase in PCFA scores over time.


78.3 Indicator statistics
Spatial scale: Greater Atlantic region fishing ports and coastal municipalities
Temporal scale: PCFA Indicator = Annual from 2007-2024; CSVI = 2023
Synthesis Theme:
78.4 Implications
A new composite indicator – the ‘Port Commercial Fishing Activity (PCFA) Indicator’ – utilizes NOAA data on dealers, fish landings, and commercial permits to explore trends in commercial fishing activity over time in top ports. This information can be used to understand how changes in fish stocks, regulations, and other social-ecological factors may have disparately impacted ports throughout the Greater Atlantic region. By integrating the Community Social Vulnerability Indicators, we highlight municipalities with relatively concerning socio-demographic conditions. As such, fishing industry participants that live in and/or utilize resources in these municipalities may be more vulnerable to changes.
78.5 Get the data
Point of contact: Robert Murphy (robert.murphy@noaa.gov)
ecodata name: ecodata::engagement
Variable definitions
- Community: name of the municipality identified as a community in the CSVIs. 2. personal_disruption_rank: CSVI personal disruption factor score ranking. Low, moderate, moderate high, high
- pop_composition_rank: CSVI population composition factor score ranking. Low, moderate, moderate high, high
- poverty_rank: CSVI poverty factor score ranking. Low, moderate, moderate high, high
- labor_force_str_rank: CSVI labor force structure factor score ranking. Low, moderate, moderate high, high
- housing_characteristics_rank: CSVI housing characteristics factor score ranking. Low, moderate, moderate high, high
- housing_disrupt__rank: CSVI housing disruption factor score ranking. Low, moderate, moderate high, high
- retiree_migration_rank: CSVI retiree migration factor score ranking. Low, moderate, moderate high, high
- urban_sprawl_rank: CSVI urban sprawl factor score ranking. Low, moderate, moderate high, high 10. PORT_NAME: fishing data port name 11. STATE_ABB: fishing data port state abbreviation
- place_id: fishing data port and state abbreviation combined 13. YEAR: the year of fishing data
- fishing_mean_score: composite Port Commercial Fishing Activity Indicator score (range between 0 and 1)
Indicator Category:
78.7 Accessibility and Constraints
Please email Robert Murphy (robert.murphy@noaa.gov) for further information and queries of fishing and vulnerability indicator source data.
tech-doc link https://noaa-edab.github.io/tech-doc/engagement.html