56 Thermal Habitat Gridded
Description: The number of days per year per 1/12 degree cell that exceeds a temperature threshold.
Indicator family:
Contributor(s): Joe Caracappa
Affiliations: NEFSC
56.1 Introduction to Indicator
Many deep water benthic and demersal species exhibit thermal preferences for metabolic, reproductive, and growth processes. Temperatures above these thermal presences may impair these processes. Data originate from GLORYS12V1 global reanalysis for 1993-01-01 to 2025-12-31. Cells are mapped to 3 depth bins: 0-25m, 25-100m, and >100m. Temperature thresholds range from 0.5 to 30 °C at 0.5 °C increments. The GLORYS 1/12 degree grid is mapped to EPU_NOESTUARIES shape files by the center point of each grid cell.
56.2 Key Results and Visualizations
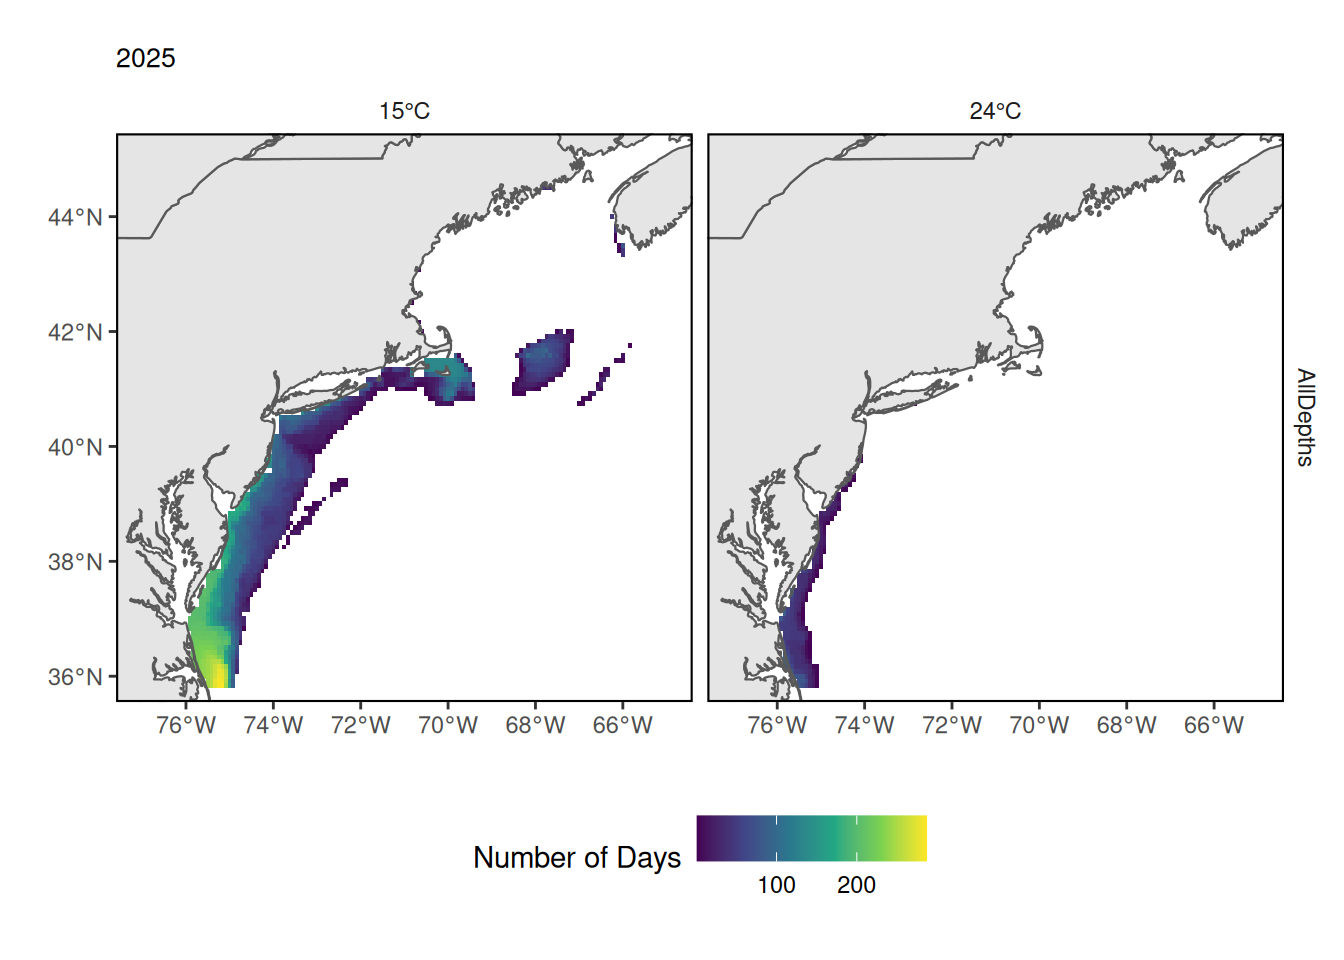
Maps of full NE shelf with cell shading gradient showing number of days exceeding temperature thresholds. Thresholds at 15C and 24C are shown as they correspond to generalized tolerances for warm and cold water species. In 2025, much of the Mid-Atlantic Bight (MAB), the shelf break and Nantucket Shoals experienced some days exceeding 15C, with a longer duration in the southern MAB. In 2025, only the southern and/or shallow portion of the MAB exceeded the 24C threshold.
#> [1] "This is a shelfwide indicator only used in the MidAtlantic report"56.4 Implications
Using a high resolution bottom temperature product shows localized heat stress within EPUs that may be masked when looking at mean EPU bottom temperature. It is important to look at the spatial patterns of temperature exceedances to understand the potential impacts on species with different thermal tolerances and habitat preferences. The duration of such events is also important in determining potential mortality risk.
56.5 Get the data
Point of contact: joseph.caracappa@noaa.gov
ecodata name: ecodata::thermal_habitat_gridded
Variable definitions
Time: year EPU: EPU Depth: Depth Category Var: cutoff temperature for thermal area calculations (all areas greater than or equal to this temperature)
Value: Number of days exceeding Var Latitude: latitude of cell center point Longitude: longitude of cell center point
Source: GLORYS (CMEM’s GLORYS12V1 global reanalysis bottom temperature) Units: Number of Days
Indicator Category:
56.7 Accessibility and Constraints
No response
tech-doc link https://noaa-edab.github.io/tech-doc/thermal_habitat_gridded.html