61 Annual Heatwave Intensity
Description: Surface and bottom marine heatwaves (MHWs) for 2023.
Indicator family:
Contributor(s): Vincent Saba, Joseph Caracappa
Affiliations: NEFSC
61.1 Introduction to Indicator
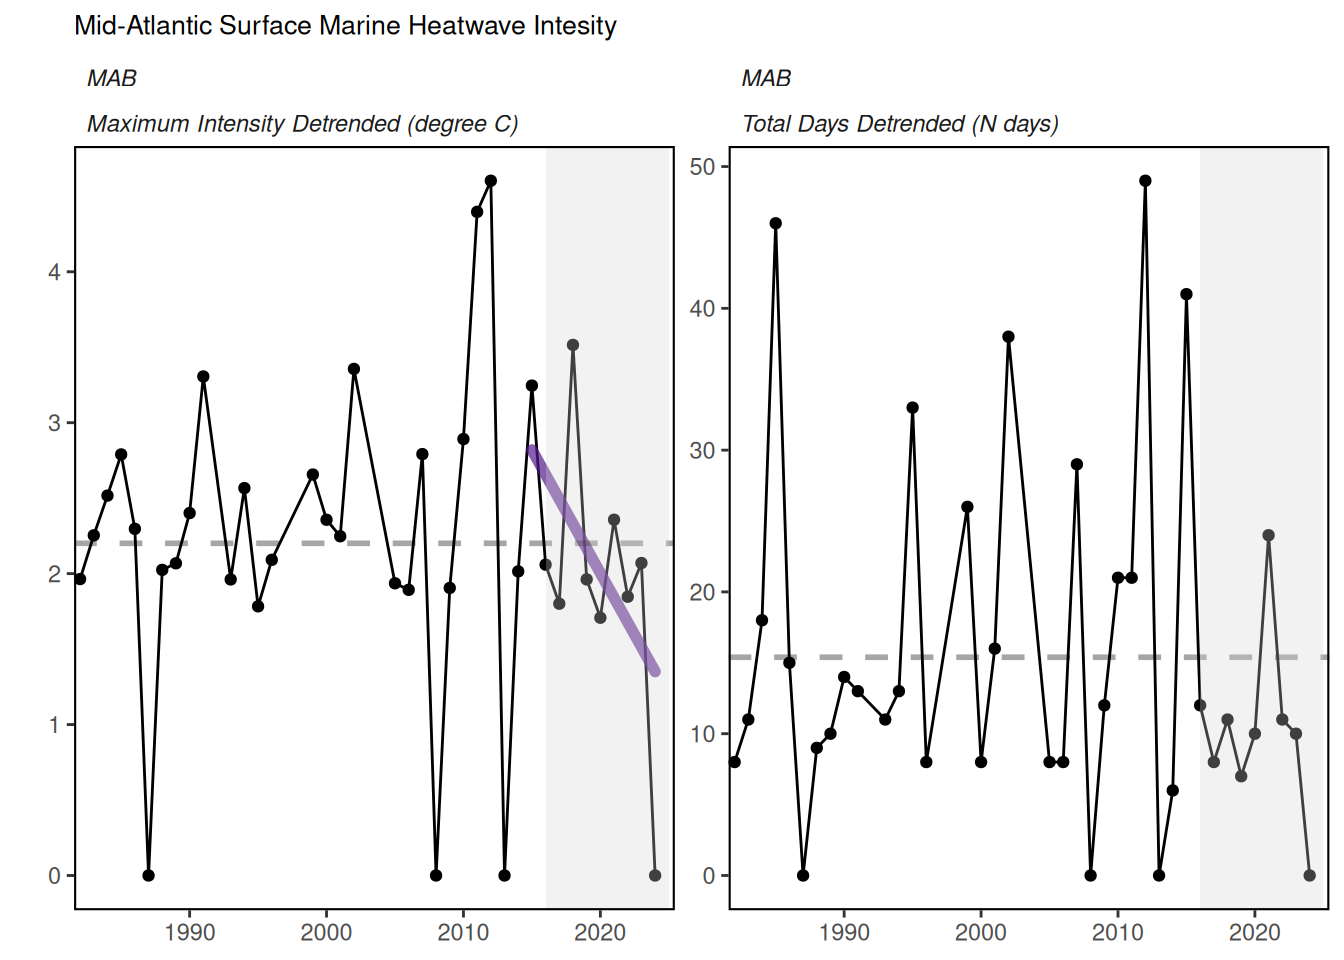
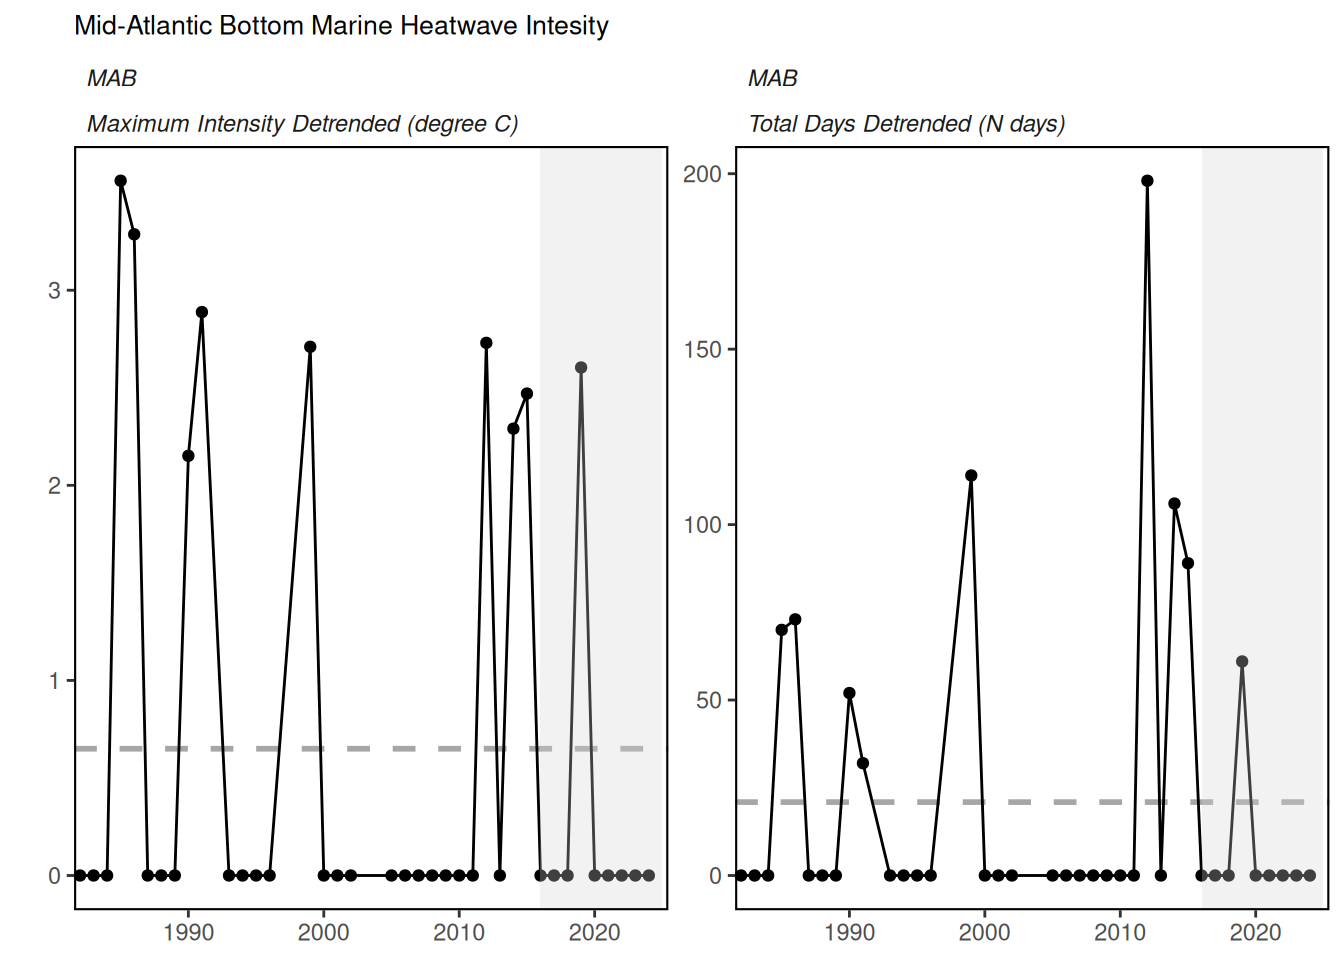
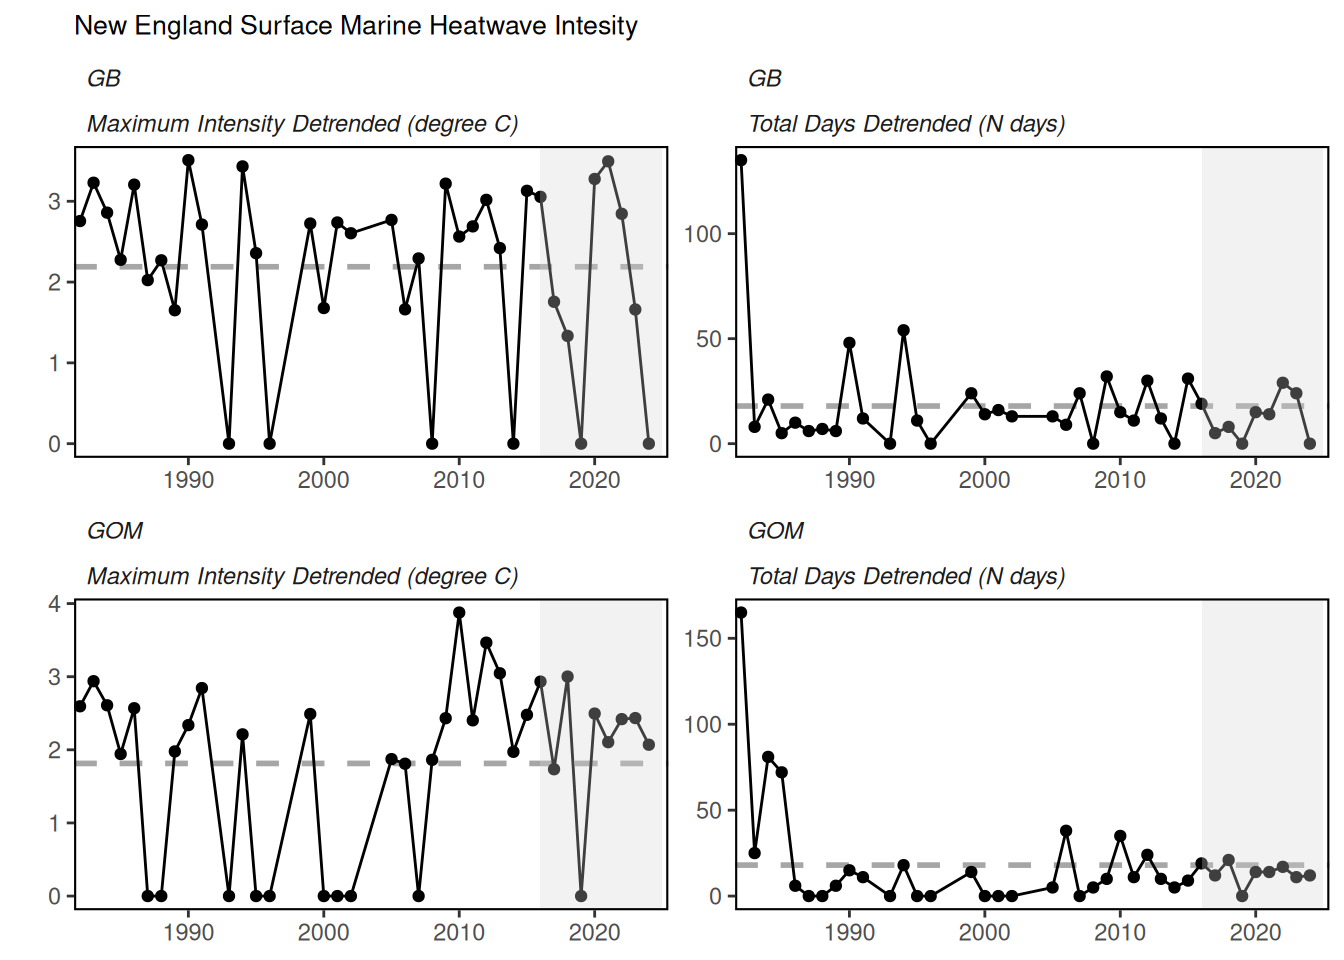
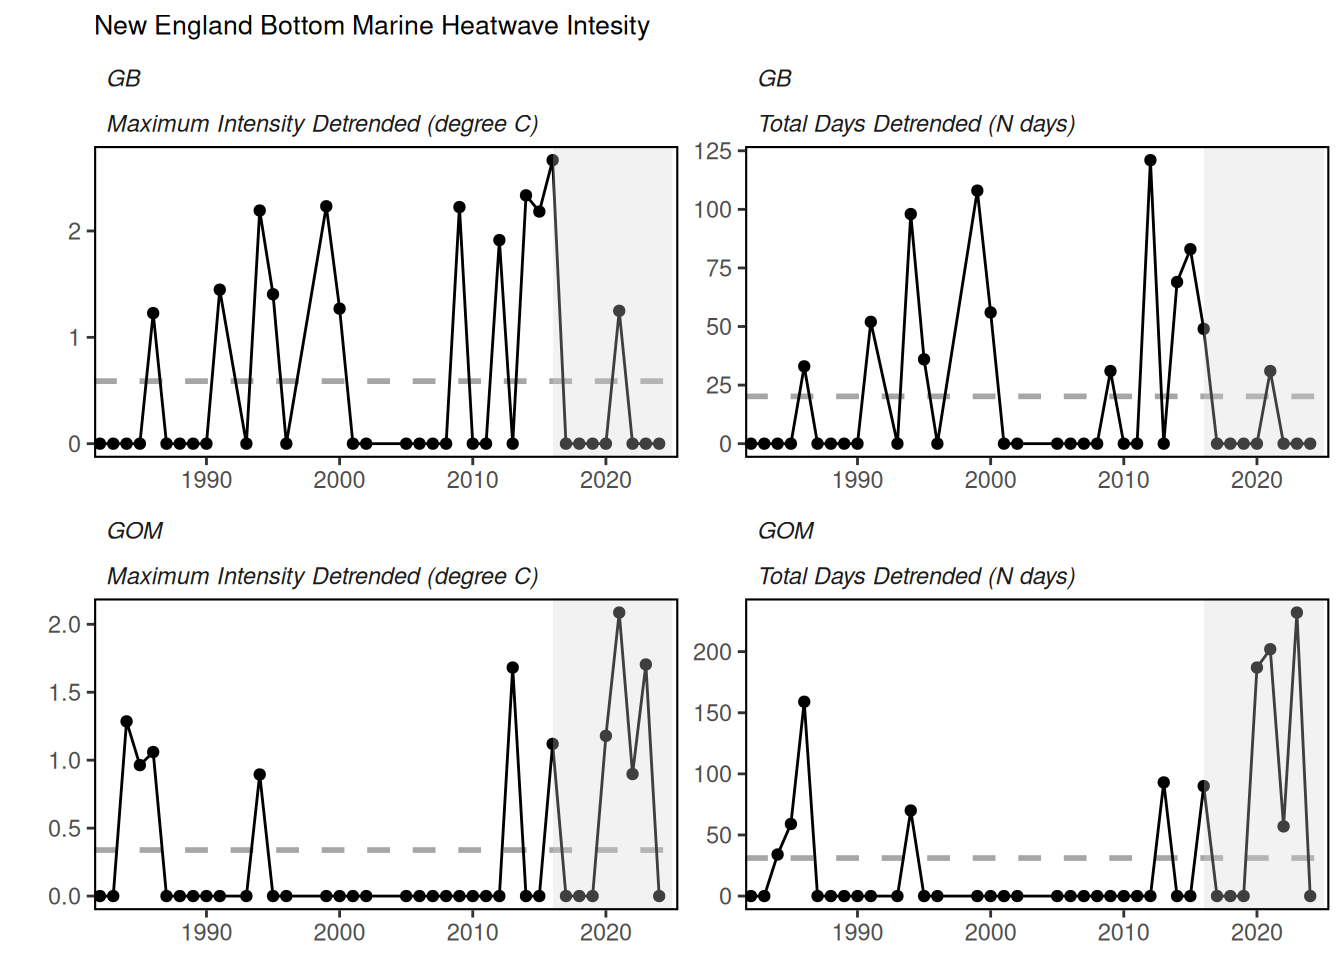
Marine heatwaves (MHWs) measure not just temperature, but how long the ecosystem is subjected to the high temperature. They are driven by both atmospheric and oceanographic factors and can have dramatic impacts on marine ecosystems. Marine heatwaves are measured in terms of intensity (water temperature) and duration (the cumulative number of degree days) using measurements of sea surface temperature (surface MHWs) or models of bottom temperature (bottom MHWs). Recent research ([93] and [94]) have modified the original MHW methodology, [95]. The MHW indices for both surface and bottom use temperature time-series data that are detrended and the entire time-series are used as the climatology (e.g. 1982-2024 in this SOE). Surface MHW events are based on the criteria of a warming event that lasts for five or more days with sea surface temperatures above the 90th percentile of the historical daily climatology (1982-2024). Bottom MHW events are based on the criteria of a warming event that lasts for thirty or more days with bottom temperatures above the 90th percentile of the historical daily climatology (1982-2024). The longer time period criterion for bottom temperature is due to the longer persistence time of ocean bottom temperature anomalies in the U.S. northeast shelf ([76]). The new MHW indices can now discern extreme events that truly are “extreme” rather than occupying most of the year. Because this approach moves from a fixed baseline to a shifting baseline by detrending ocean temperature data and using the entire time-series as a climatology, the global warming signal is removed and thus we are left with extremes in the variability of ocean temperature. To assess total heat stress on marine organisms, one can combine long-term ocean warming and MHWs. Therefore, the 2025 SOE also reports on long-term SST and bottom temperature time-series that clearly show the decadal ocean warming trend.
61.2 Key Results and Visualizations
Georges Bank
Surface MHWs In 2024, Georges Bank did not experience any surface MHWs.
Bottom MHWs In 2024, Georges Bank did not experience any bottom MHWs. The strongest bottom MHW on record in Georges Bank was in the fall of 2016. Of the identified 13 bottom MHWs on Georges Bank between 1982 and 2023, four of the top five events in terms of maximum intensity occurred in the last decade.
Gulf of Maine
Surface MHWs In 2024, the Gulf of Maine experienced a surface MHW that started on May 29th and lasted 12 days.
Bottom MHWs In 2024, the Gulf of Maine did not experience any bottom MHWs.
Mid-Atlantic Bight
Surface MHWs In 2024, the Mid-Atlantic Bight did not experience any surface MHWs.
Bottom MHWs In 2024, the Mid-Atlantic Bight did not experience any bottom MHWs. The strongest bottom MHW occurred in the fall of 1985.
61.4 Implications
Implications of MHWs on living marine resources in the U.S.NES are currently being investigated. The 2012 surface MHW events in the Gulf of Maine did have impacts on the lobster fishery in the summer and fall of 2012.
61.5 Get the data
Point of contact: Vincent Saba (vincent.saba@noaa.gov)
ecodata name: ecodata::heatwave
Variable definitions
- MHW maximum Intensity (detrended) = degrees C 2. MHW duration = days.
Indicator Category:
61.7 Accessibility and Constraints
No response
tech-doc link https://noaa-edab.github.io/tech-doc/heatwave.html