43 Bottom temperature - Seasonal Anomaly
Description: The data presented here are seasonal bottom temperature anomalies. This includes seasonal bottom temperature anomalies by each EPU on the Northeast Continental Shelf from observation-based bottom temperature sources as well as the MOM6 ocean model.
Indicator family:
Contributor(s): Joseph Caracappa, Vincent Saba, Zhuomin Chen, Laura Gruenburg, Andrew Ross
Affiliations: NEFSC, GFDL
43.1 Introduction to Indicator
The raw bottom temperature product is in a horizontal 1/12 degree grid between 1959 and 2023 and is made of daily bottom temperature estimates from:
Bias-corrected ROMS-NWA (ROMScor) between 1959 and 1992 which was regridded in the same 1/12degree grid as GLORYS using bilinear interpolation; GLORYS12v1 in its original 1/12 degree grid between 1993 and 2024-09-10; and PSY in it’s 1/12 degree grid from 2023-08-29 to 2023-12-31. The Modular Ocean Model Version 6 (MOM6) is at roughly 1/12 a degree horizontal resolution with data from 1993-2019 from a hindcast simulation which has no data assimilation. In addition to the hindcast, the model will be run as a seasonal to annual forecast, a decadal forecast, and a centennial projection. Investigating the ability of this model to reproduce key indicators can help us to develop confidence in the model, as well as learn where improvements can be made.
Anomalies are calculated using the 1990-2020 reference period.
43.2 Key Results and Visualizations
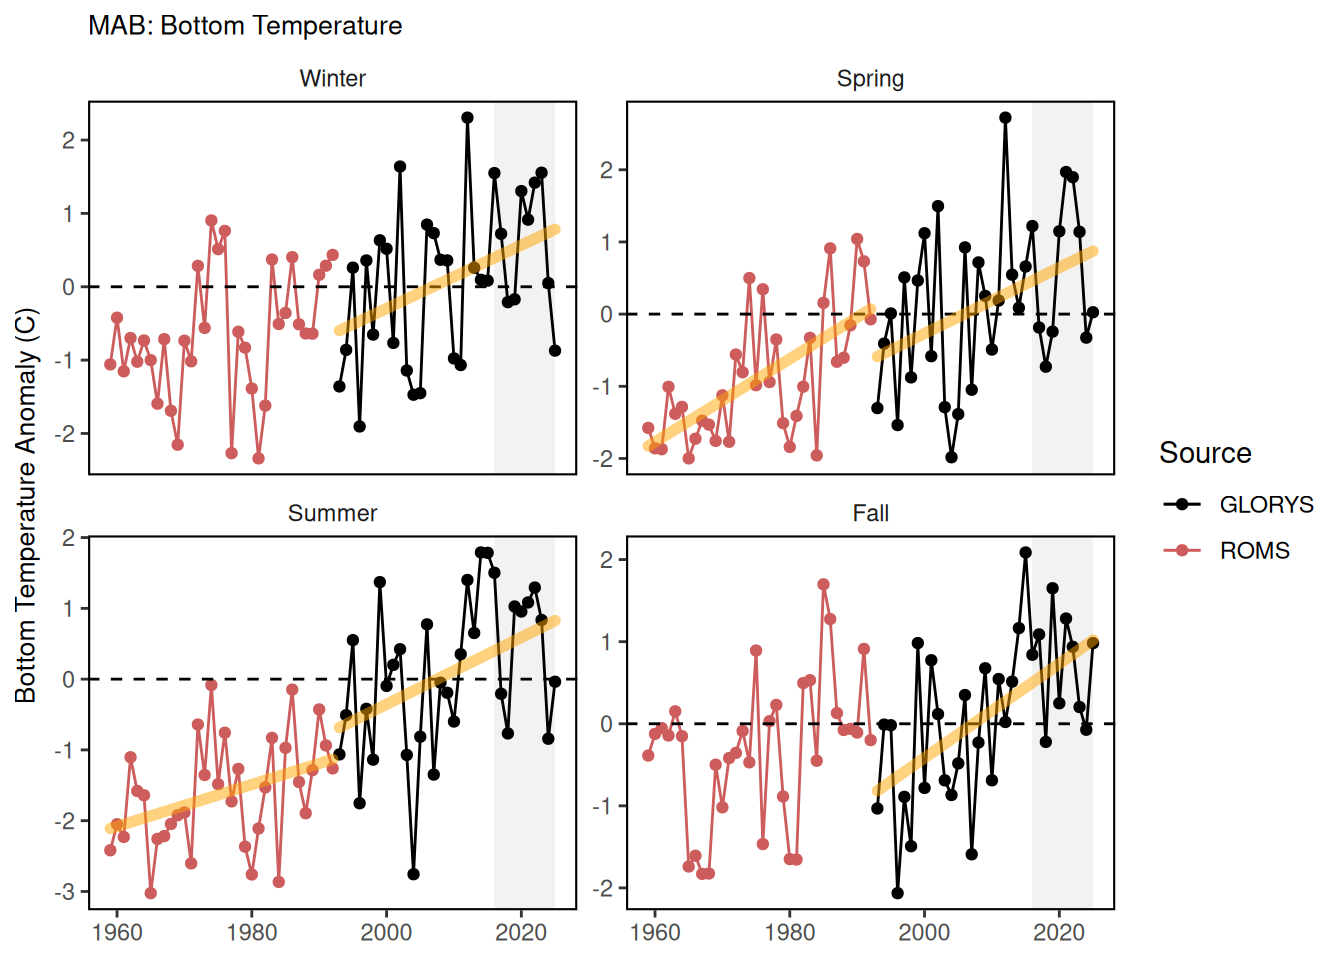
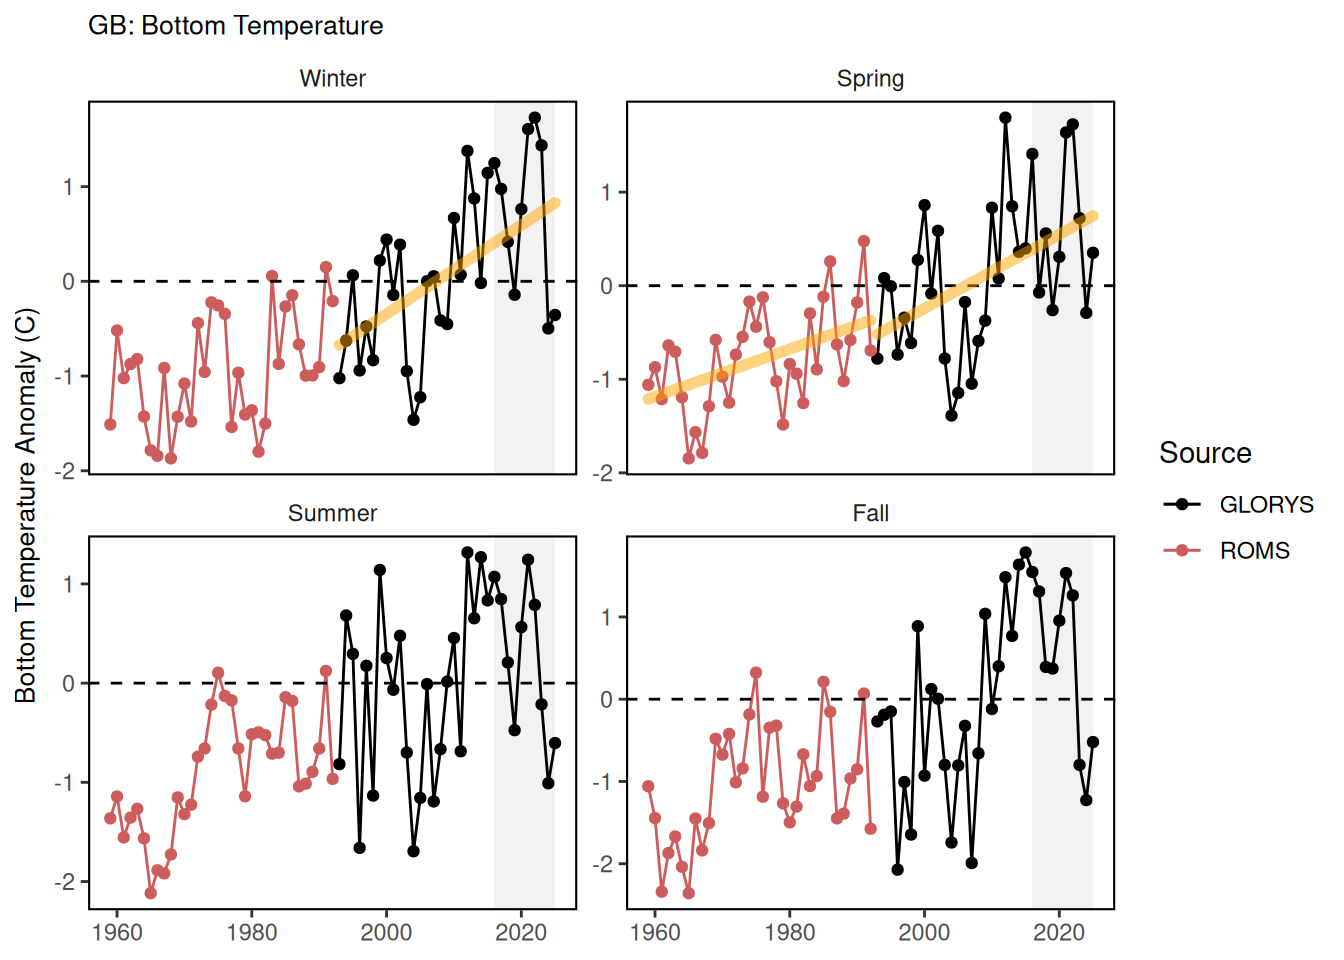
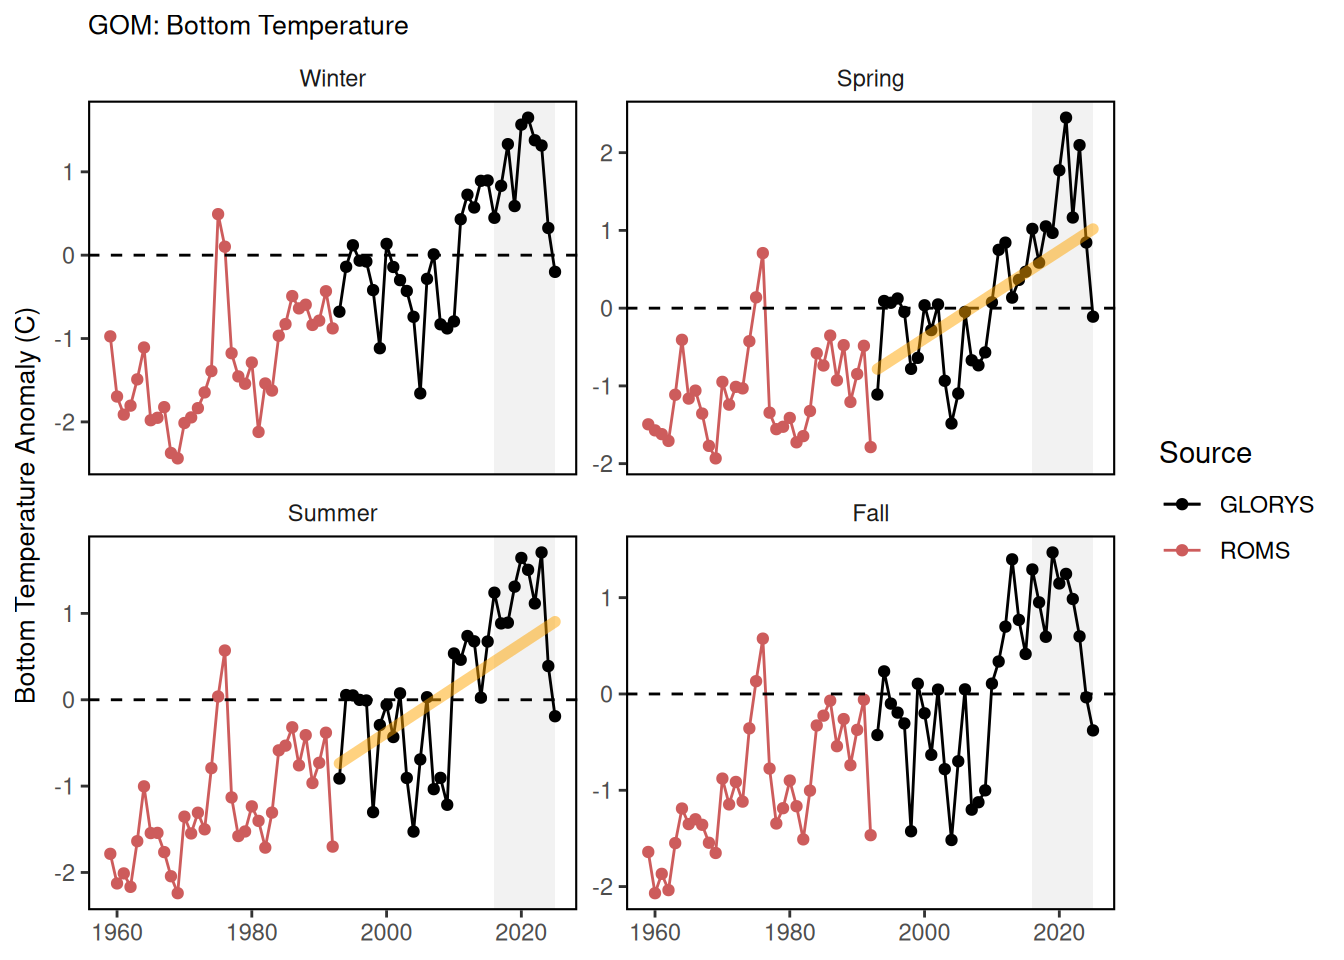
GLORYS, ROMS and PSY Time series plots for seasonal bottom temperature anomaly for each EPU shows a long-term warming trend. PSY forecasted data also included for comparison and indicates varying skill in predicting regional bottom temperature.
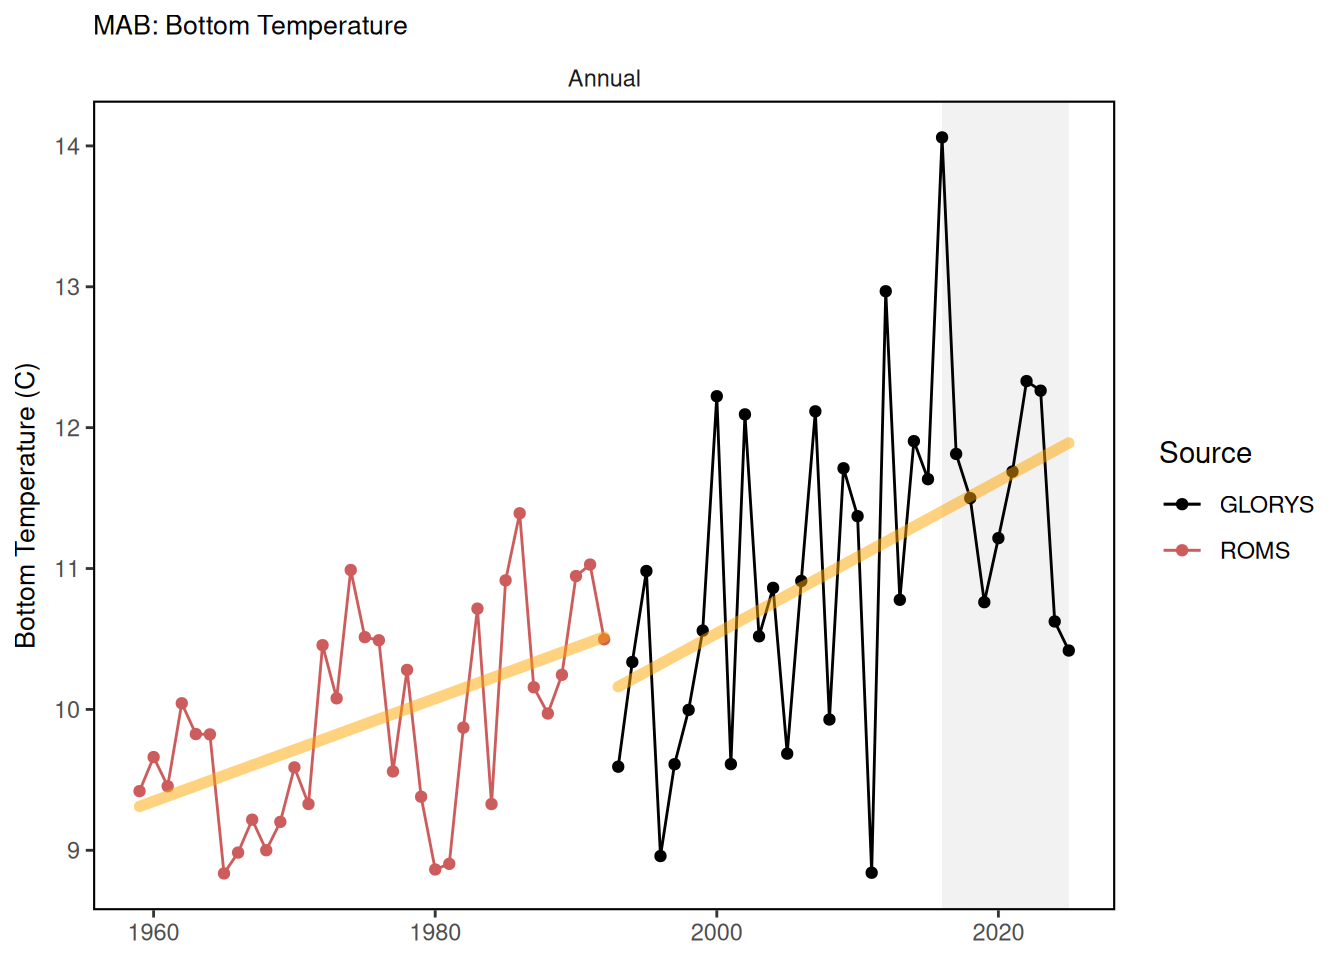
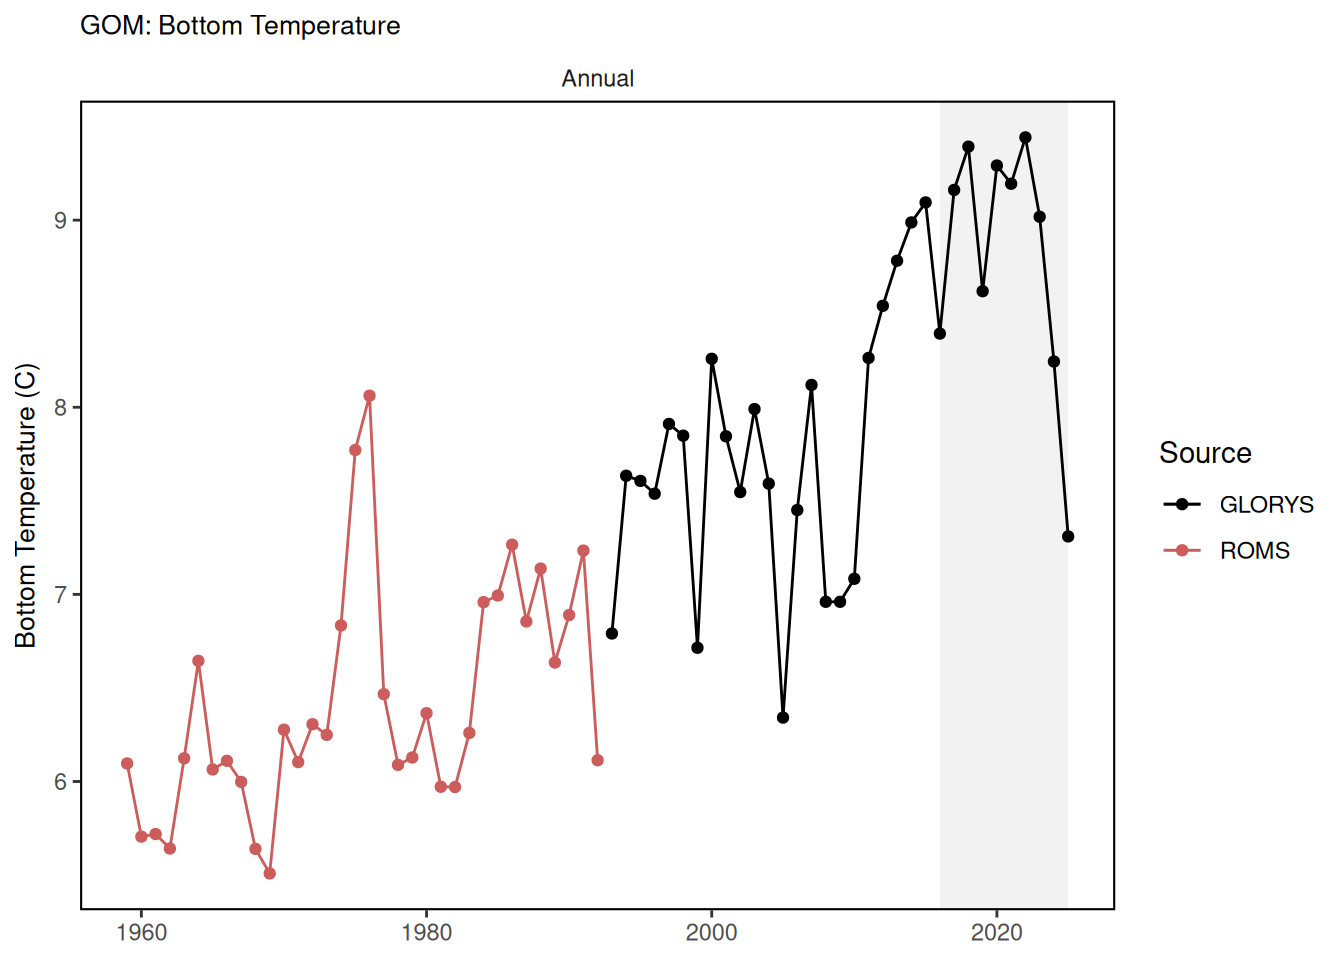
MOM6 Here we show the seasonal temperature anomalies in the Mid Atlantic Bight (MAB), Georges Bank (GB) and Gulf of Maine (GOM) EPUs. Data from 1959 through 1992 are from the biased corrected ROMS dataset ([65]). Data from 1993 through 2019 are from MOM6 ([66]), and 1993 through 2023 are from GLORYS12 reanalysis ([67]). For the anomaly plots the climatology period is 1990 through 2020.
The MOM6 model hindcast does a good job at reproducing seasonal bottom temperature anomalies calculated from GLORYS12 reanalysis data. Because the 1959 through 1992 ROMS was biased corrected using the GLORYS12 dataset, calculating seasonal climatologies using primarily MOM6 data introduces a new, different bias. The differing ability of the model to accurately reproduce bottom temperature during different seasons also likely contributes to the discrepancies between the two time series in the annual bottom temperature plots.

43.4 Implications
Bottom temperature is an important driver for benthic and demersal species growth, metabolism, and reproduction. Changes in seasonal bottom temperature have implications for species’ phenology. Data from ocean models is an important tool that we can use to understand changes to the marine environment. The MOM6 regional model for the Northwest Atlantic hindcast can provide consistent data in space and time where gaps exist in observations. Model data can also be used to forecast future conditions. The ability of MOM6 to reproduce seasonal temperature anomalies in these EPUs increases confidence in the model.
43.5 Get the data
Point of contact: joseph.caracappa@noaa.gov
ecodata name: ecodata::bottom_temp_model_anom
Variable definitions
Season: 1 = winter (January – March), 2 = spring (April – June), 3 = summer (July – September), 4 = fall (October – December) Subarea: EPU name Source: ROMS (bias-corrected ROMS-NWA bottom temperature [65]), GLORYS (CMEM’s GLORYS12V1 global reanalysis bottom temperature), PSY (CMEM’s PSY global forecast bottom temperature) bt_temp : mean bottom temperature for each year/season across entire EPU ref_bt: bottom temperature climatology for season/EPU based on 1990-2020
Indicator Category:
43.7 Accessibility and Constraints
No response
tech-doc link https://noaa-edab.github.io/tech-doc/bottom_temp_model_anom.html