2 Phytoplankton
Description: Satellite derived phytoplankton data including chlorophyll concentration, primary production, and phytoplankton size class for the Northeast Continental Shelf and ecological production units.
Indicator family:
Contributor(s): Kimberly Hyde
Affiliations: NEFSC
2.1 Introduction to Indicator
Phytoplankton are key biological regulators of the structure and function of most marine ecosystems. They are the foundation of the marine food web and are the primary food source for zooplankton and filter feeders such as shellfish. Numerous environmental and oceanographic factors interact to drive the abundance, composition, spatial distribution, seasonal timing and productivity of phytoplankton. Satellite derived measurements of chlorophyll, the dominant photosynthetic pigment in phytoplankton, are used to estimate total phytoplankton biomass. Phytoplankton growth depends on the availability of carbon dioxide, sunlight and nutrients and their growth rates can be influenced by water temperature, water depth, wind, and grazing pressure. Primary productivity is a measure of the amount of carbon produced by phytoplankton. The size structure of the phytoplankton community influences important biogeochemical and ecological processes, including transfer of energy through the marine food web.
The unique physical characteristics of the Northeast U.S. continental shelf help make it among the most productive continental shelf systems in the world influenced by both bottom-up (e.g. nutrient concentrations, light availability, and mixing/stratification) and top-down (e.g. grazing) controls. Phytoplankton biomass, productivity, and composition all have high spatial, seasonal and interannual variability. The most pronounced spatial pattern is the decrease in phytoplankton biomass from the coast to the shelf break. Georges Bank and Nantucket Shoals are shallow regions that are well mixed by tides. This mixing supplies sufficient nutrients to support phytoplankton growth throughout the year. In other regions, blooms of large diatom species occur on a seasonal cycle when growing conditions are ideal.
2.2 Key Results and Visualizations
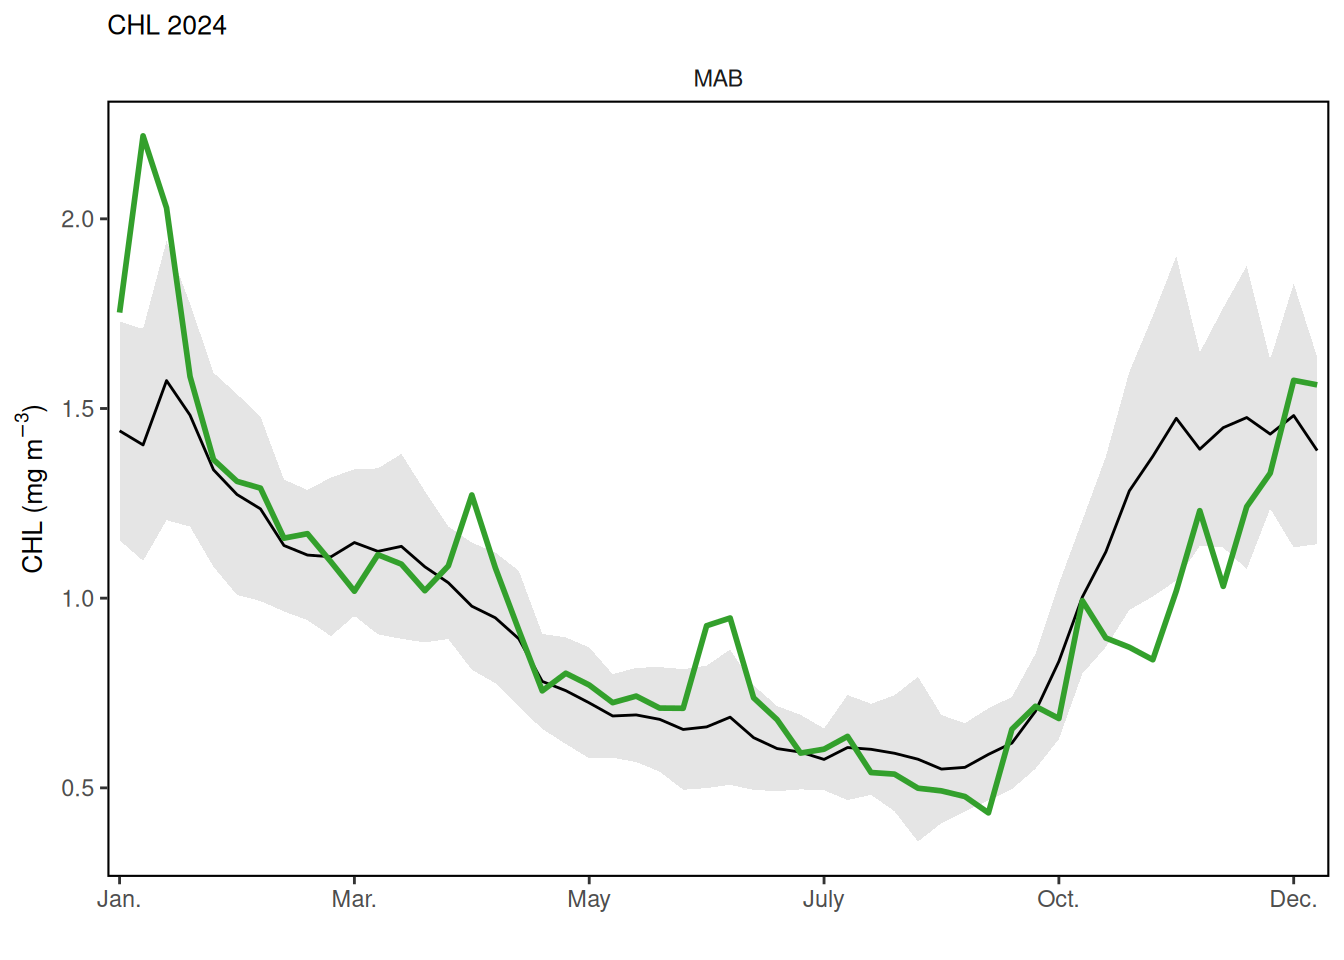
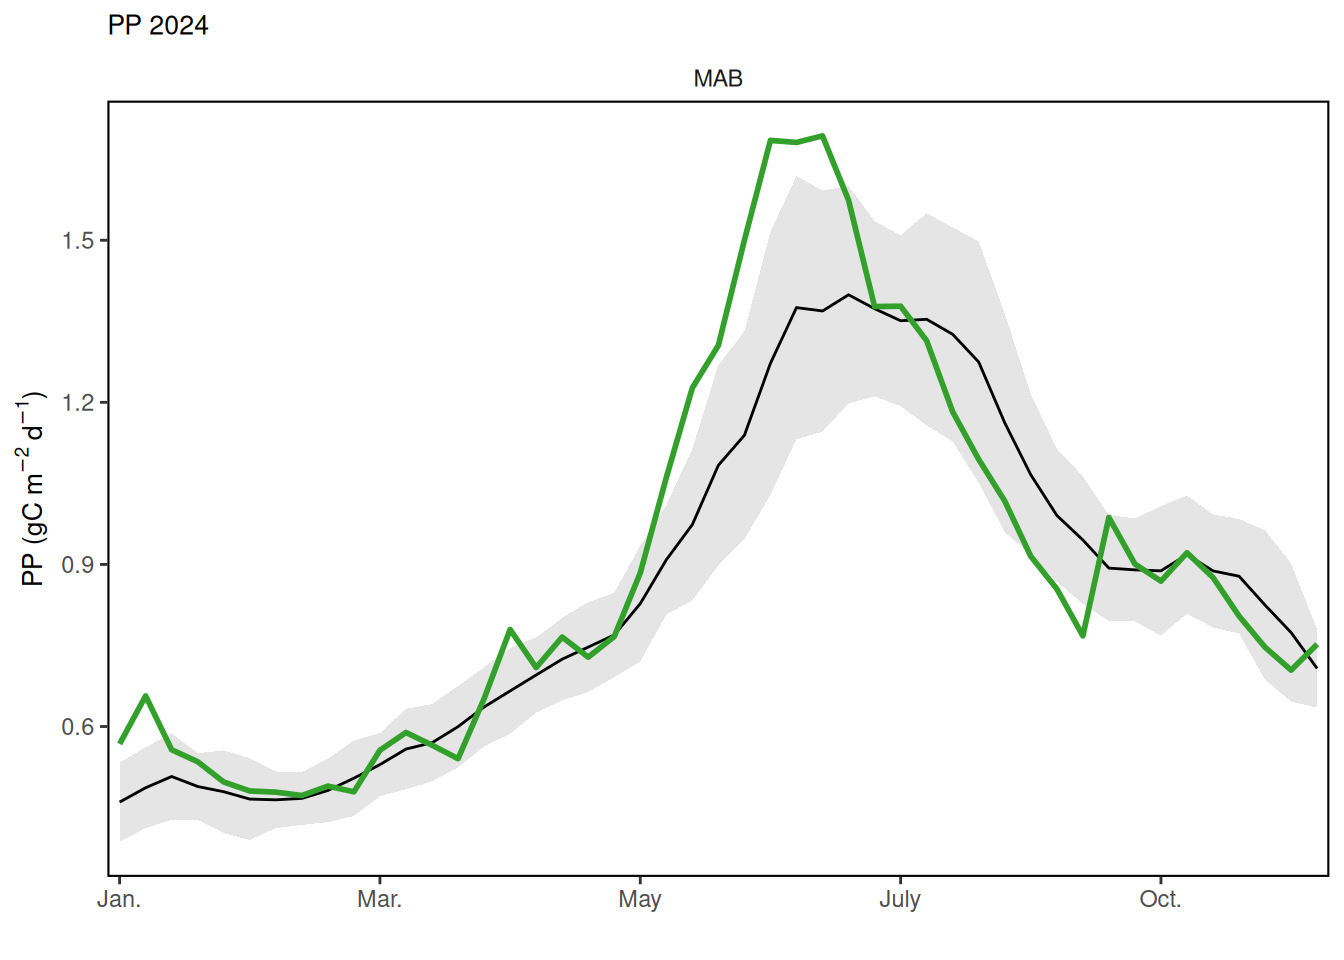
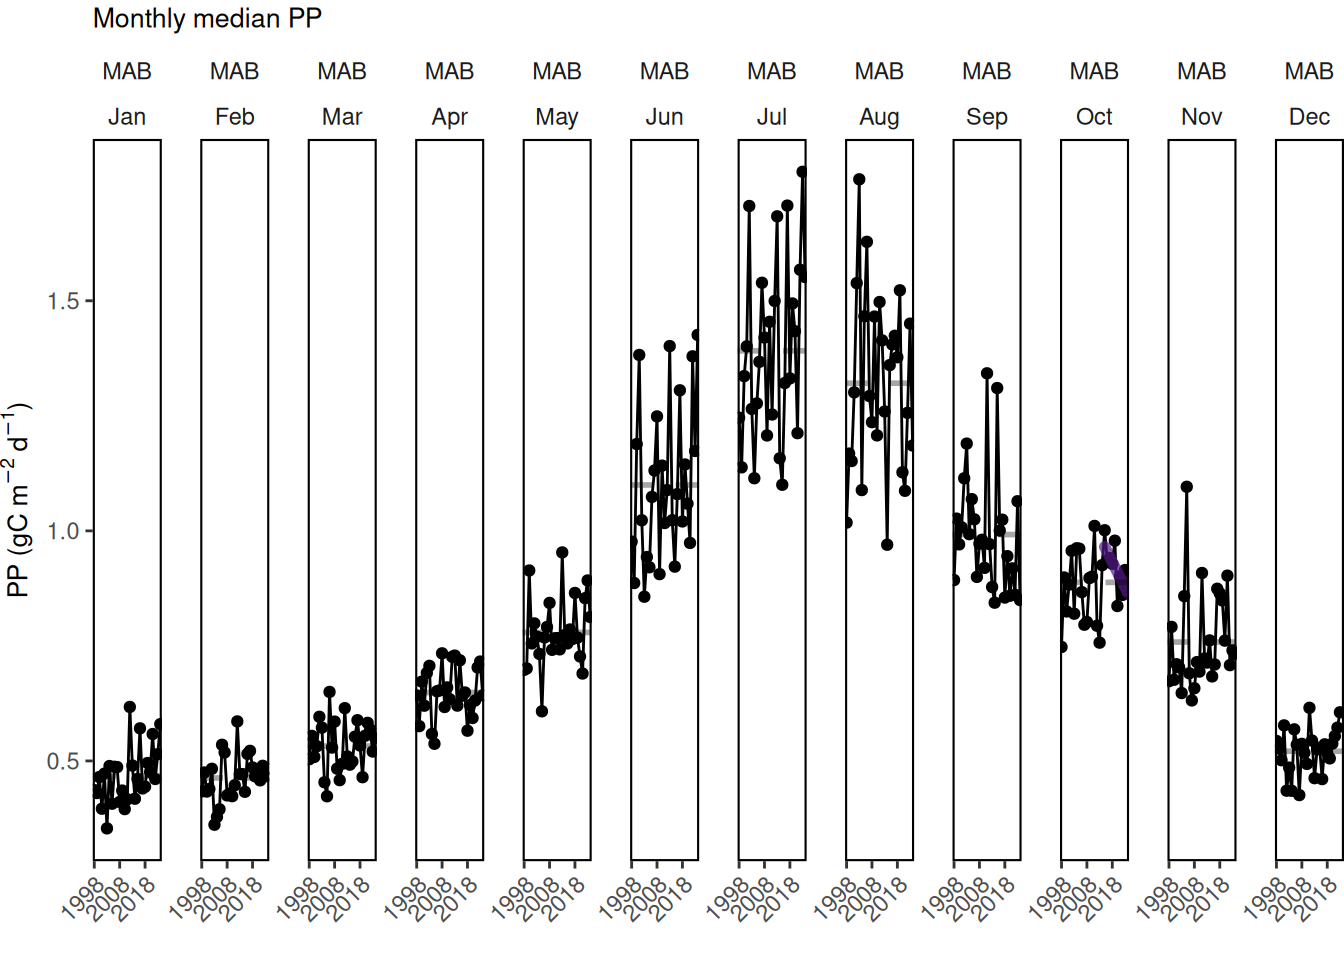
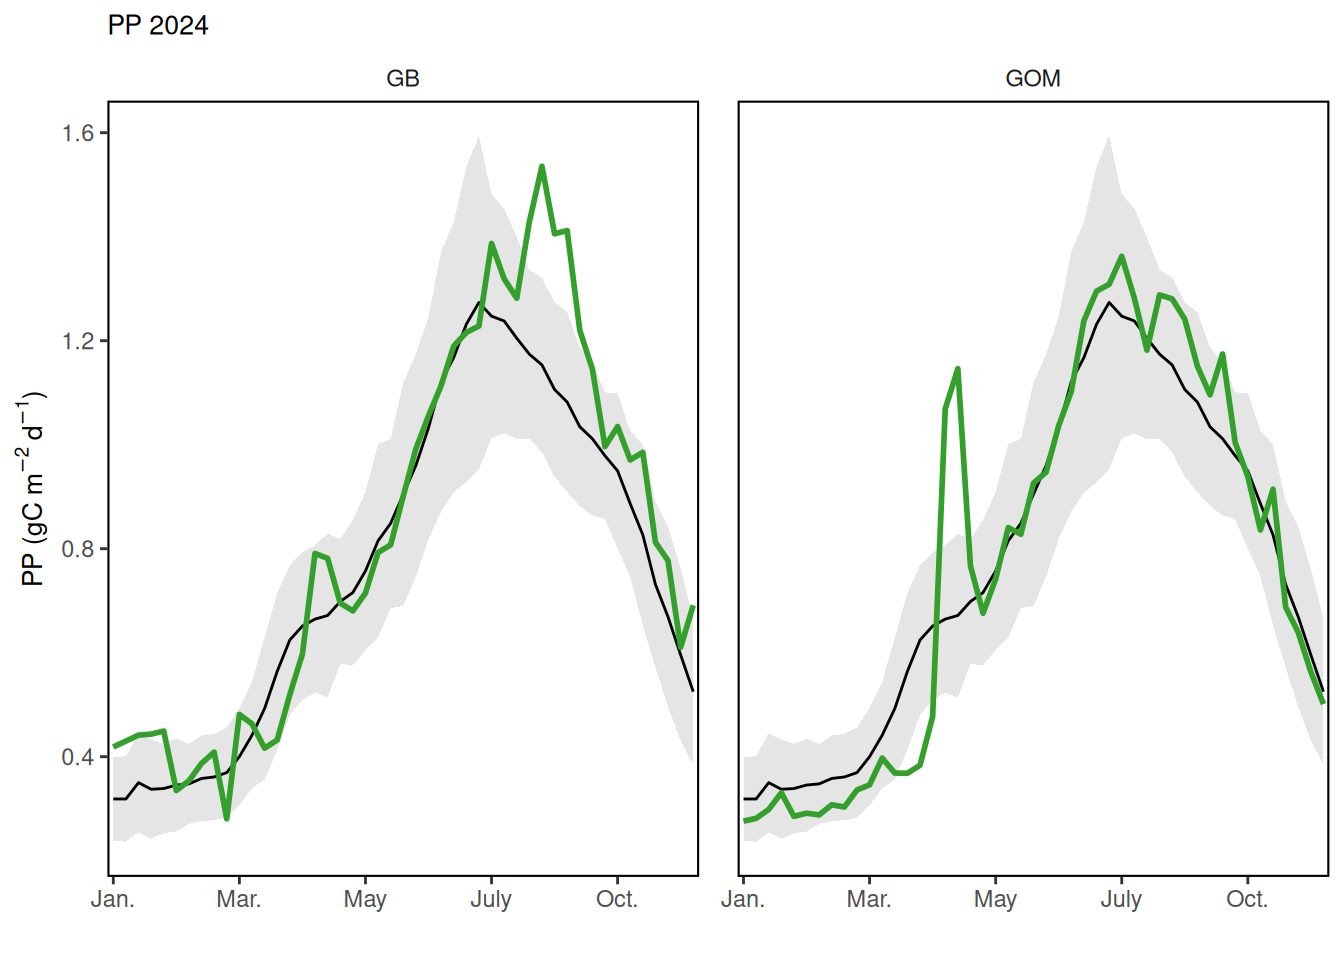
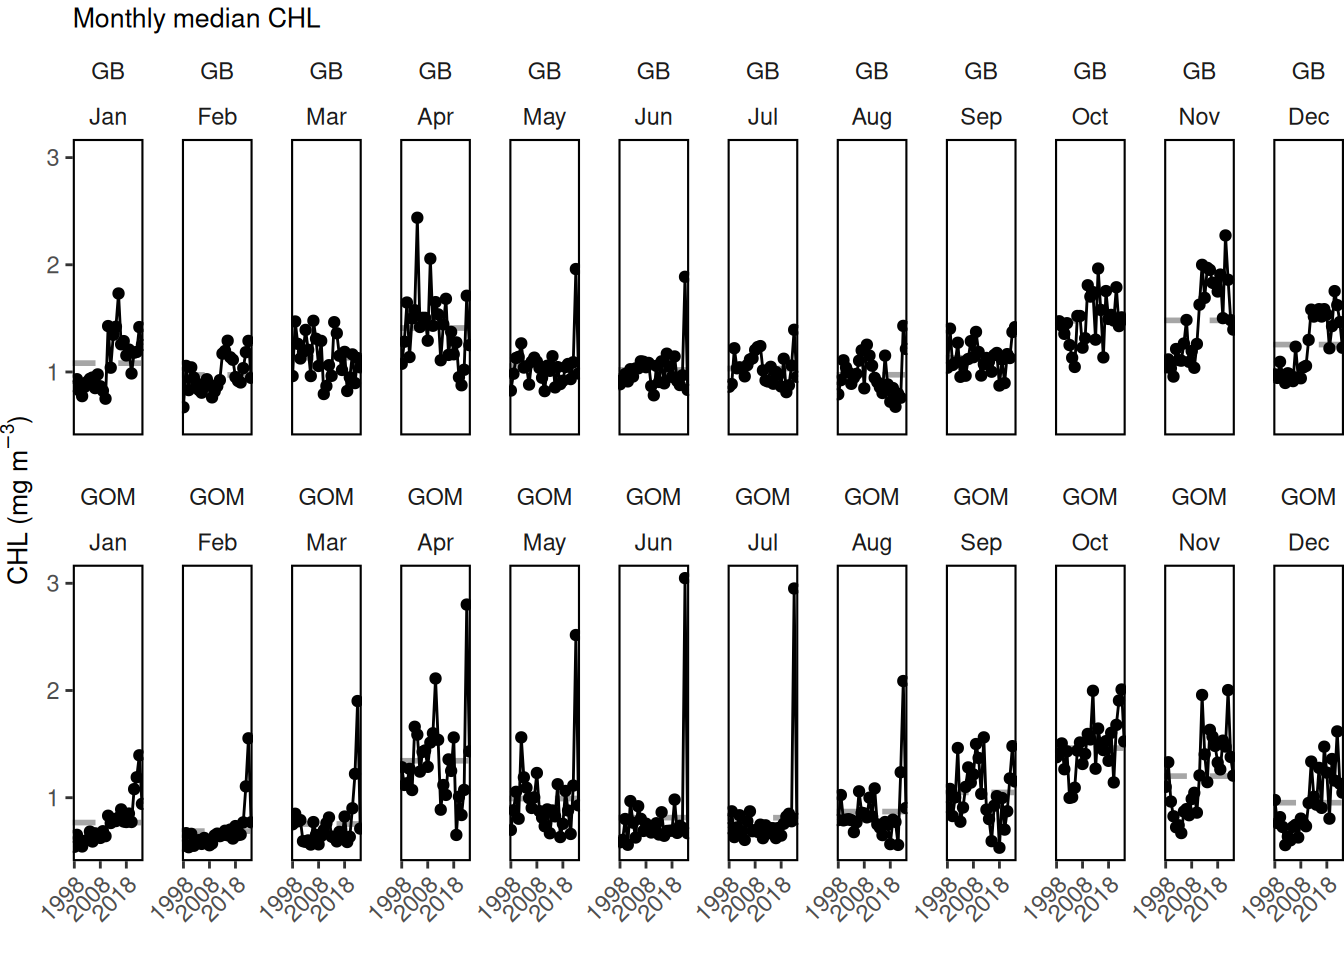
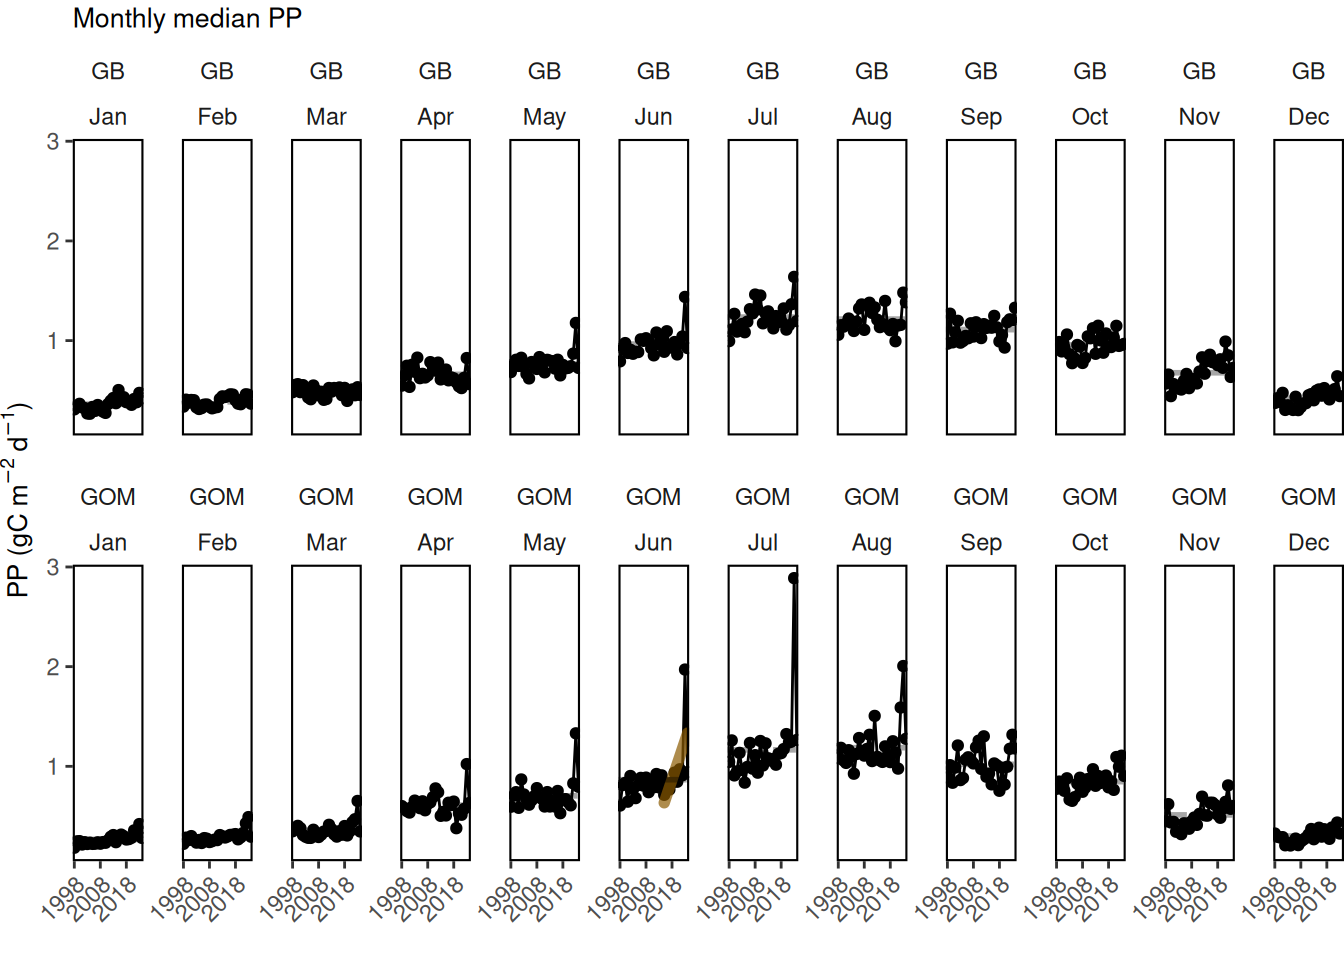
The seasonal cycle of phytoplankton biomass (shown as chlorophyll a) typically includes peaks during the winter-spring and fall seasons and minimums during the summer months, however exact bloom timing varies by region. Primary productivity, increases during bloom periods due to increased biomass, but peaks during the summer months when daylight and temperatures are greatest.
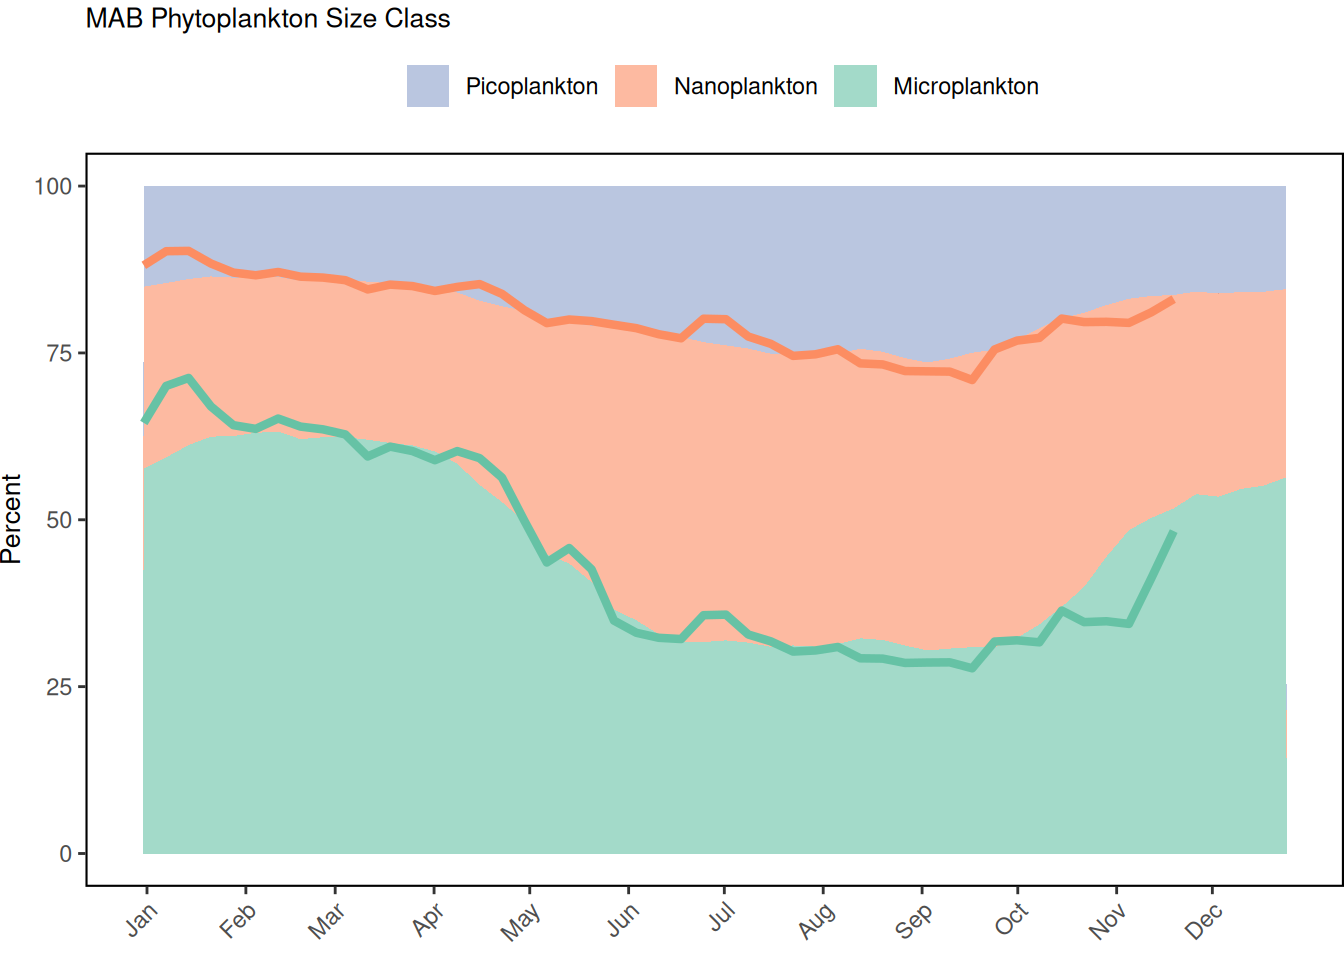
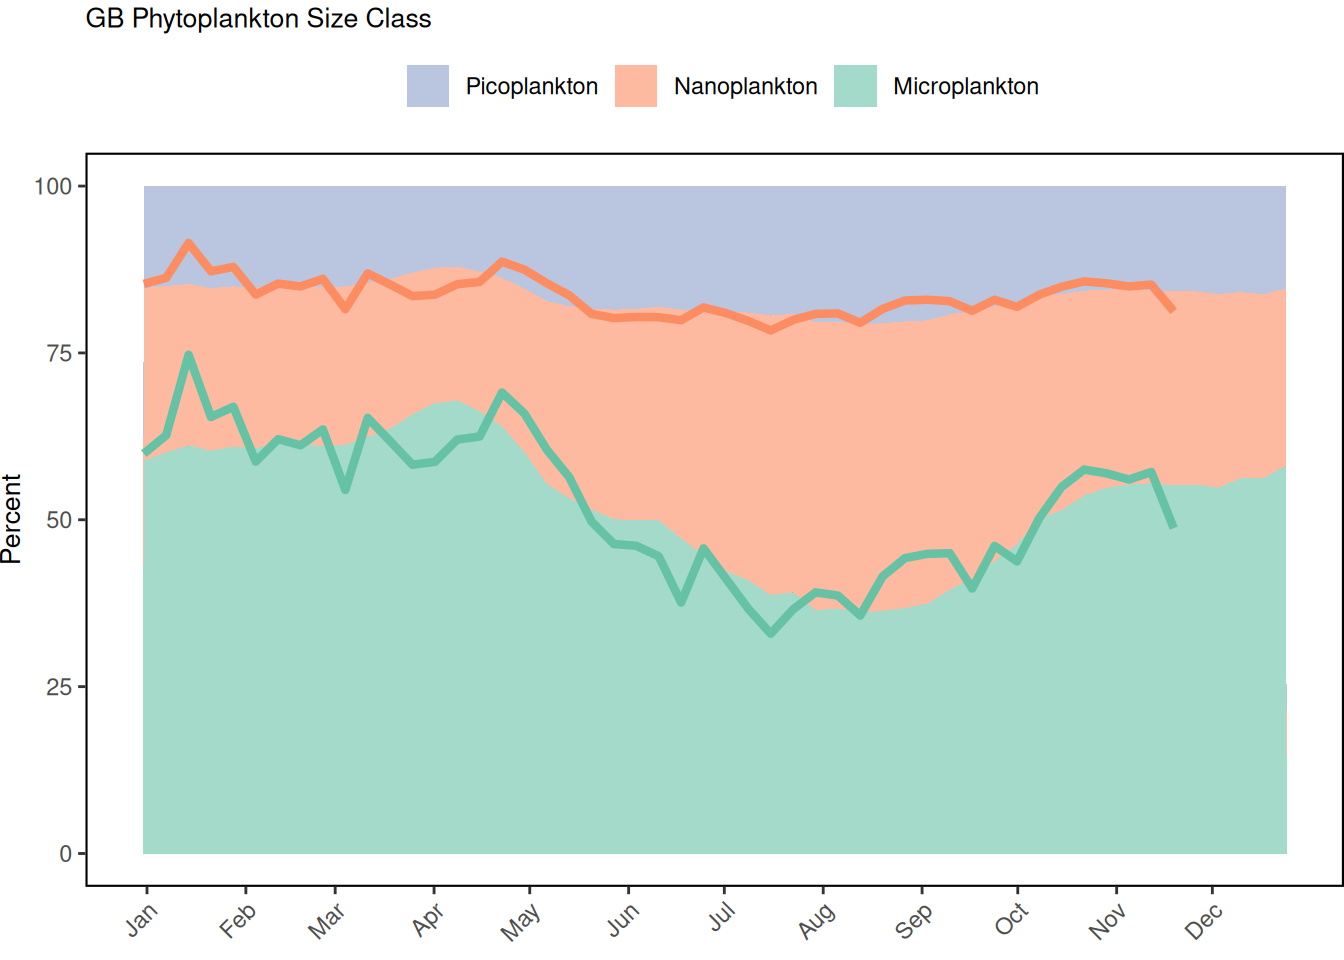
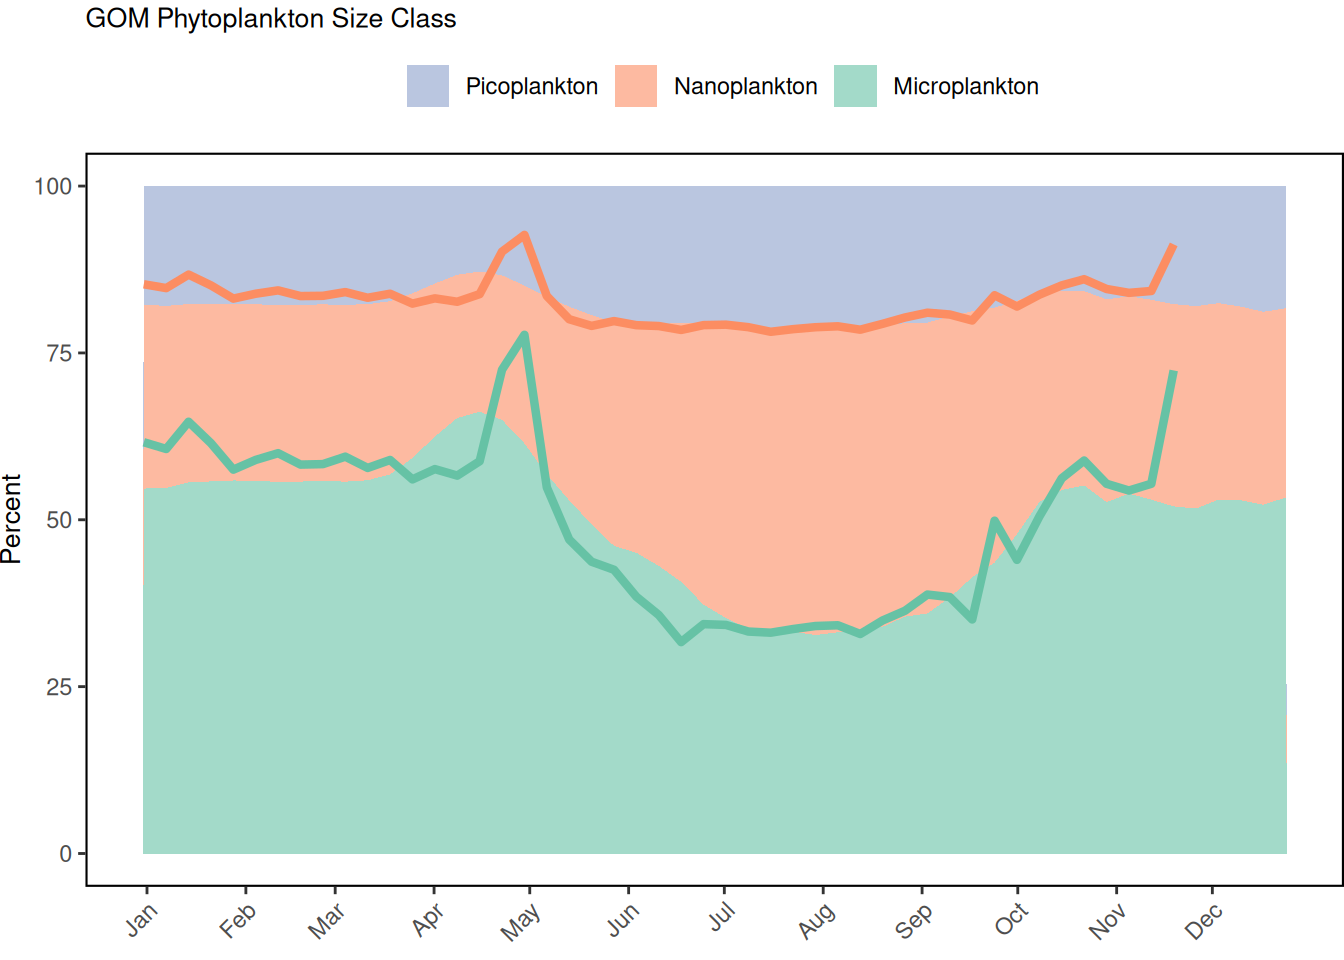
The seasonal cycles of phytoplankton size distribution are typically dominated by larger-celled microplankton (> 20 um) during the winter-spring and fall bloom periods, while smaller-celled nanoplankton (0.2-20 um) dominate during the warmer summer months. The smallest phytoplankton group, picoplankton (<0.2 um), represent the smallest fraction of the phytoplankton community in the region. Phytoplankton size class distributions were near average for most of the year, except during the early fall bloom.
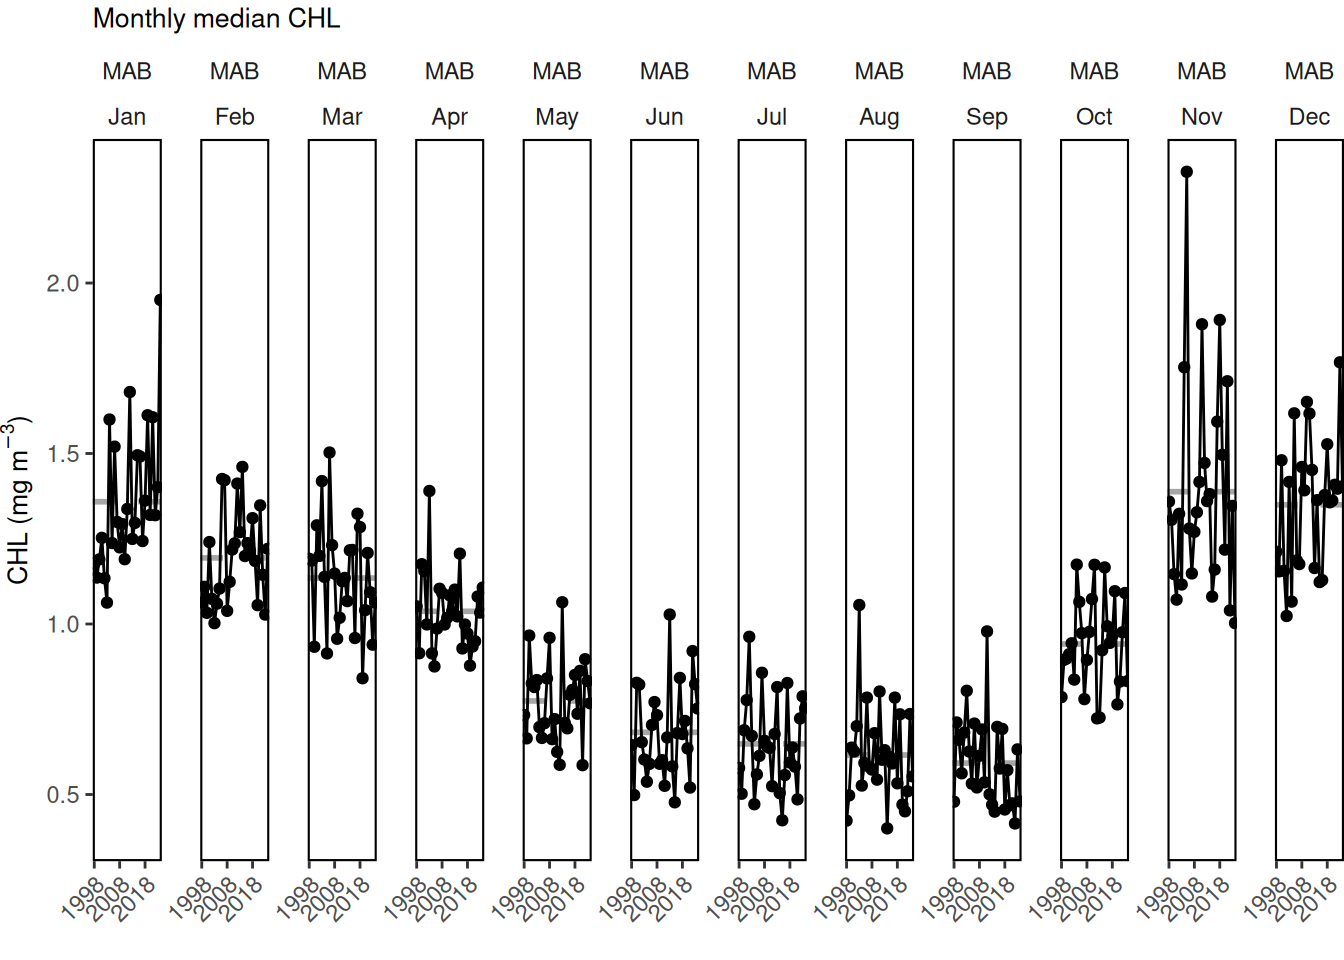
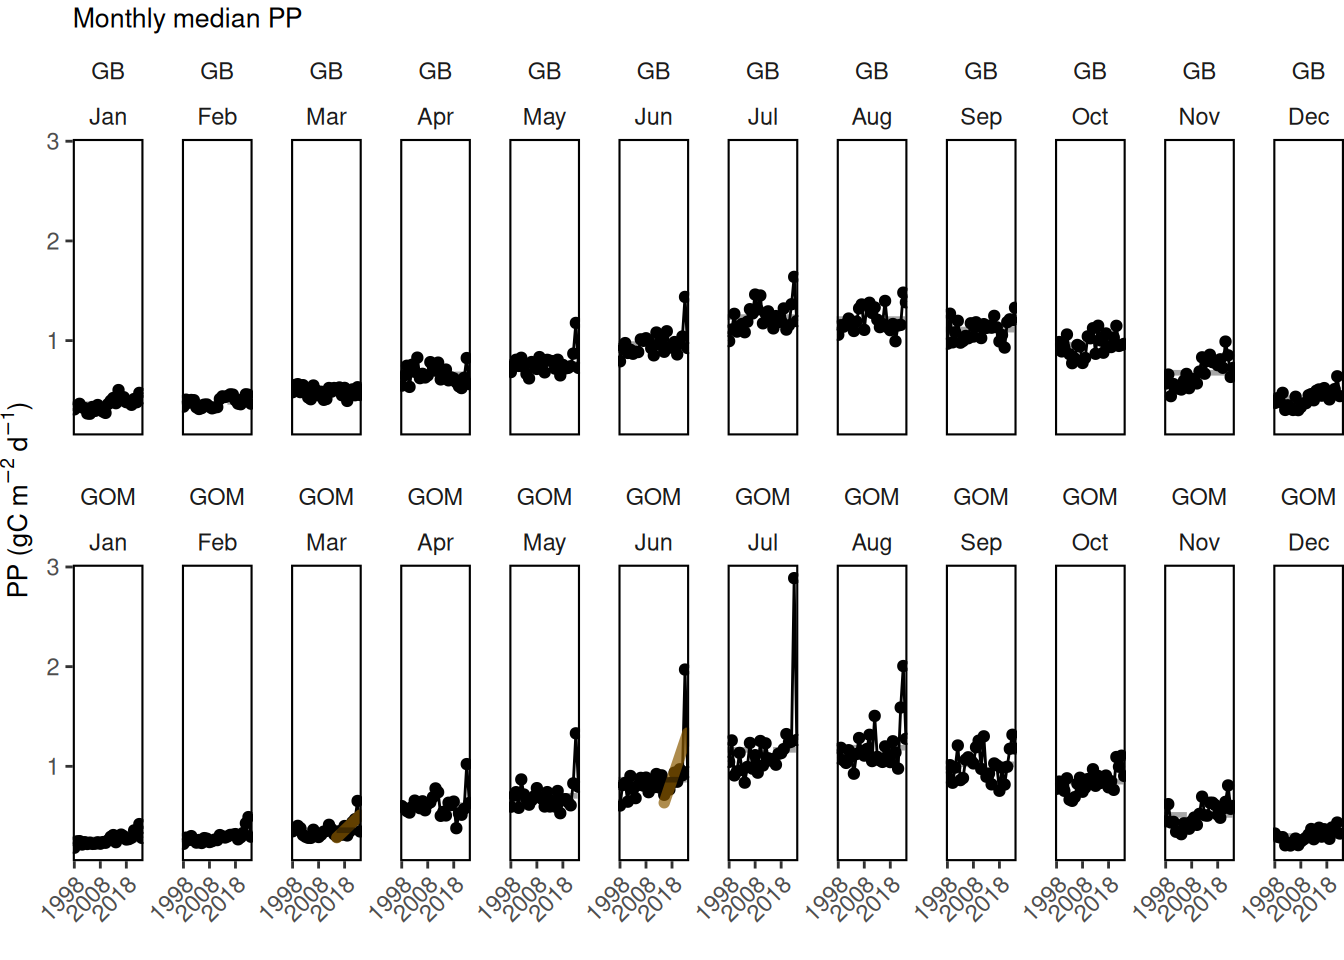
There is high interannual variability of the seasonal phytoplankton cycle. At the monthly scale, MAB chlorophyll and primary production are increasing during January, suggesting that the fall bloom period is extending into early winter. The significant decrease in MAB chlorophyll in September chlorophyll is likely related to warmer temperatures persisting into early fall and increased nutrient limitation. Fall and winter chlorophyll and primary production are increasing on Georges Bank and Gulf of Maine.
2.2.0.1 2025
Concentrations of chlorophyll a (a proxy for biomass) were below average during the winter-spring bloom periods in all regions. Fall bloom concentrations were above average on Georges Bank in late fall (November-December) and below average in the Gulf of Maine and Mid-Atlantic Bight. There was no evidence of atypical blooms such as the widespread Tripos muelleri bloom observed in 2023 or the 2024 coccolithophore bloom south of Long Island, New York. Primary productivity was at or below average for most of the year in all regions due to the below average phytoplankton biomass. Similarly, microplankton, which typically dominate during bloom periods, were also below average throughout most of the year. The one exception was above average concentrations on Georges Bank in the fall.
2.2.0.2 2024
Concentrations of chlorophyll a (a proxy for biomass) were above average during the winter-spring and fall bloom periods in all regions. There was no evidence of a repeat of the widespread Tripos muelleri bloom observed in 2023. There was, however, an atypical localized coccolithophore bloom south of Long Island, New York in late June to early July. Mid-Atlantic primary production peaked in early summer in 2024 and was above average in late fall, which is attributed to the above average late fall bloom. Georges Bank fall productivity was also above average due to the abnormally large fall phytoplankton bloom. Conversely, the Gulf of Maine spring bloom accounted for the largest above average spike in that region. The 2024 phytoplankton size class distribution was near the seasonal climatology in all regions except during the above average phytoplankton bloom periods.
#> [1] "Size plots are only available for the weekly scale."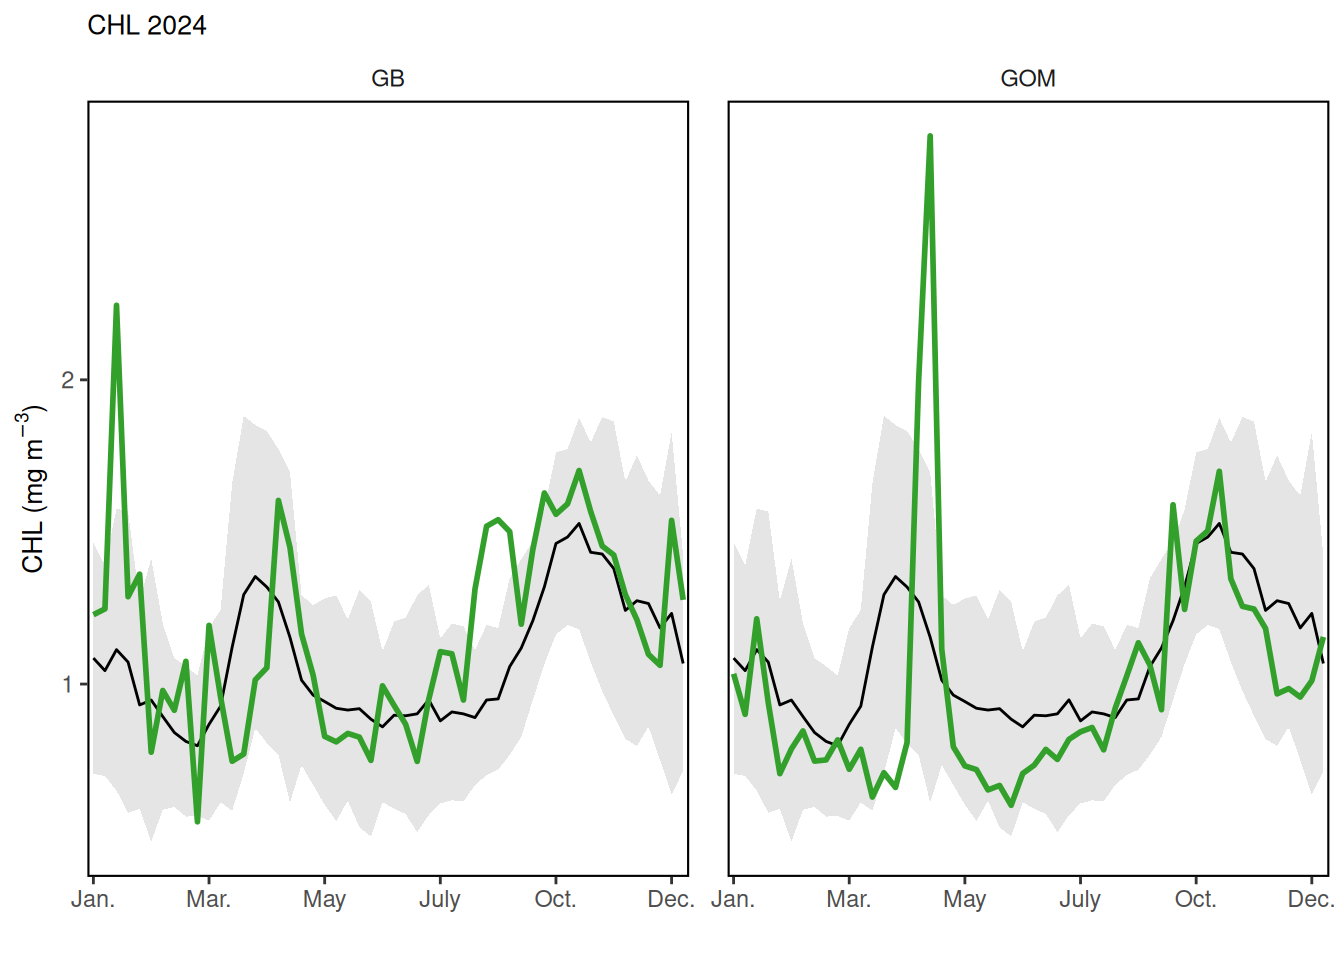


#> [1] "Size plots are only available for the weekly scale."
#> [1] "Size plots are only available for the weekly scale."2.3 Indicator statistics
Spatial scale: By EPU and gridded for the entire shelf
Temporal scale: Daily, weekly, monthly, annual, climatology (1998 to 2020)
Synthesis Theme:
2.4 Implications
Phytoplankton abundance, productivity, diversity, cell size, phenology, and carbon fluxes are regulated by the local physical and chemical environment and grazing. Interannual and climatological changes in temperature, freshwater inputs (due to ice sheet melting and/or enhanced river discharge), wind direction, and wind speed can alter the circulation patterns, upwelling conditions, and nutrient fluxes, directly affecting the timing, location, species composition of phytoplankton blooms in the NES. As the NES responds to warming, changing phenologies, changing chemistry, and changes in circulation patterns, we must understand how varying biophysical interactions control phytoplankton and subsequently affect fisheries, their habitats and the people, businesses and communities that depend on them.
2.5 Get the data
Point of contact: kimberly.hyde@noaa.gov
ecodata name: ecodata::chl_pp
Variable definitions
- Chlorophyll; Concentration of chlorophyll a in the near surface (first euphotic depth) waters; mg m^-3
- Chlorophyll anomaly; Ratio of chlorophyll a concentration to the long-term (1998 to present year) climatology; unitless (ratio)
- Primary productivity; Daily net primary production of biomass expressed as carbon per unit volume in seawater per day; gCarbon m^-2 d^-1
- Primary productivity anomaly; Ratio of net primary production to the long-term (1998 to present year) climatology; unitless (ratio)
- Microplankton chlorophyll; Concentration of chlorophyll a in the near surface (first euphotic depth) waters from the microplankton (20-200 µm) fraction; mg m^-3
- Nanoplankton chlorophyll; Concentration of chlorophyll a in the near surface (first euphotic depth) waters from the nanoplankton (2-20 µm) fraction; mg m^-3
- Picoplankton chlorophyll; Concentration of chlorophyll a in the near surface (first euphotic depth) waters from the picoplankton (0.2-2 µm) fraction; mg m^-3
- Annual summed primary production - TBD
Indicator Category:
Indicator Category:
Publicly available satellite data that are processed and analyzed
2.7 Accessibility and Constraints
No response
tech-doc link https://noaa-edab.github.io/tech-doc/chl_pp.html