55 Thermal Habitat Area
Description: Calculates the proportion of each EPU that exceeds temperature thresholds as a daily time series from 1993 – 2025
Indicator family:
Contributor(s): Joe Caracappa
Affiliations: NEFSC
55.1 Introduction to Indicator
See “Thermal Habitat Gridded” for cell-based calculations. Many deep water benthic and demersal species exhibit thermal preferences for metabolic, reproductive, and growth processes. Temperatures above these thermal preferences may impair these processes. This analysis assesses the thermal habitat available within a region and depth range from 0.5 to 30 °C at 0.5 °C increments. Thermal habitat area is calculated by identifying 1/12 degree cells within a given EPU that are greater than or equal to the temperature threshold then taking the sum of all cell areas. Data from 1993-01-01 to 2025-12-31 were obtained from the CMEMS’ GLORYS12V1 global reanalysis product. This indicator was expanded from a working paper for the 2025 Atlantic Sea Scallop Research Track. This indicator is also available as annual means using the same methods under ecodata::thermal_habitat_area_annual.
55.2 Key Results and Visualizations
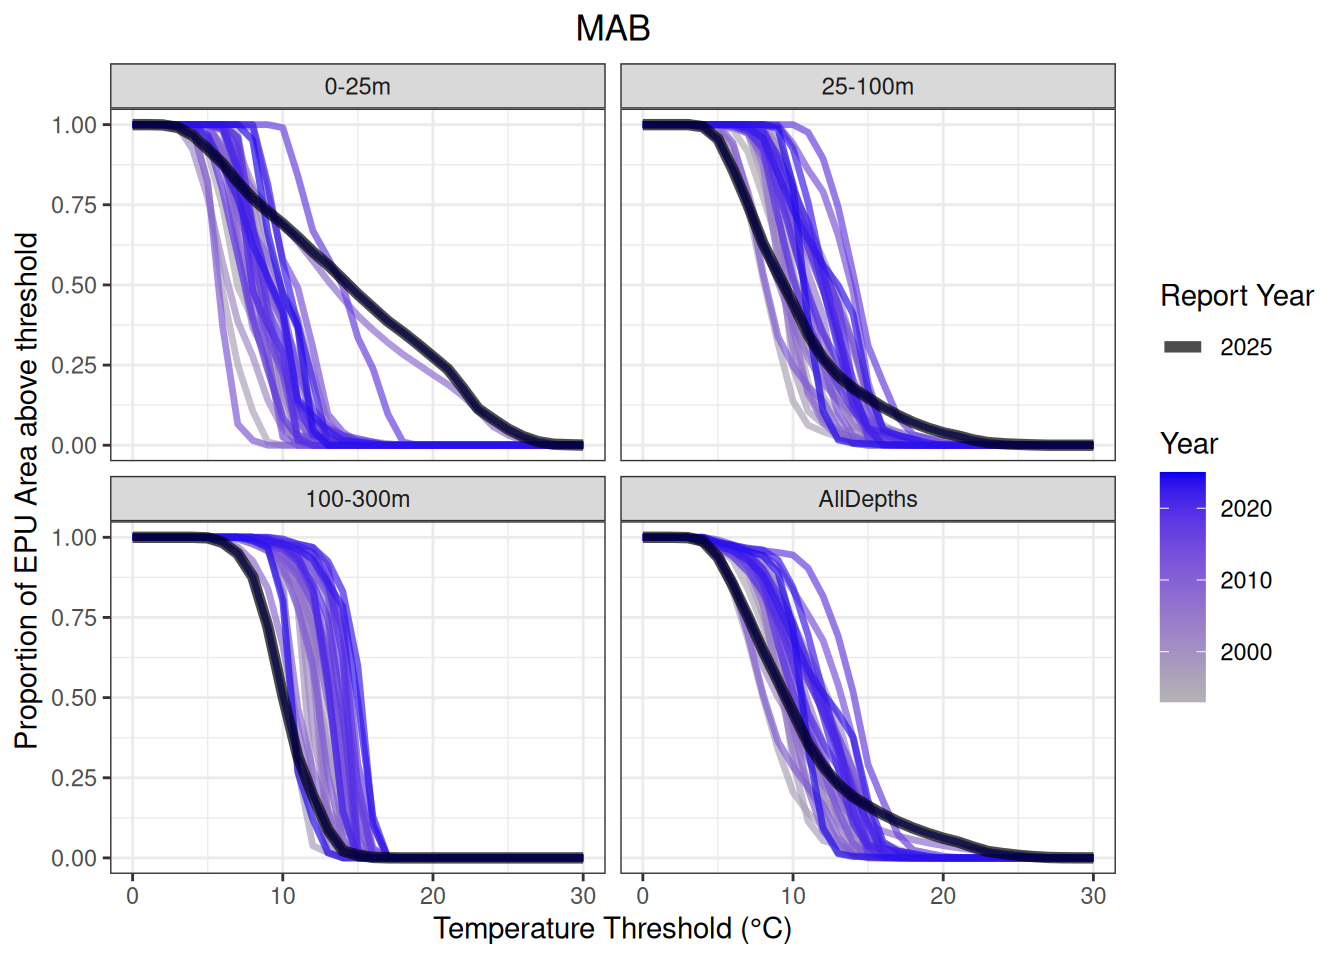
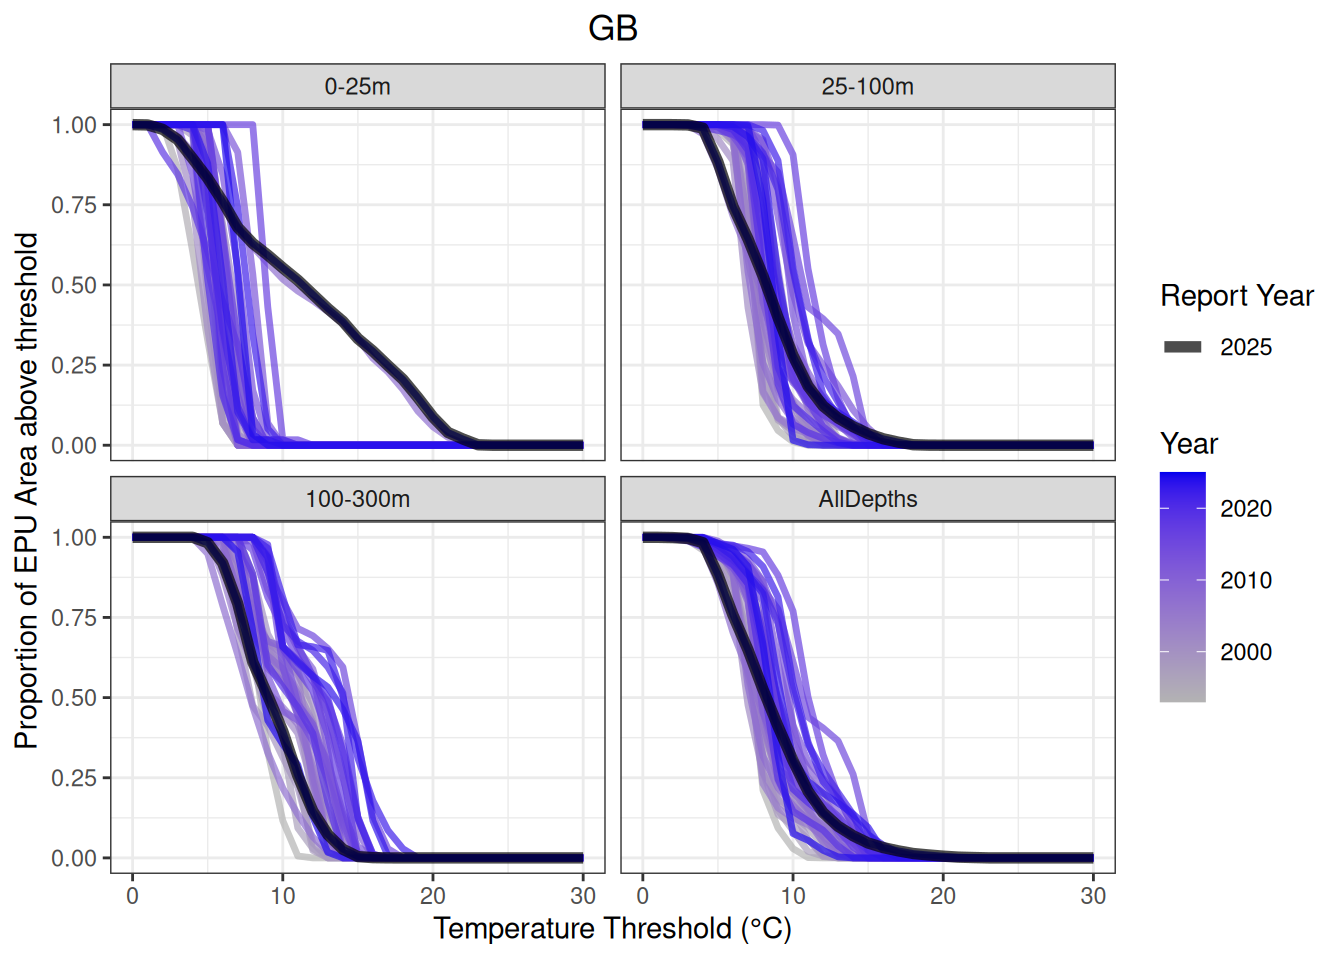
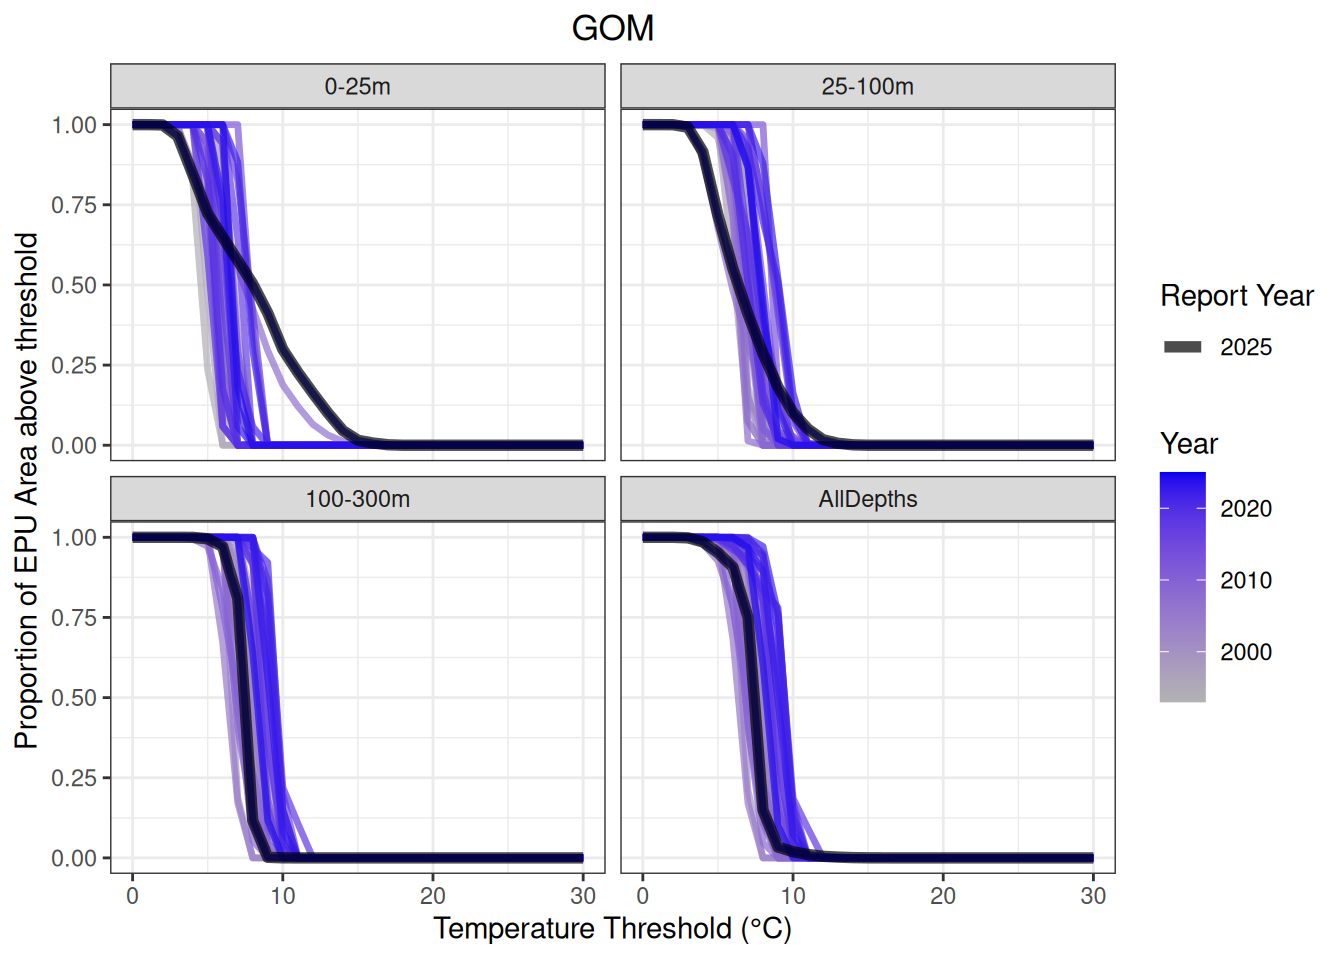
For each EPU, bottom temperature data were separated by depth bin (0-25m; 25m-100m; and >100m), as well as temperature threshold (0.5-30 °C), and the proportion of each EPU exceeding these thresholds was calculated on a daily basis from 1993 to 2025. Each year in the time series is plotted as a separate line showing the suitable thermal habitat profile for that year. The current year is highlighted in black. Generally the MAB is warmer, so these curves are shifted to the right compared to GB and the GOM. The unusually cold conditions in 2024 and 2025 are shown by leftward shifts in temperature profiles compared to previous years. However, since 2024, the profiles for shallow areas show a flattening in the mid temperature ranges, indicating that a larger area was warmer than normal and potentially unsuitable for some species.
55.4 Implications
If a large proportion of species current habitat become thermally inhospitable, it can influence species’ productivity and in, extreme cases, cause mortality. Monitoring the shape of these thermal suitability profiles can help identify areas that could influence temperature-sensitive species.
55.5 Get the data
Point of contact: joseph.caracappa@noaa.gov
ecodata name: ecodata::thermal_habitat_area
Variable definitions
Time: year EPU: EPU name Depth: Depth category Var: Temperature Category Value: Proportion of area above temp.threshold
Source: GLORYS (CMEM’s GLORYS12V1 global reanalysis bottom temperature) temp.threshold: numeric temperature category Units: Proportion
Indicator Category:
55.7 Accessibility and Constraints
No response
tech-doc link https://noaa-edab.github.io/tech-doc/thermal_habitat_area.html