21 Spawning Timing
Description: Maturity information for groundfish is used to evaluate changes in spawning seasonality. Haddock and yellowtail flounder are included in this indicator.
Indicator family:
Contributor(s): Mark Wuenschel
Affiliations: NEFSC
21.1 Introduction to Indicator
Spawning phenology, the annual timing of reproduction, determines when spawning occurs and is therefore important to understanding individual fish energetics and condition, as well as the timing and location of release of eggs. Fish undergo seasonal (annual) patterns of weight gain and loss related to spawning. In some extreme cases, gonad weight can be > 30% body weight, therefore estimates of fish condition based on fish weight can be influenced by reproductive state. Thus, shifts in survey timing and/or spawning seasonality over time could produce changes in calculated weight based condition indices.
Maturity data collected on NEFSC bottom trawl surveys were evaluated to determine spawning seasonality for haddock and yellowtail flounder, and to investigate if this may have changed over the available time series of data.
These indicators were presented as working papers to the haddock and yellowtail flounder assessment working groups, and text from those working papers is reproduced here.
21.2 Key Results and Visualizations
The spring bottom trawl survey (SBTS) generally occurs during the spawning season, capturing a mix of developing (spawning capable phase, sensu [39]), ripe (spawning active phase), spent (regressing phase), and resting (regenerating phase) individuals.
Georges Bank and Gulf of Maine haddock
The mean size of mature females sampled has declined over the time series. The time series indicates a greater proportion of post spawning fish collected at higher temperatures more recently. Although the dates sampled were similar early and late in the time series, the temperatures occurring on these dates were higher late in the time series. Spawning condition was related to bottom temperature, with samples from higher temperatures having a lower proportion of spawning active fish. Similarly, the proportion of spawning active fish declined with week of year sampled. Together, these declines in spawning activity as temperature and week of year sampled increases, indicate that the spring survey captures the peak to end of annual spawning depending on the year.
When summarized by decade, the most recent decade (2010s) sampled fish at slightly warmer temperatures and had a higher percentage of resting fish as compared to the 1970s to 2000s. Sampling has also occurred later into the spring in the recent decade (2010s) and has included fewer spawning active fish (indicated by developing and ripe fish) as compared to the 1970s to 2000s that rarely sampled beyond week 18 in Georges Bank and week 20 in the Gulf of Maine.
CC GOM Yellowtail Flounder
The mean size of mature females sampled slightly declined early the time series. The time series indicates a lower proportion of post spawning fish collected at higher temperatures more recently. Although the dates sampled were similar early and late in the time series, the temperatures occurring on these dates was higher late in the time series. Spawning condition was related to bottom temperature, with samples from higher temperatures having a lower proportion of prespawning fish. The proportion of spawning fish increased with week of year sampled. Together, these increases in prespawning and spawning fish as temperature and week of year sampled increases, indicate that the spring survey captures the peak to end of annual spawning depending on the year.
When summarized by decade, the most recent decades (2010s-2020s) sampled fish at slightly warmer temperatures and had a lower percentage of resting fish as compared to the 1970s to 2000s. Sampling has also occurred later into the spring in the recent decades (2010s-2020s) but has collected slightly higher proportions of prespawning and spawning fish combined 1970s to 2000s that had few observations beyond week 18.
The multinomial model indicated significant effects of bottom temperature, week of year, and decade on the probability of individual females being in a prespawning, spawning, or postspawning condition. Pattern of increasing spawning and postspawning and decreasing prespawning with both week of year and temperate was evident. The pattern by decade indicated an increase in prespawning and decrease in postspawning groups after 2000; however, data is limited for the most recent decade. The increase in prespawning fish through time indicates sampling has shifted from the beginning or early portion of the spawning season up to the 1990s to occurring closer to the peak of the spawning season since 2000.
Georges Bank Yellowtail Flounder
The mean size of mature females sampled varied over the time series. The time series indicates a similar proportion of post spawning fish collected at higher temperatures more recently. Although the dates sampled were similar, early and late in the time series, with a few exceptions, the temperatures occurring on these dates was higher late in the time series. Spawning condition was related to bottom temperature, with ripe fish declining at temperatures above 8 C, spent fish increasing with temperature, but little change in developing and resting fish over the range of temperatures. The proportion of developing fish decrease, while ripe, spent and resting fish increased with week of year sampled. Together, these increases in prespawning and spawning fish as temperature and week of year sampled increases, indicate that the spring survey captures the peak to end of annual spawning depending on the year.
When summarized by decade, for the most recent decades no clear patterns in the proportion of developing fish were evident, however more spent fish were encountered in the in the recent decades since 2000. Sampling has also occurred later into the spring in the recent decades (2010s-2020s) and has collected slightly higher proportions of spent and resting fish sampled at later weeks compared to the period from the 1970s to 2000s that had few observations beyond week 17.
The multinomial model indicated significant effects of bottom temperature, week of year, and decade on the probability of individual females being in a prespawning, spawning, or postspawning condition. A pattern of increasing spawning and postspawning and decreasing prespawning with week of year was evident. Bottom temperature had the reverse effect, with increasing prespawing fish but decreasing spawning and spawning fish as temperature increased. The pattern by decade indicated relatively minor changes in the predicted probability of each spawning group over time, and sampling has consistently occurred close to the peak spawning period.
Southern New England Yellowtail Flounder
The mean size of mature females sampled varied over the time series. The time series indicates a higher proportion of ripe fish collected early and late in the time series. The dates sampled have varied over time, with later sampling occurring 1977-1982, and more recently. The bottom temperatures showed a similar pattern for the recent period, however for the earlier period sampled late in the year, the water temperatures were much lower. Spawning condition was related to bottom temperature, with ripe fish increasing at temperatures above 5 °C, spent fish increasing with temperature, developing fish decreasing and resting fish increasing over this range. At lower temperatures, the patterns were reversed, but there were fewer observations. The proportion of developing fish decreased, while ripe, spent and resting fish increased with week of year sampled. Together, these increases in spawning and postspawning fish as temperature and week of year sampled increases, indicate that the spring survey captures the peak to end of annual spawning depending on the year.
When summarized by decade, the most recent decades indicate higher proportions of developing fish with subsequent declines in ripe fish compared to the earliest decade, however only a single mature female was sampled in the most recent decade. Sampling has also occurred during similar weeks (1970s-2010s) and has collected slightly higher proportions of spent and resting fish sampled in the 1990s at warmer temperatures.
The multinomial model indicated significant effects of bottom temperature, week of year, and decade on the probability of individual females being in a prespawning, spawning, or postspawning condition. Pattern of increasing postspawning and decreasing spawning and prespawning with week of year was evident. The effect of bottom temperature differed, with increasing spawing and postspawning fish but decreasing prespawning fish as temperature increased. The pattern by decade indicated an increase in prespawning and decrease in spawning from the 1970s to 1990s, with little change since (ignoring the most recent decade, which is represented by a single fish). In the late 1970s and early 1980s SNE samples were collected later in the spring and contained large numbers of ripe fish, in the peak of spawning. From the mid-1980s to 2010 sampling occurred earlier and collected mostly prespawning fish.

#> [1] "This is a shelfwide indicator only used in the MidAtlantic report"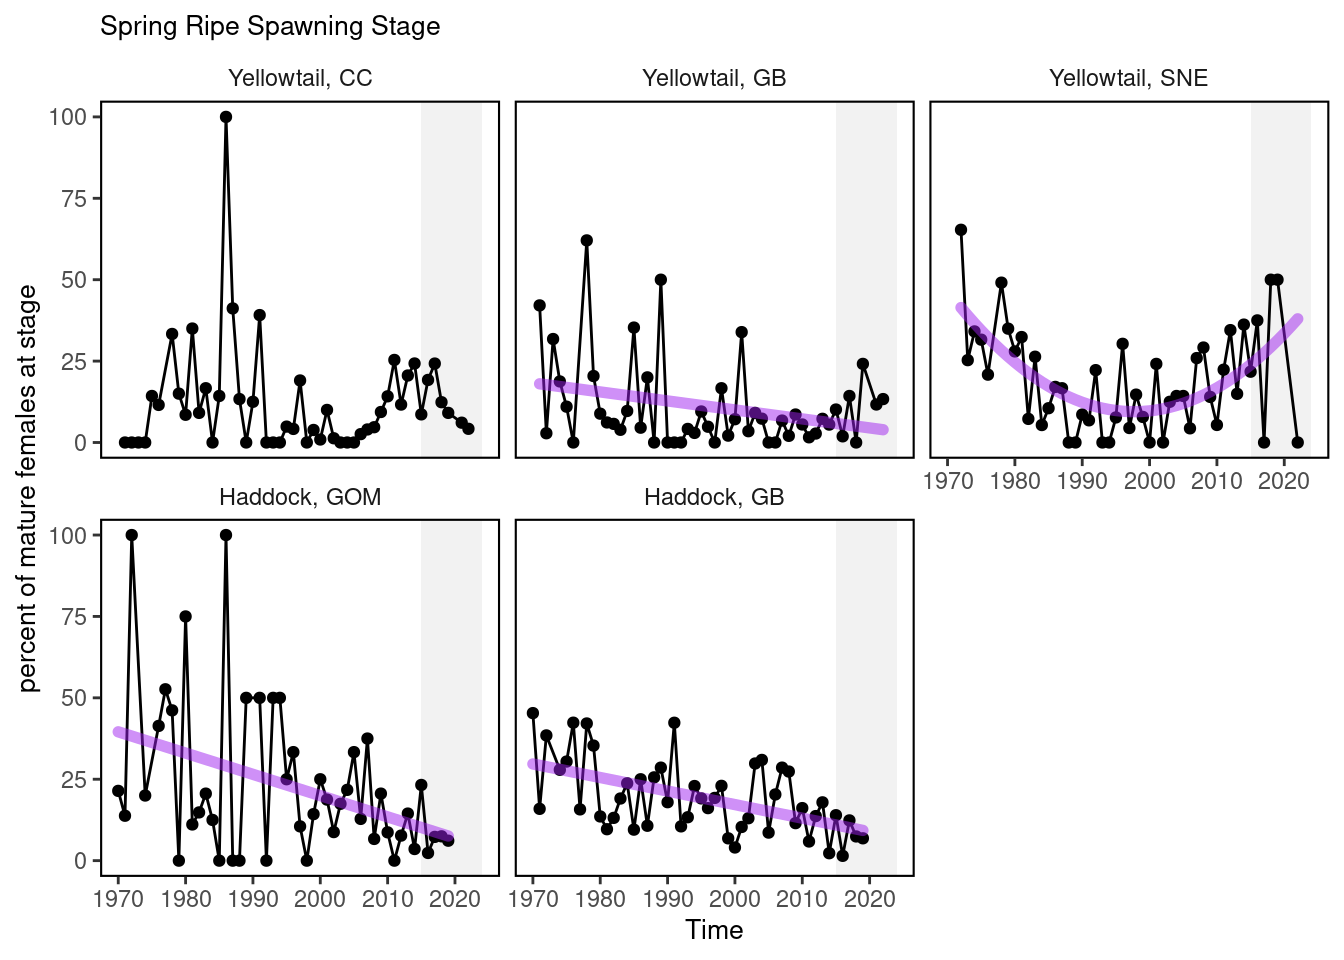
#> [1] "This is a shelfwide indicator only used in the MidAtlantic report"
#> [1] "This is a shelfwide indicator only used in the MidAtlantic report"
#> [1] "This is a shelfwide indicator only used in the MidAtlantic report"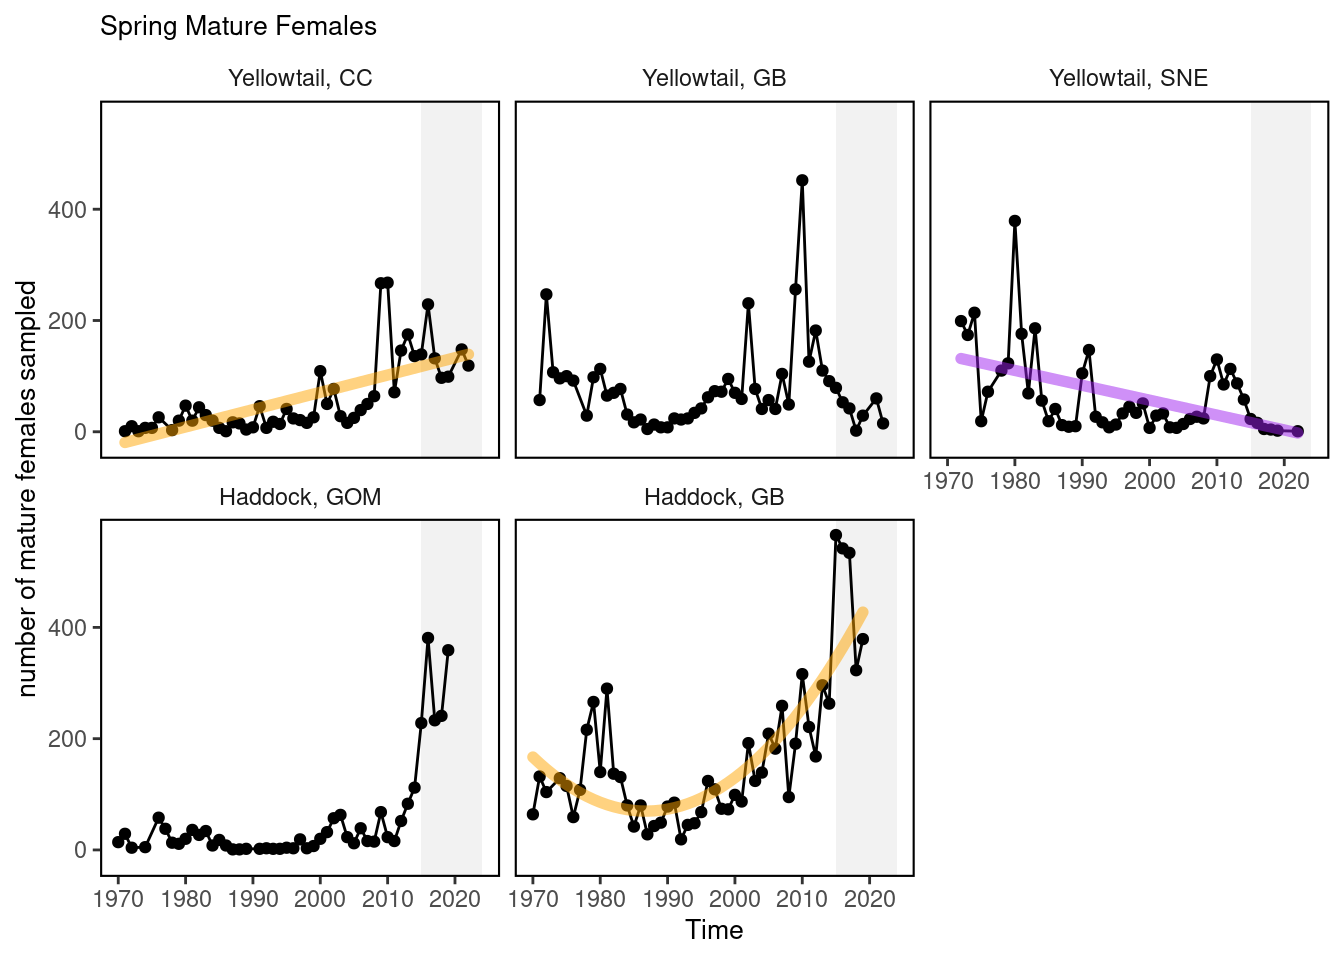
#> [1] "This is a shelfwide indicator only used in the MidAtlantic report"
#> [1] "This is a shelfwide indicator only used in the MidAtlantic report"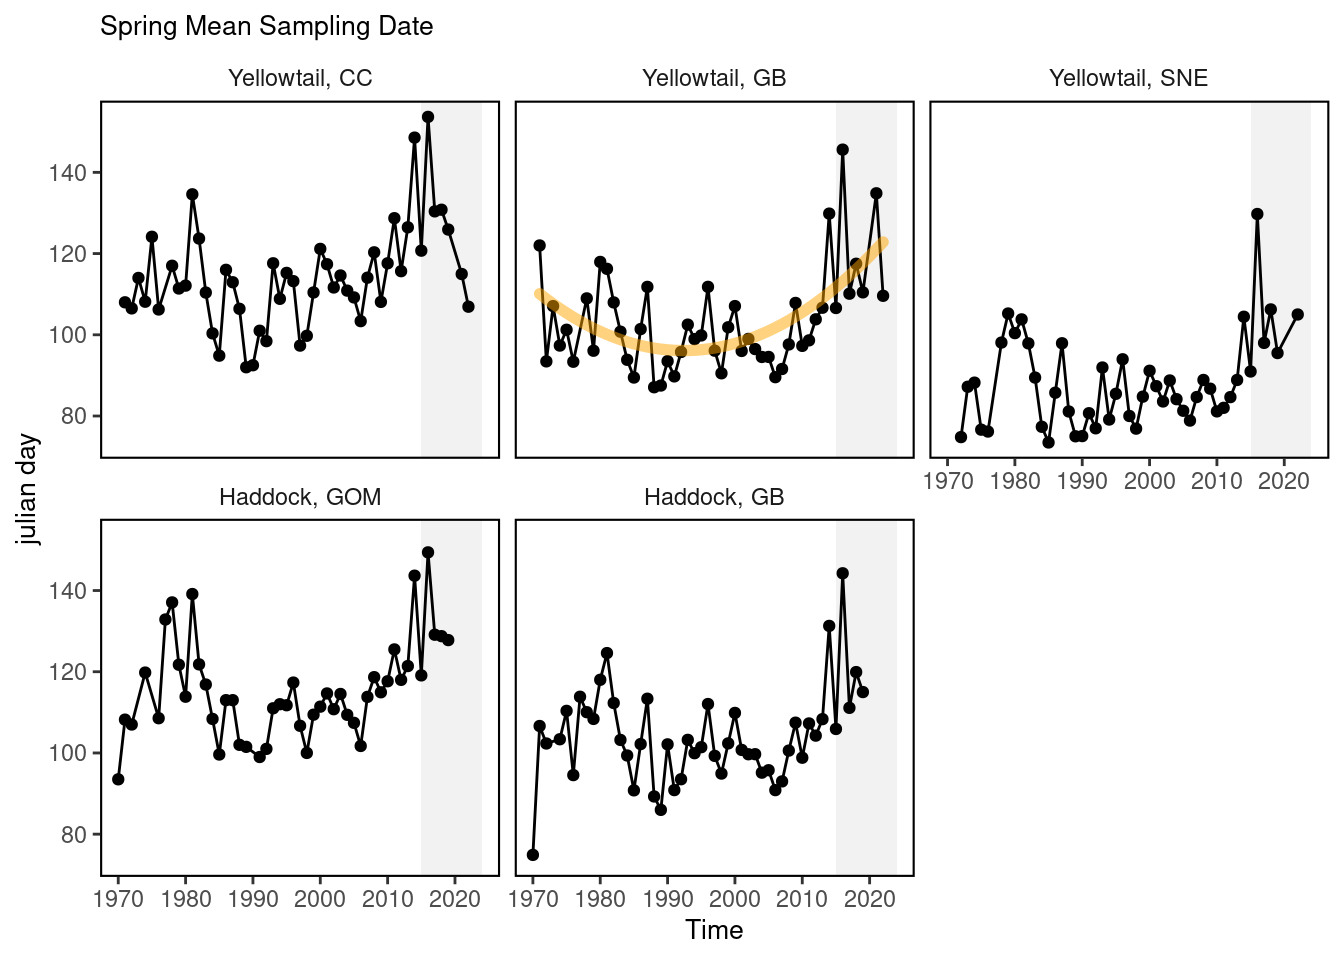
#> [1] "This is a shelfwide indicator only used in the MidAtlantic report"21.3 Indicator statistics
Spatial scale: Stock-specific spatial scale
Temporal scale: Spring and Fall
Synthesis Theme:
21.4 Implications
Spawning timing is shifting earlier for multiple stocks, including haddock and yellowtail flounder. Spawning of both haddock stocks occurred earlier in the year (and ended earlier, as indicated by more resting (post-spawning) stage fish, in the 2010s as compared to earlier in the time series. Yellowtail flounder spawn late spring-summer, with timing varying by stock location. The northern (CC/GOM) stock shows earlier active spawning in recent years with a decline in pre-spawning resting females. Both GB and SNE stock are sampled during active spawning (low percent resting). The recent increase in resting females in the southern (SNE) stock also indicates a shift to earlier spawning (i.e. more post-spawn fish). Yellowtail flounder spawning is related to bottom temperature, week of year, and decade sampled for each of the three stocks.
Haddock spawn during the late winter-spring months in the region, with the spring survey sampling fish in the latter portion of the spawning season (peak to end). There is evidence that spawning of both haddock stocks occurred earlier in the year (and ended earlier) in the recent decade (2010s) as compared to earlier in the time series. Recent spring surveys have sampled a greater proportion of post spawning fish. The post spawning haddock would be expected to have lower relative condition due to shedding of gametes, depletion of liver (used for oocyte development and maturation), and higher water content of muscle and liver tissue, as has been reported in cod ([40]) and flatfishes ([41]). Some fishes also reduce or cease feeding during spawning, for behavioral or physical (gonad occupying most of the body cavity) reasons. The annual cycle of energy acquisition, storage, and depletion is lowest immediately following spawning in capital breeders such as haddock ([42]). Trippel and Neil [43] estimated female weight loss associated with spawning to be 24.1% in a laboratory study of haddock. Although the reduction in weight and condition due to spawning is temporary, comparisons of relative condition (weight at length) across years that sampled varying proportions of active and post spawning fish (whether due to spawning timing or survey timing) should be considered with caution. The results presented for mature females should be applicable to mature males as well, but immature fish of both sexes will not undergo weight loss due to spawning. Therefore comparison of condition in proximity to spawning season across years that contain varying proportions of immature and mature fish will also be problematic. Given the temporal separation from spawning, relative condition estimates derived from autumn surveys will be less influenced by alterations in timing of surveys or spawning season.
Yellowtail Flounder spawn during the spring months in the region, with the spring survey sampling fish during the spawning season. There is evidence that spawning condition is related to the bottom temperature, week of year, and decade sampled for each of the three stocks and survey timing and environmental conditions (bottom temperature) have been variable over time. The analysis of macroscopic data presented here provides some evidence for a change in the spawning season of CC GOM and SNE stocks. Early in the time series, sampling captured the beginning/early portion of spawning season, while later in the time series sampling has captured more of the peak in spawning. However, some caveats to this general conclusion are warranted. First, since Yellowtail Flounder are batch spawners, individuals cycle from developing, to ripe, to running ripe, and back to developing for each of many batches over a >1 month period. As such, the developing class includes a mix of individuals that have not released any batches yet (true prespawners) and others who are ‘in between batches (i.e. partially spent, but before a next batch). Gonadal histology and/or GSI data could help to refine categorization of these stages, but such data does not exist for the long time series presented. Second, the analysis by decadal timeblocks presented is a rather coarse approach to investigating long term trends in spawning condition. More appropriate methods should be explored and evaluated in future studies. Nevertheless, even with significant inter-annual variability, the approach presented should detect directional change in spawning seasonality over the time series. Subtle shifts to earlier spawning, accompanied by more individuals sampled later in their annual reproductive cycle (e.g. closer to spent), were evident in CC GOM and SNE stocks. Even small changes in spawning seasonality and/or sampling timing can affect the total weight of individuals sampled given the gonad of Yellowtail Flounder females can reach 35 % of their body weight ([44]), with the ovary declining in weight over a period of months as batches of eggs are shed. Therefore, consideration of spawning condition when interpreting fish weight and relative condition during the spring season should be considered. Although sampling was not specifically designed to detect changes in spawning seasonality of Yellowtail Flounder, the present analysis provides a preliminary evaluation of spawning timing over a long time series (1971-2023).
The post spawning Yellowtail Flounder would be expected to have lower relative condition due to shedding of gametes, depletion of liver (used for oocyte development and maturation), and higher water content of muscle and liver tissue, as has been reported in cod ([40]) and flatfishes ([41]). Some fishes also reduce or cease feeding during spawning, for behavioral or physical (e.g. gonad occupying most of the body cavity) reasons. The annual cycle of energy acquisition, storage, and depletion is lowest immediately following spawning in capital breeders such as haddock ([42]). Manning and Crim [45] estimated female weight loss associated with spawning to be 22-23% in a laboratory study of Yellowtail Flounder. Although the reduction in weight and condition due to spawning is temporary, comparisons of relative condition (weight at length) across years that sampled varying proportions of active and post spawning fish (whether due to spawning timing or survey timing) should be considered with caution. The results presented for mature females should be applicable to mature males as well, but immature fish of both sexes will not undergo weight loss due to spawning. Therefore, comparison of condition in proximity to spawning season across years that contain varying proportions of immature and mature fish will also be problematic. Given the temporal separation from spawning, relative condition estimates derived from autumn surveys will be less influenced by alterations in timing of surveys or spawning season.
21.5 Get the data
Point of contact: Mark Wuenschel mark.wuenschel@noaa.gov
ecodata name: ecodata::spawn_timing
Variable definitions
Variable names follow the convention “SEASON_Species_STOCK_Variable” where Variable and Units are: meanTEMP: mean sampled bottom temperature in degrees C MF: number of mature females sampled meanJDAY: mean julian day of year sampled Developing: percent of mature females at developing (pre-spawning) stage Ripe: percent of mature females at ripe (spawning) stage Spent: percent of mature females at spent (immediately post-spawning) stage Resting: percent of mature females at resting (non-spawning) stage
Indicator Category:
21.7 Accessibility and Constraints
No response
tech-doc link https://noaa-edab.github.io/tech-doc/spawn_timing.html