35 Bottom temperature - Seasonal Anomaly
Description: The data are seasonal bottom temperature anomaly time series for each EPU
Indicator family:
Contributor(s): Joseph Caracappa, Hubert du Pontavice, Vincent Saba, Zhuomin Chen
Affiliations: NEFSC
35.1 Introduction to Indicator
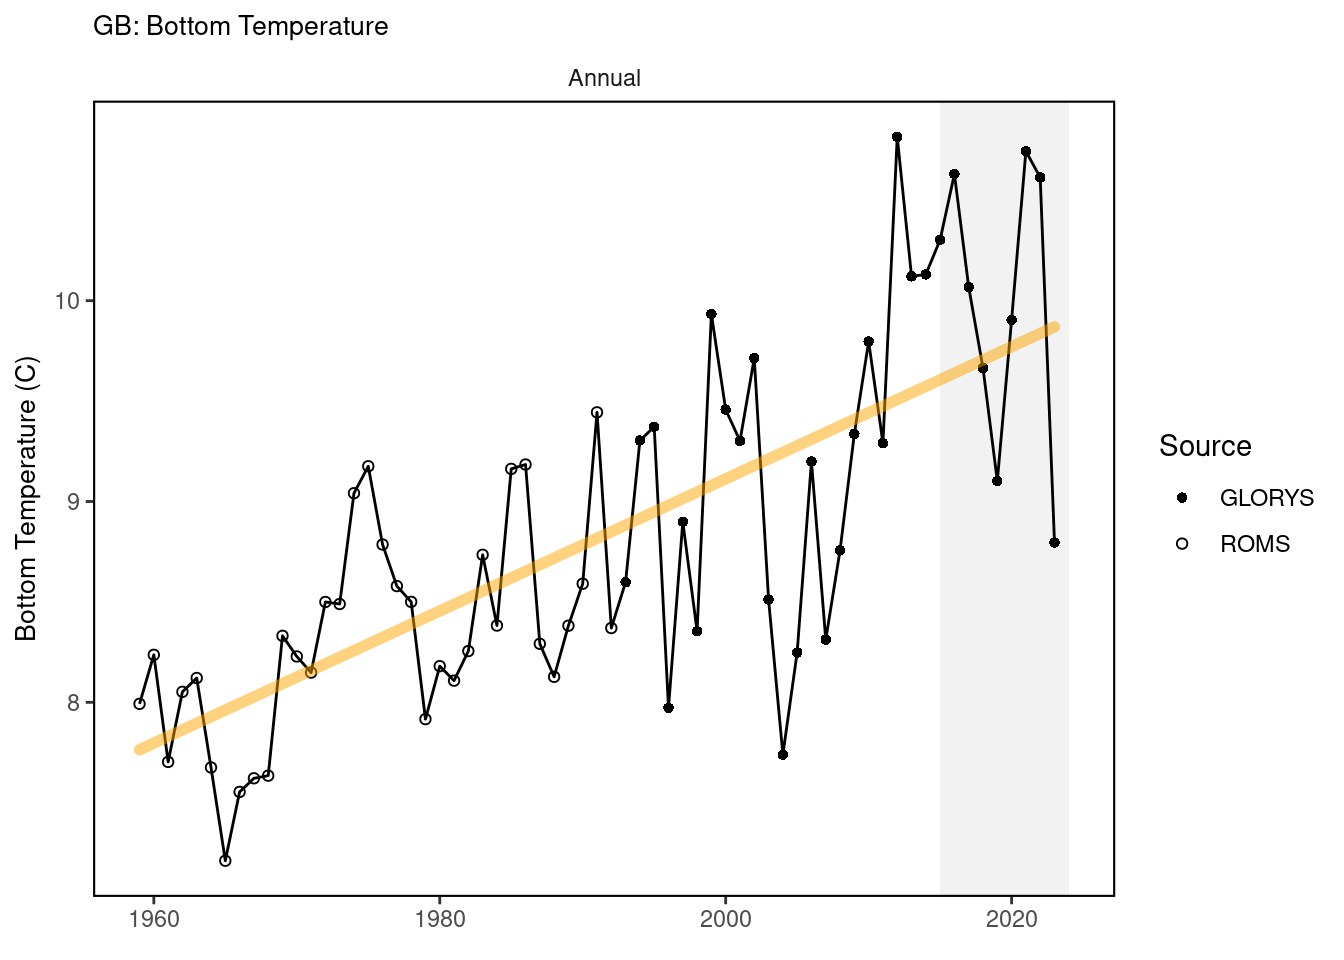
The raw bottom temperature product is in a horizontal 1/12 degree grid between 1959 and 2023 and is made of daily bottom temperature estimates from:
Bias-corrected ROMS-NWA (ROMScor) between 1959 and 1992 which was regridded in the same 1/12degree grid as GLORYS using bilinear interpolation; GLORYS12v1 in its original 1/12 degree grid between 1993 and 2023-08-29; and PSY in it’s 1/12 degree grid from 2023-08-29 to 2023-12-31.
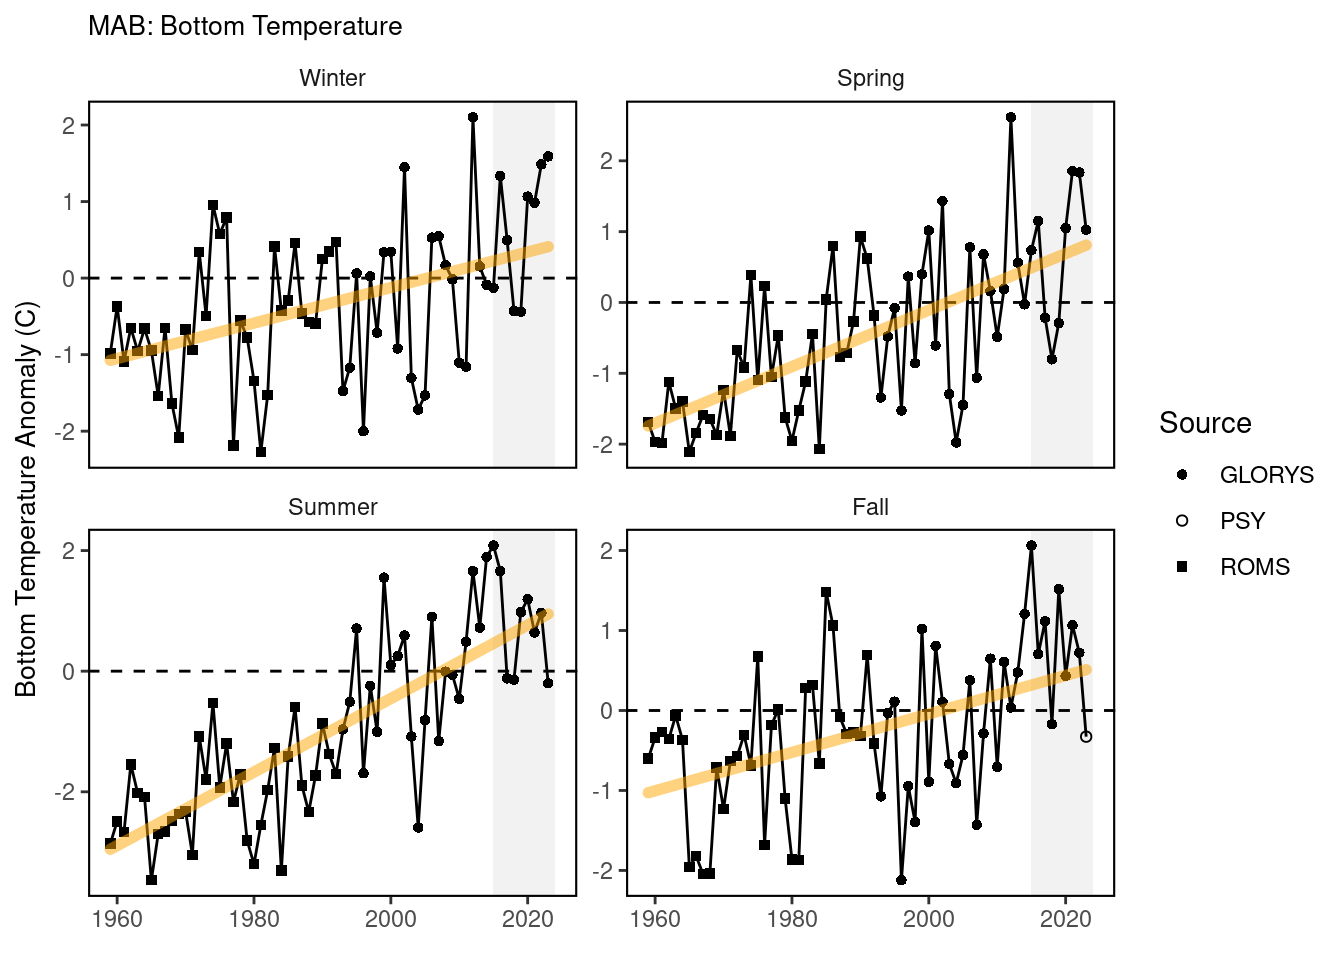
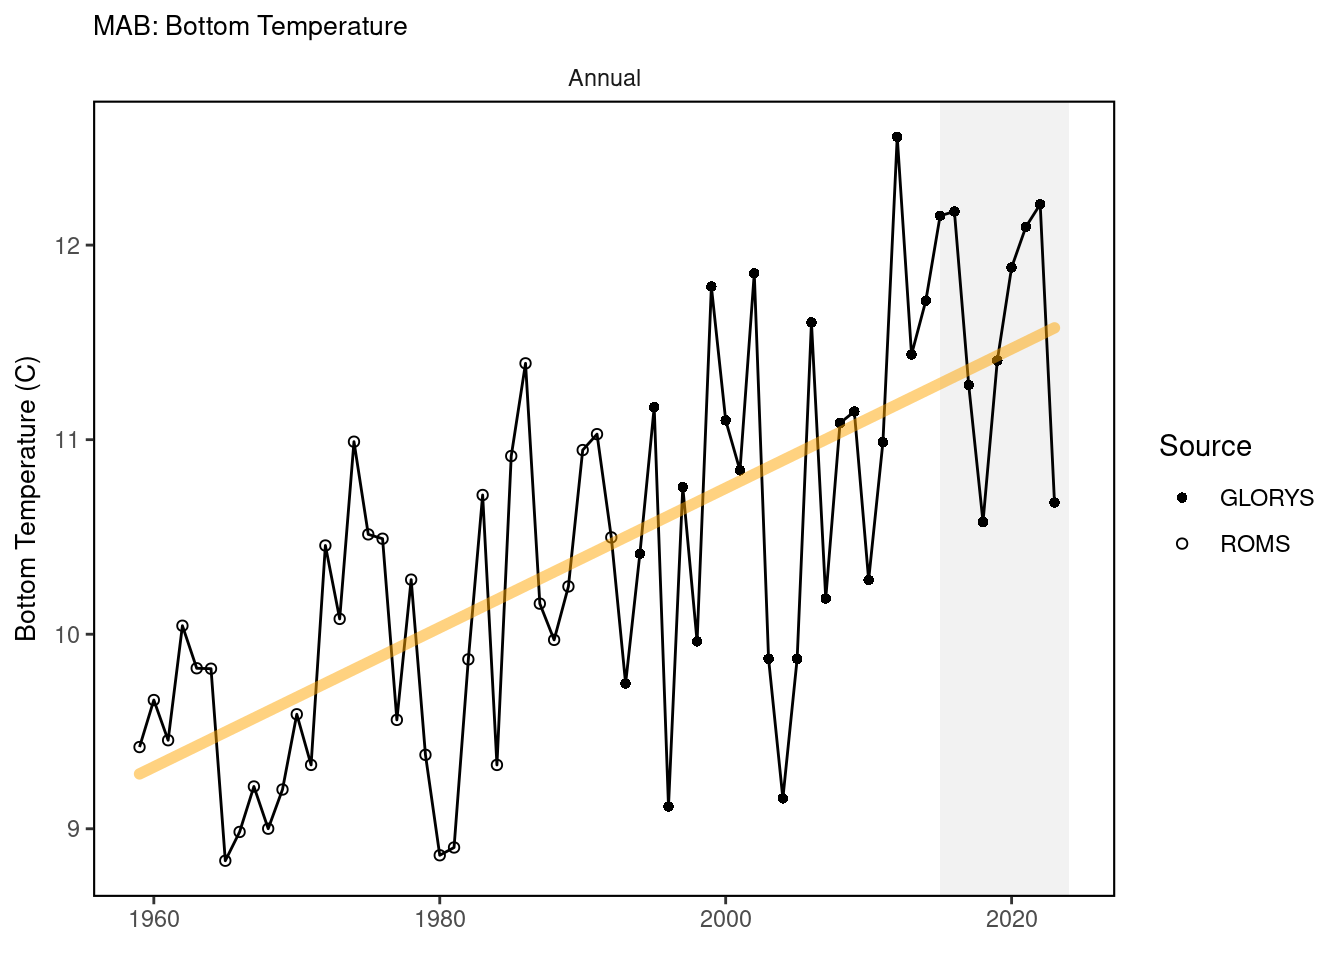
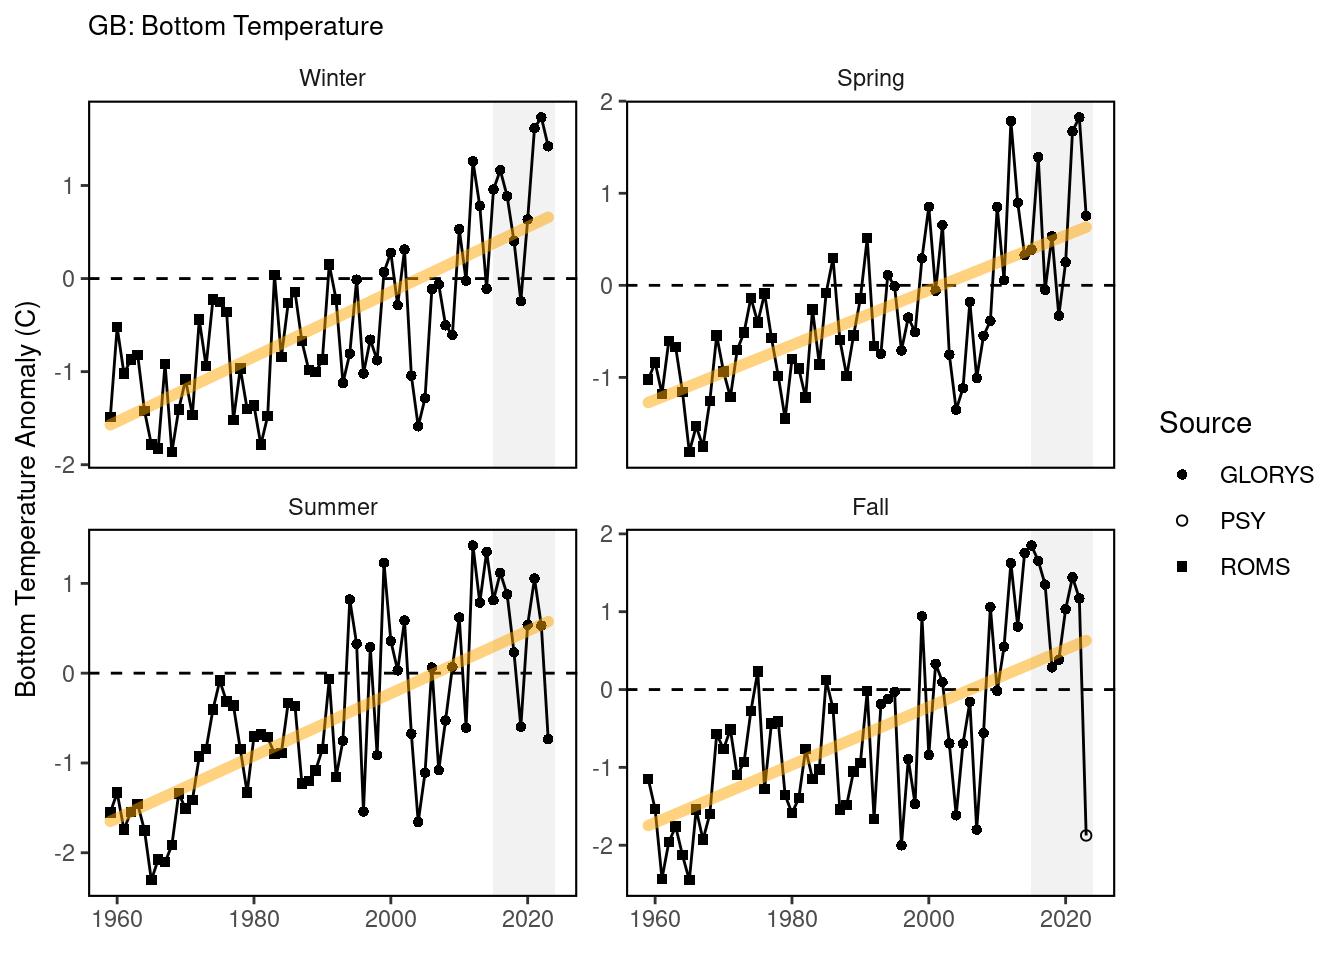
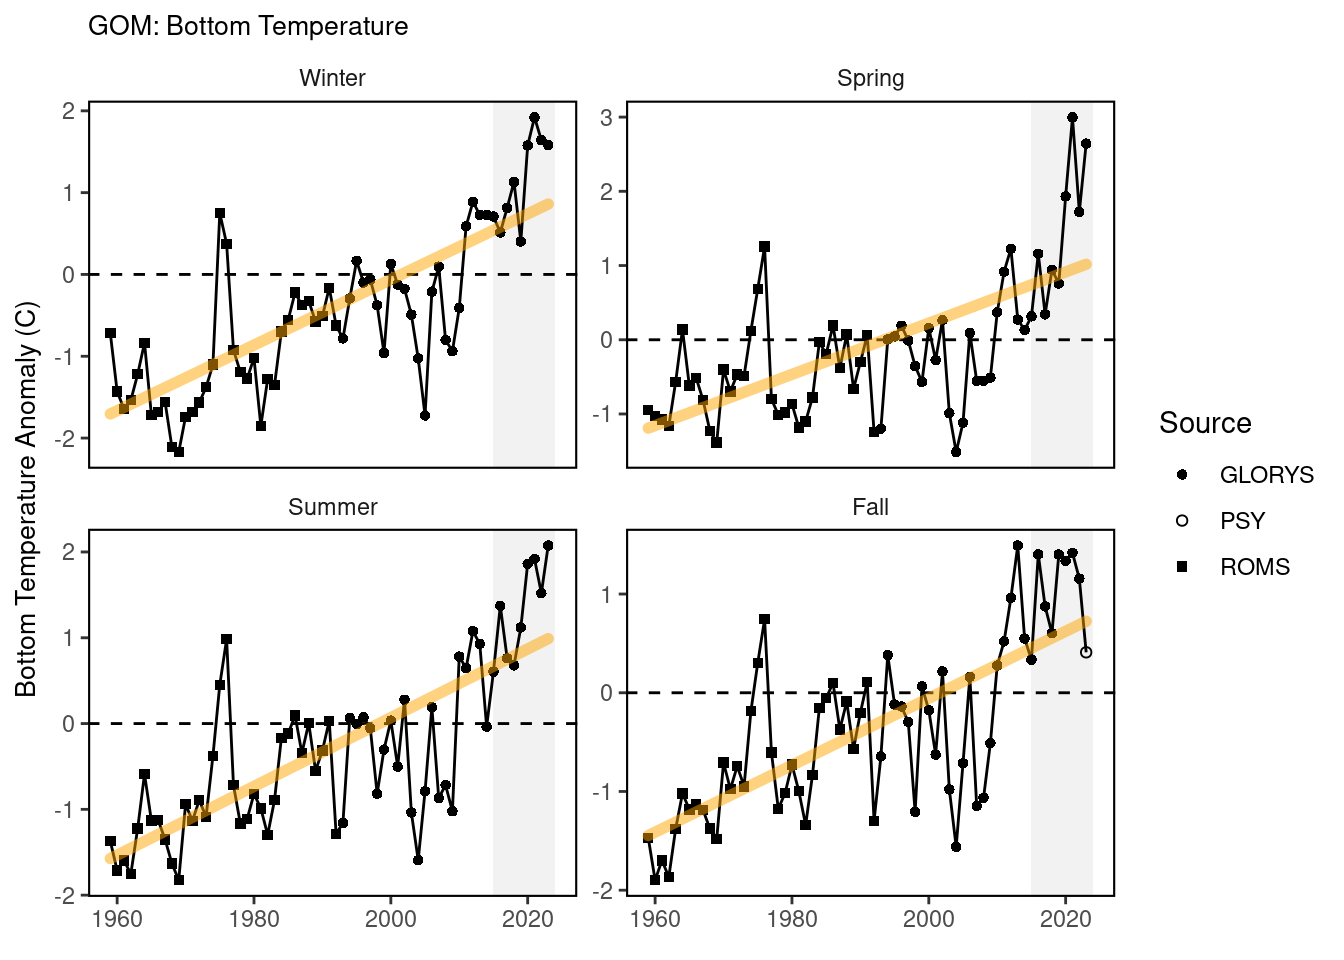
Anomalies are calculated using the 1990-2020 reference period.
35.2 Key Results and Visualizations
Time series plots for seasonal bottom temperature anomaly for each EPU shows a long-term warming trend. PSY forecasted data also included for comparison and indicates varying skill in predicting regional bottom temperature.

35.4 Implications
Bottom temperature is an important driver for benthic and demersal species growth, metabolism, and reproduction. Changes in seasonal bottom temperature have implications for species’ phenology
35.5 Get the data
Point of contact: joseph.caracappa@noaa.gov
ecodata name: ecodata::bottom_temp_comp
Variable definitions
Season: 1 = winter (January – March), 2 = spring (April – June), 3 = summer (July – September), 4 = fall (October – December) Subarea: EPU name
Source: ROMS (bias-corrected ROMS-NWA bottom temperature [59]), GLORYS (CMEM’s GLORYS12V1 global reanalysis bottom temperature), PSY (CMEM’s PSY global forecast bottom temperature)
bt_temp : mean bottom temperature for each year/season across entire EPU ref_bt: bottom temperature climatology for season/EPU based on 1990-2020
Indicator Category:
35.7 Accessibility and Constraints
No response
tech-doc link https://noaa-edab.github.io/tech-doc/bottom_temp_comp.html