26 Cetacean Distribution Shifts
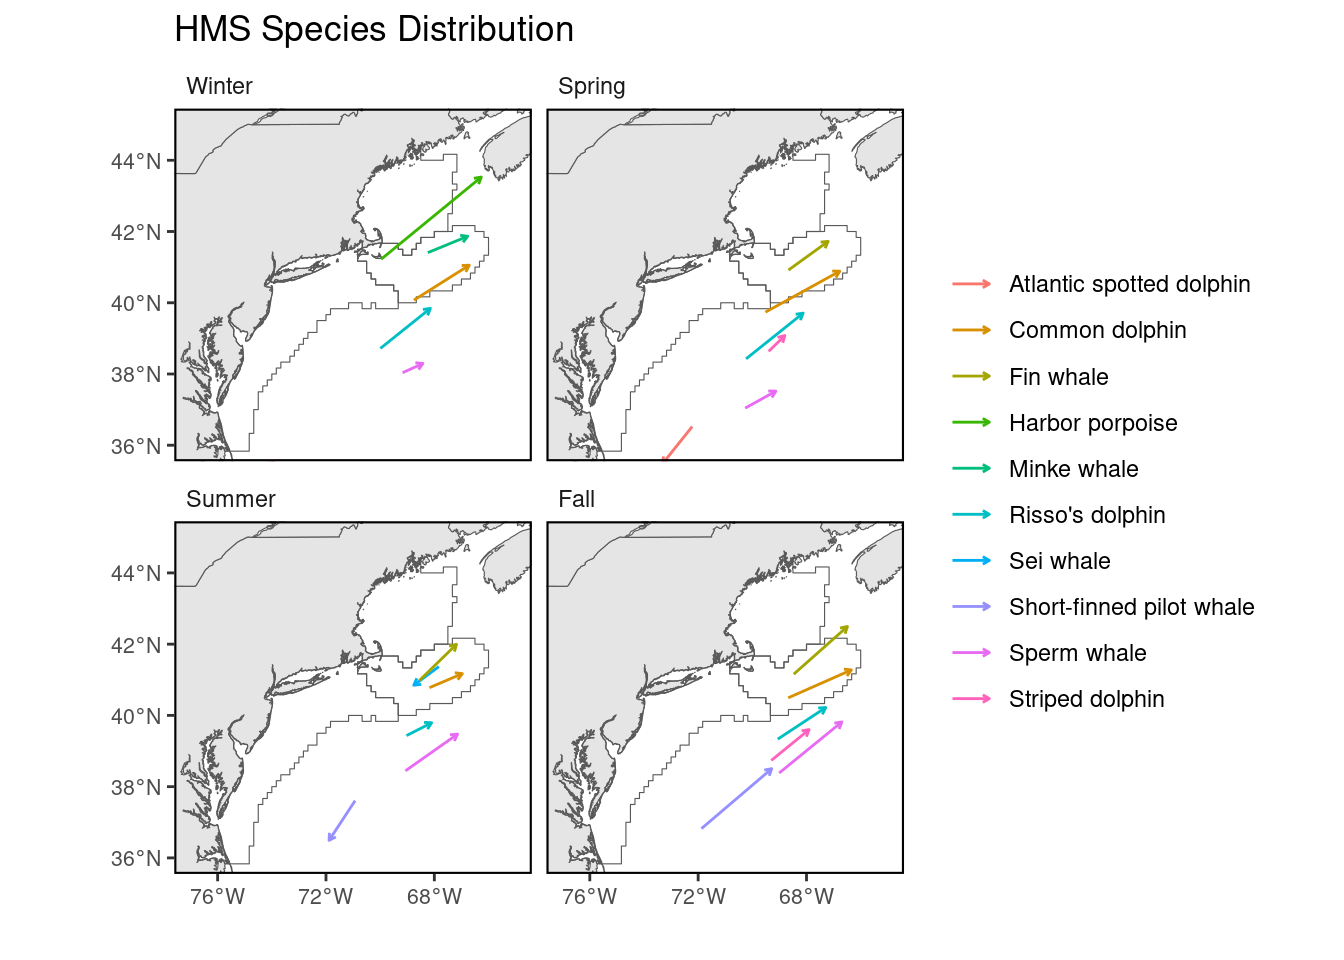
Description: The data presented here are the locations of the center of core habitat for cetaceans by season as documented in 2010 versus 2017.
Indicator family:
Contributor(s): Sam Chavez, Elizabeth Josephson, Debra Palka
Affiliations: NEFSC
26.1 Introduction to Indicator
Marine species are being affected by global climate changes, and in most cases the documented responses include distribution shifts from their historical habitat. In addition, human-caused drivers such as the noise and physical disturbances from oil and gas exploration, fishing, boat traffic and infrastructure such as offshore renewable energy developments, as well as other maritime activities could also result in shifts. [44] used Northwest Atlantic cetacean location data collected in its changing environment to investigate if their habitats are changing, and if so, to what extent.
A climate vulnerability assessment is published for Atlantic and Gulf of Mexico marine mammal populations [45].
26.2 Key Results and Visualizations
For seasons and cetacean species with the movements greater then 70 km, the season plots show the direction and magnitude of core habitat shifts. The locations of the tip and end of the arrow is the seasonal weighted centroid locations for 2010 (end of arrow) and 2017 (tip of arrow). The longer the arrow the more the seasonal shift in distribution. For species that showed a clear displacement of the weighted centroid, the average magnitude of the shift was 178 km shifted towards the northeast and into deeper waters. Bottlenose dolphin habitat showed the most drastic shift for all seasons except during winter: spring= 294 km, summer=505 km, fall= 753 km and winter = 211. There was a clear tendency where the proportion of the estimated population in southern latitudes decreased, while north of 35° the proportion of the estimated population increased, especially during summer 2017. Other species that on average, showed a moderate-to-no spatial shift included humpback whale, minke whale, white-sided dolphin, Sowerby’s beaked whale, and long-finned pilot.
26.3 Indicator statistics
Spatial scale: All U.S. Atlantic waters north of Cape Hatteras, North Carolina. Thus including all EPU and beyond.
Temporal scale: By each of the 4 seasons in 2010 and in 2017.
Synthesis Theme:
26.4 Implications
Shifting species distributions alter both species interactions and fishery interactions. Those shifts affect the interaction of multiple system covariates and can result in ecosystem reorganization. In particular, shifting species distributions can alter expected management outcomes from spatial allocations and affect the efficacy of bycatch measures based on historical fish and protected species distributions. A UME for minke whales began in 2017 and is pending closure in 2024.
26.5 Get the data
Point of contact: Sam Chavez (samuel.chavez@noaa.gov); Debra Palka (debra.palka@noaa.gov)
ecodata name: ecodata::HMS_species_distribution
Variable definitions
- Time=time period of centroid location.
- species=cetacean species.
- season.
- wlat=latitude of centroid.
- wlon=longitude of centroid.
Indicator Category:
26.7 Accessibility and Constraints
No response
tech-doc link https://noaa-edab.github.io/tech-doc/HMS_species_distribution.html