scallops
scallops.Rmd## Linking to GEOS 3.9.3, GDAL 3.5.2, PROJ 8.2.1; sf_use_s2() is TRUEGears
The fishing data were processed and passed through minimal QA/QC. All ports were assigned lat and lons (as best as possible), all landings were assigned to an atlantis group.
SCA is the atlantis group for scallops.
Gear Categories identified, in the data set, as scallop vessels were
- Scallop Gear
These GEARCAT(s) were filtered to provide the following output
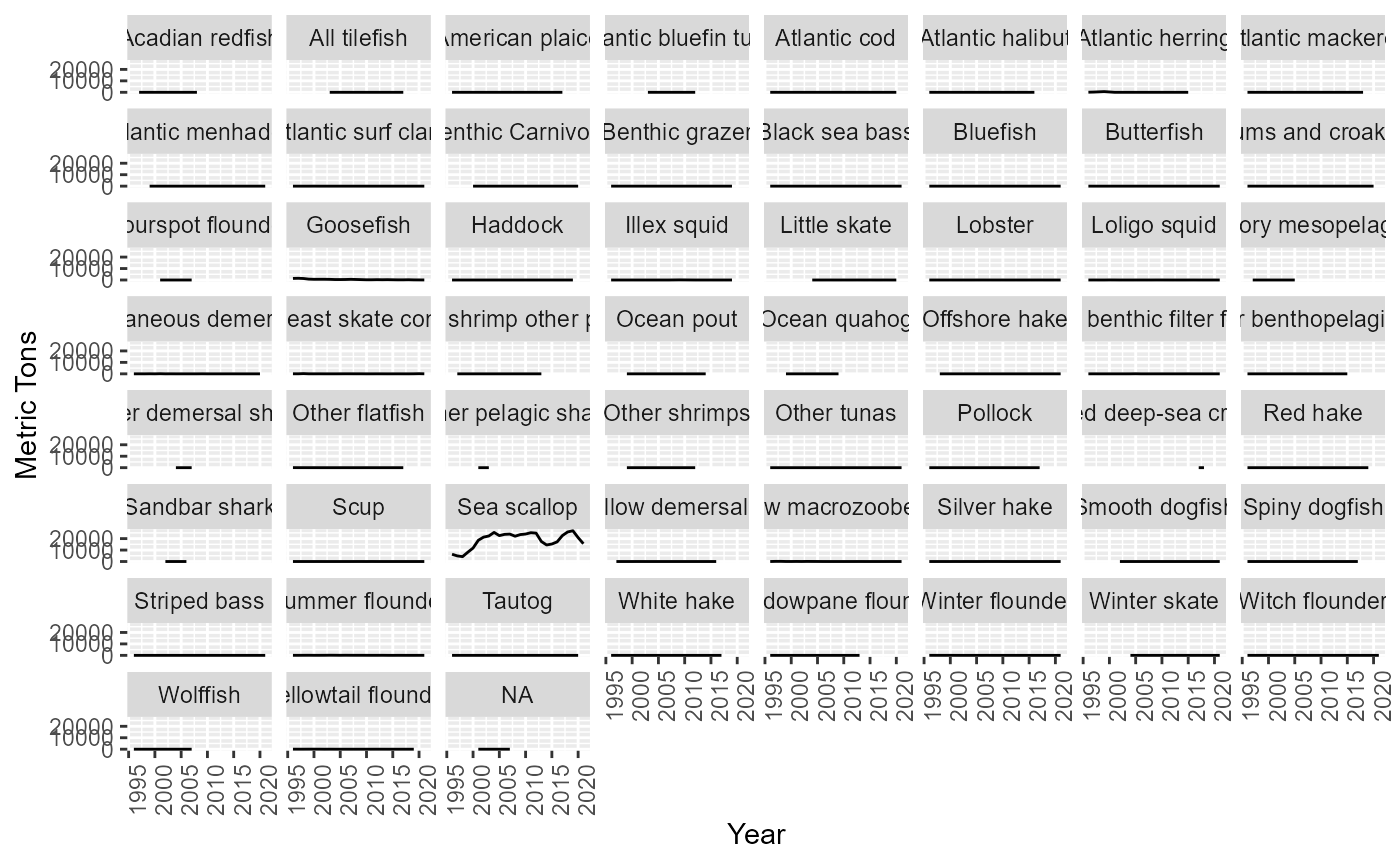
Landings of Scallops by state
#> `geom_line()`: Each group consists of only one observation.
#> ℹ Do you need to adjust the group aesthetic?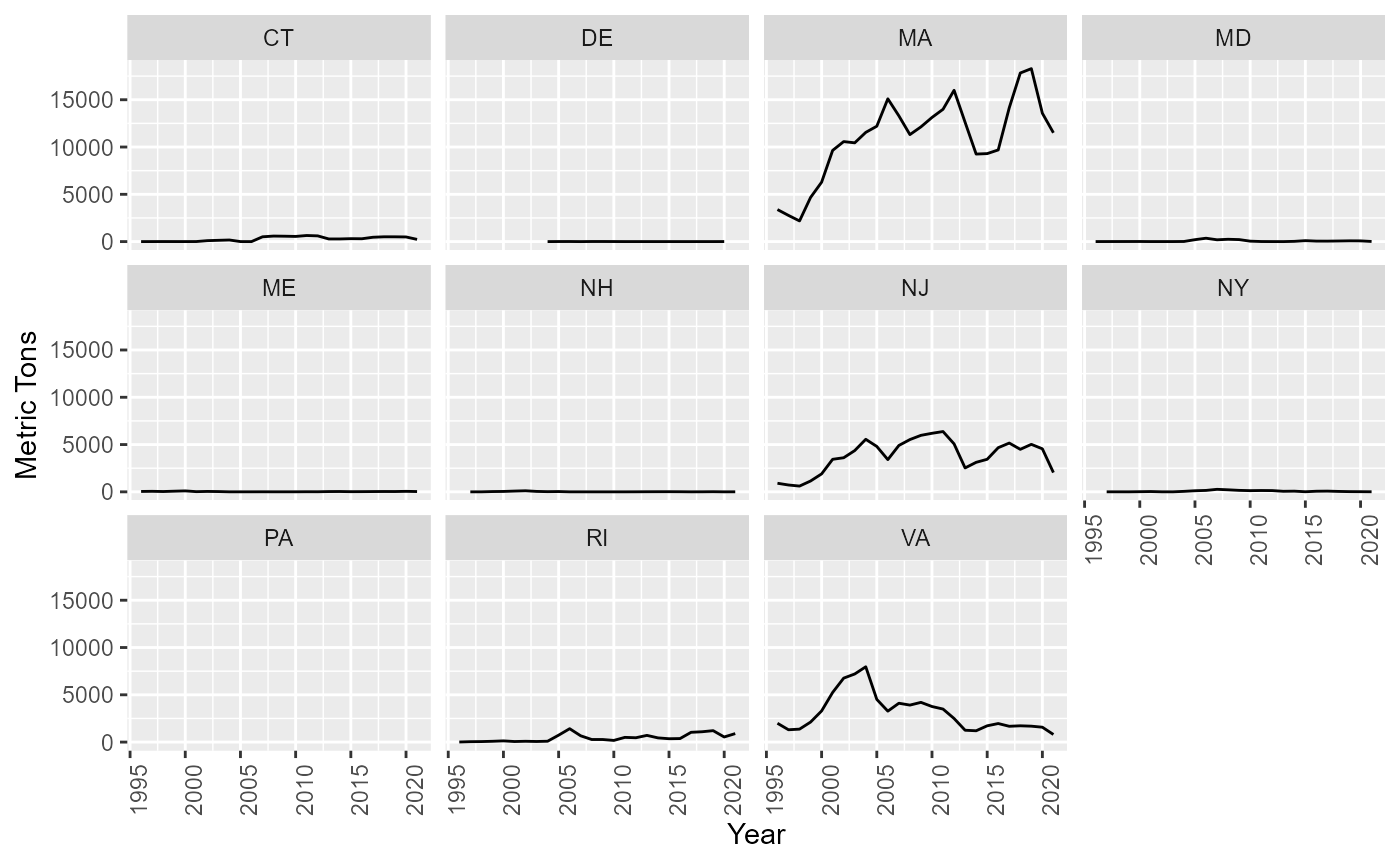
Timing of Landings
What is the distribution of effort over the calendar year
sca |>
  dplyr::select(TRIPID,MONTH,InsideDAS) |>
  dplyr::distinct() |>
  dplyr::mutate(MONTH = as.factor(MONTH)) |>
  dplyr::group_by(MONTH) |>
  dplyr::summarise(effort = sum(InsideDAS),
                   .groups = "drop") |>
  ggplot2::ggplot()+
  ggplot2::geom_col(ggplot2::aes(x=MONTH,y=effort)) +
  ggplot2::ylab("Days at Sea") +
  ggplot2::ggtitle(paste0(range(sca$Year),collapse="-"))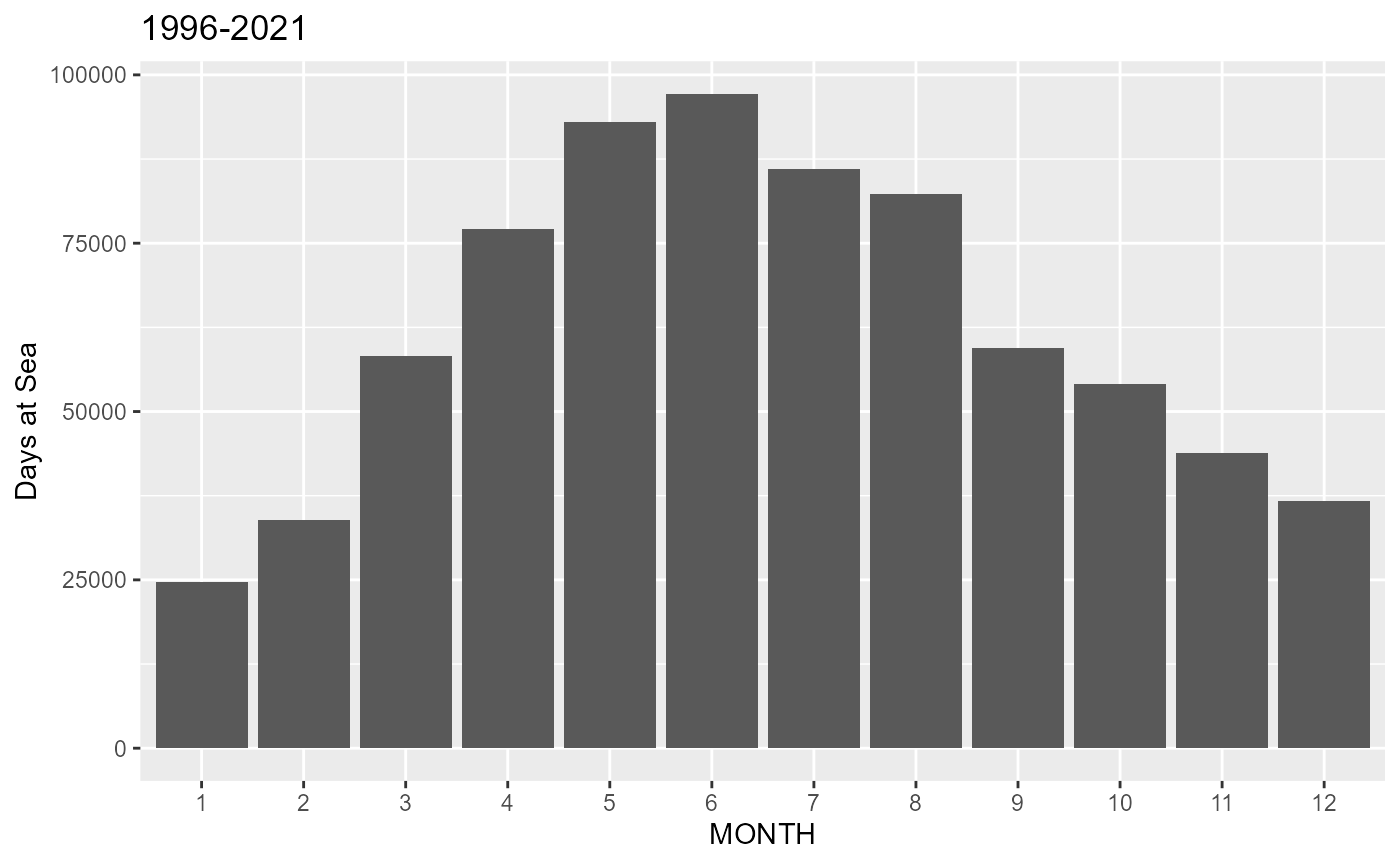
Magnitude of Landings
What is the distribution of landings over the calendar year
sca |>
  dplyr::filter(Code %in% speciesCodes) |>
  dplyr::select(MONTH,InsideLANDED) |>
  dplyr::mutate(MONTH = as.factor(MONTH)) |>
  dplyr::group_by(MONTH) |>
  dplyr::summarise(landings = sum(InsideLANDED),
                   .groups = "drop") |>
  ggplot2::ggplot()+
  ggplot2::geom_col(ggplot2::aes(x=MONTH,y=landings)) +
  ggplot2::ylab("Metric Tons") +
  ggplot2::ggtitle(paste0(range(sca$Year),collapse="-"))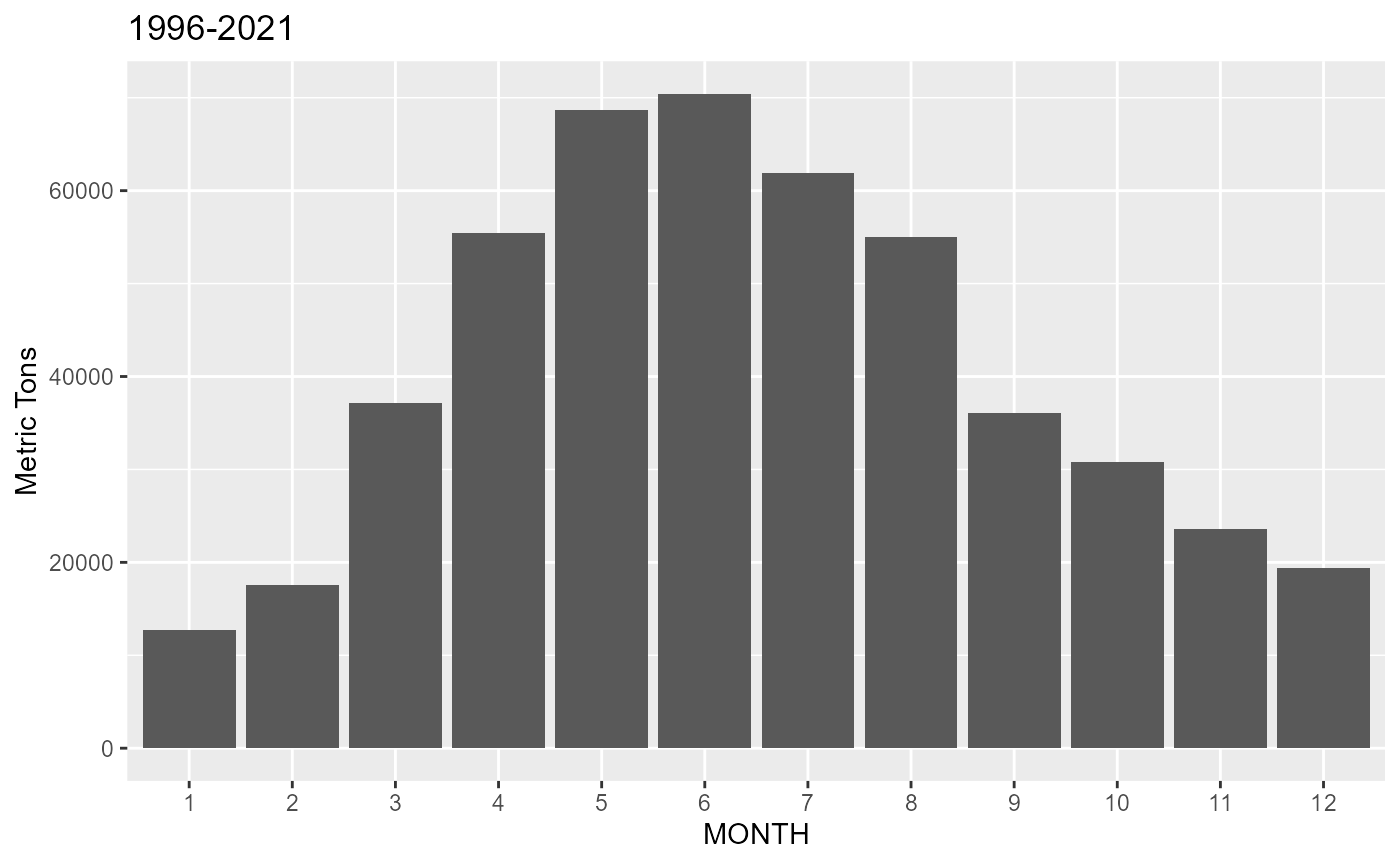
Select the main ports
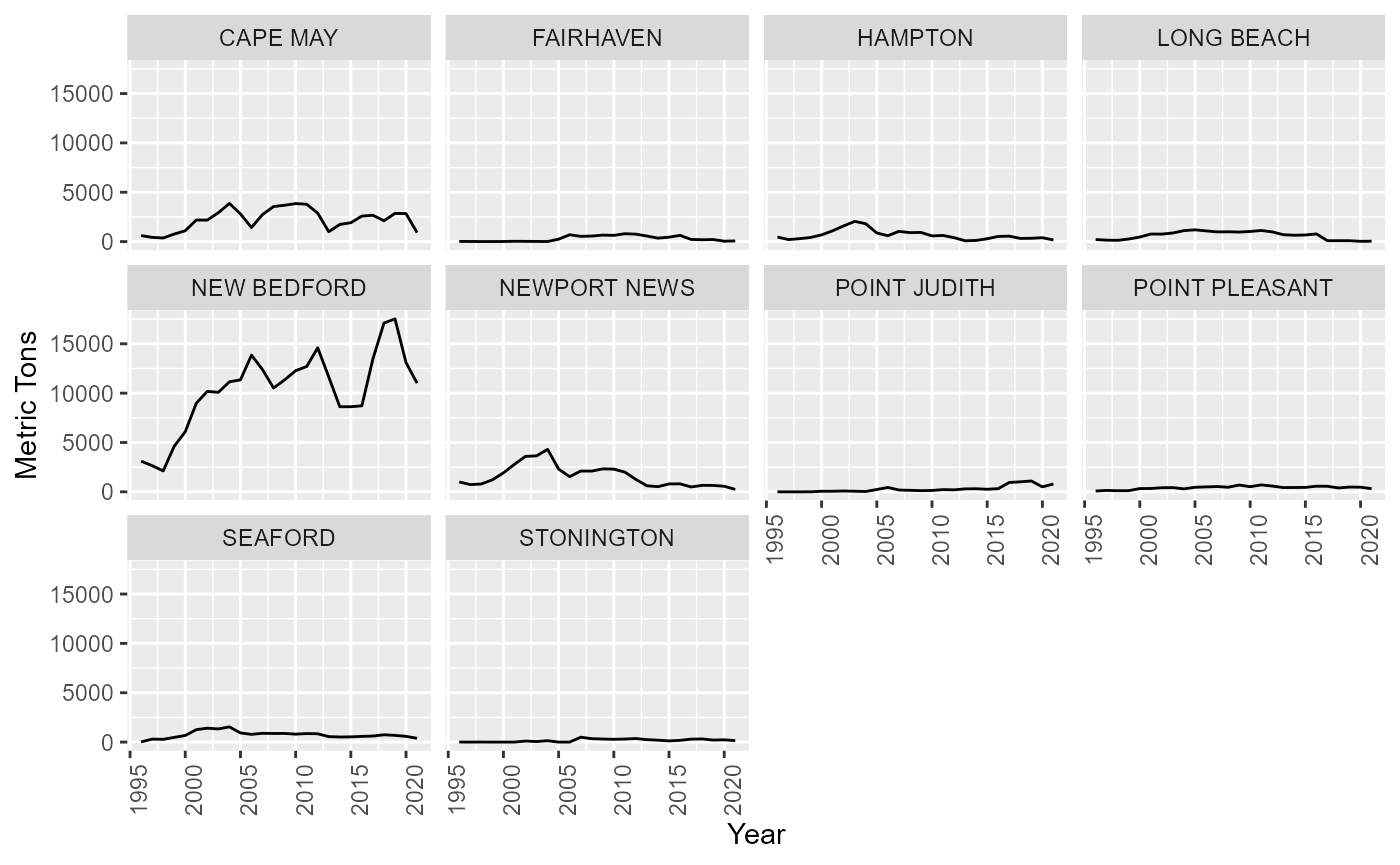
The following ports three main ports are selected. Other smaller ports (listed under main port) are combined with main ports. hese ports comprise ~ 90% of total landings.
- MASSACHUSETTS
- NEW BEDFORD (240403)
- FAIRHAVEN (242203)
- NEW BEDFORD (240403)
- NEW JERSEY
- CAPE MAY (330309)
- LONG BEACH (331627)
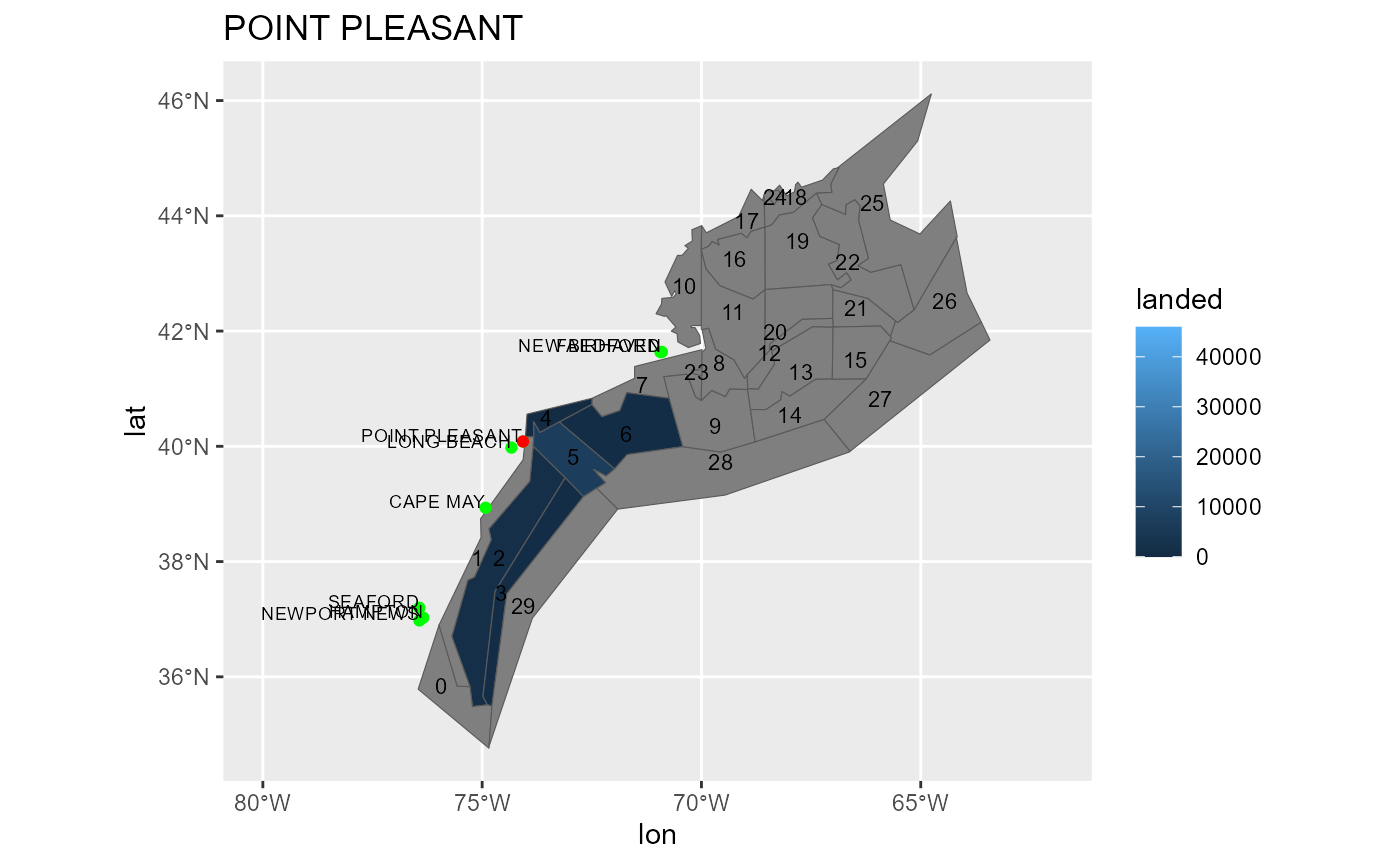
- POINT PLEASANT (330127)
- CAPE MAY (330309)
- VIRGINIA
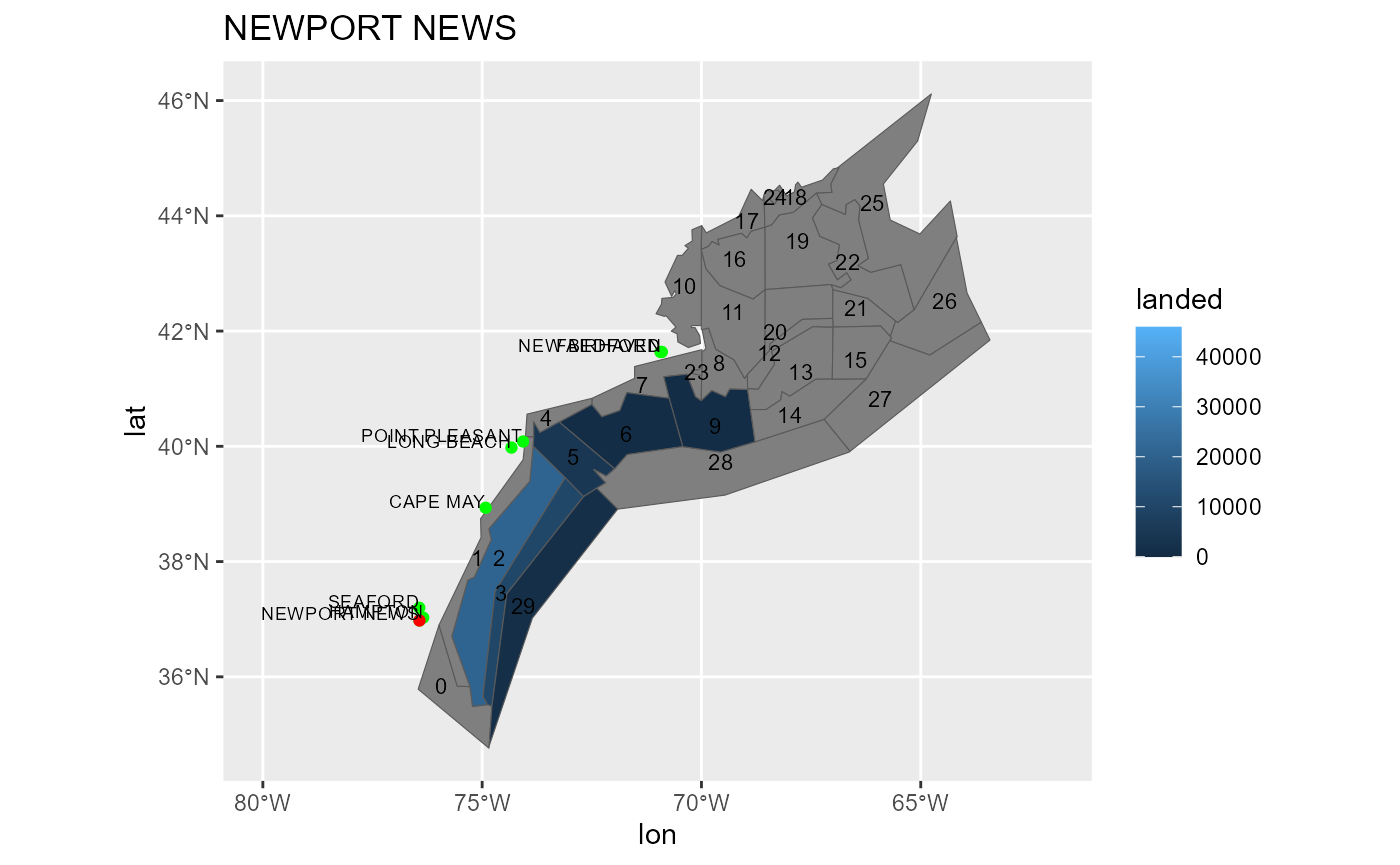
- NEWPORT NEWS (490910)
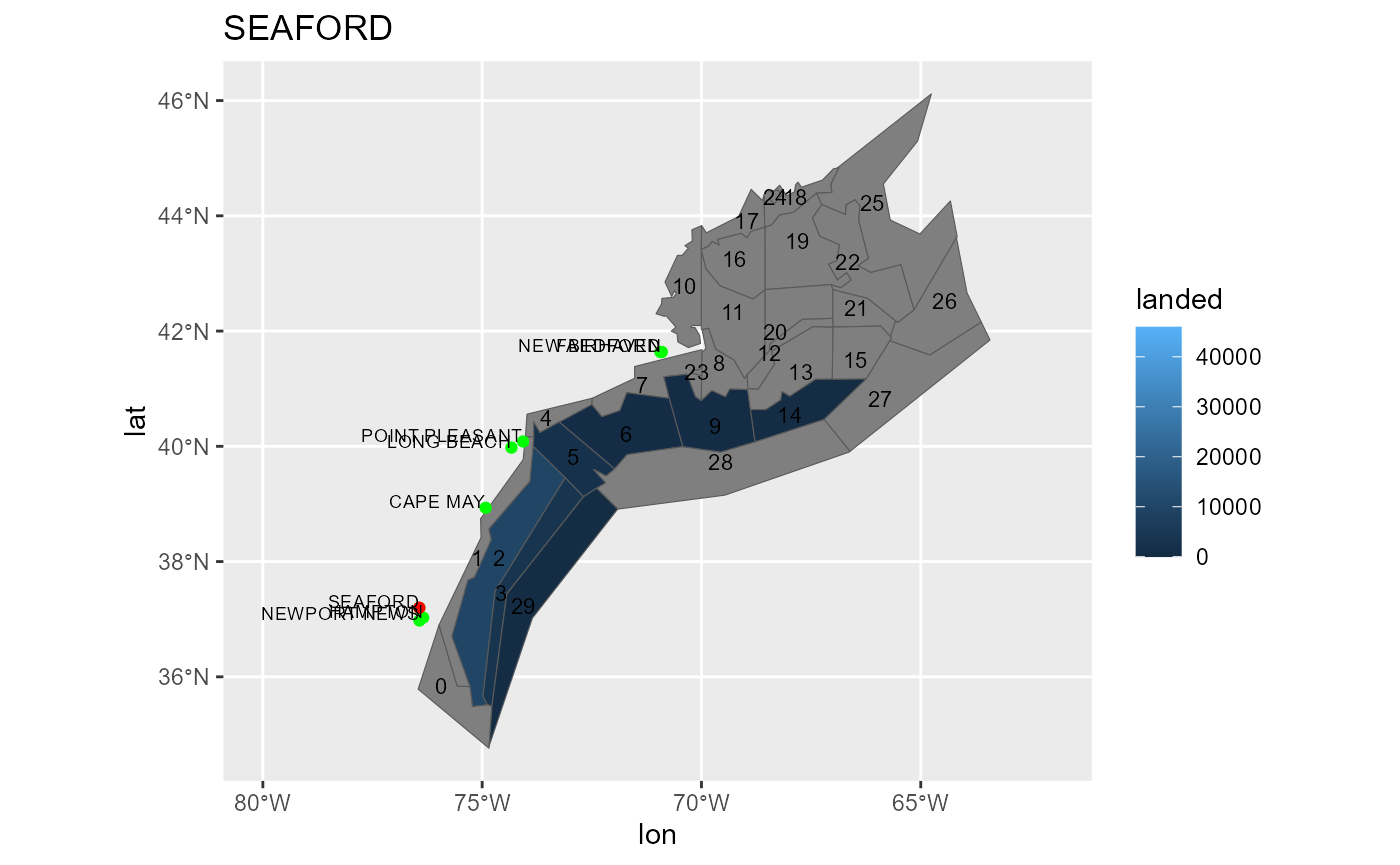
- SEAFORD (490869)
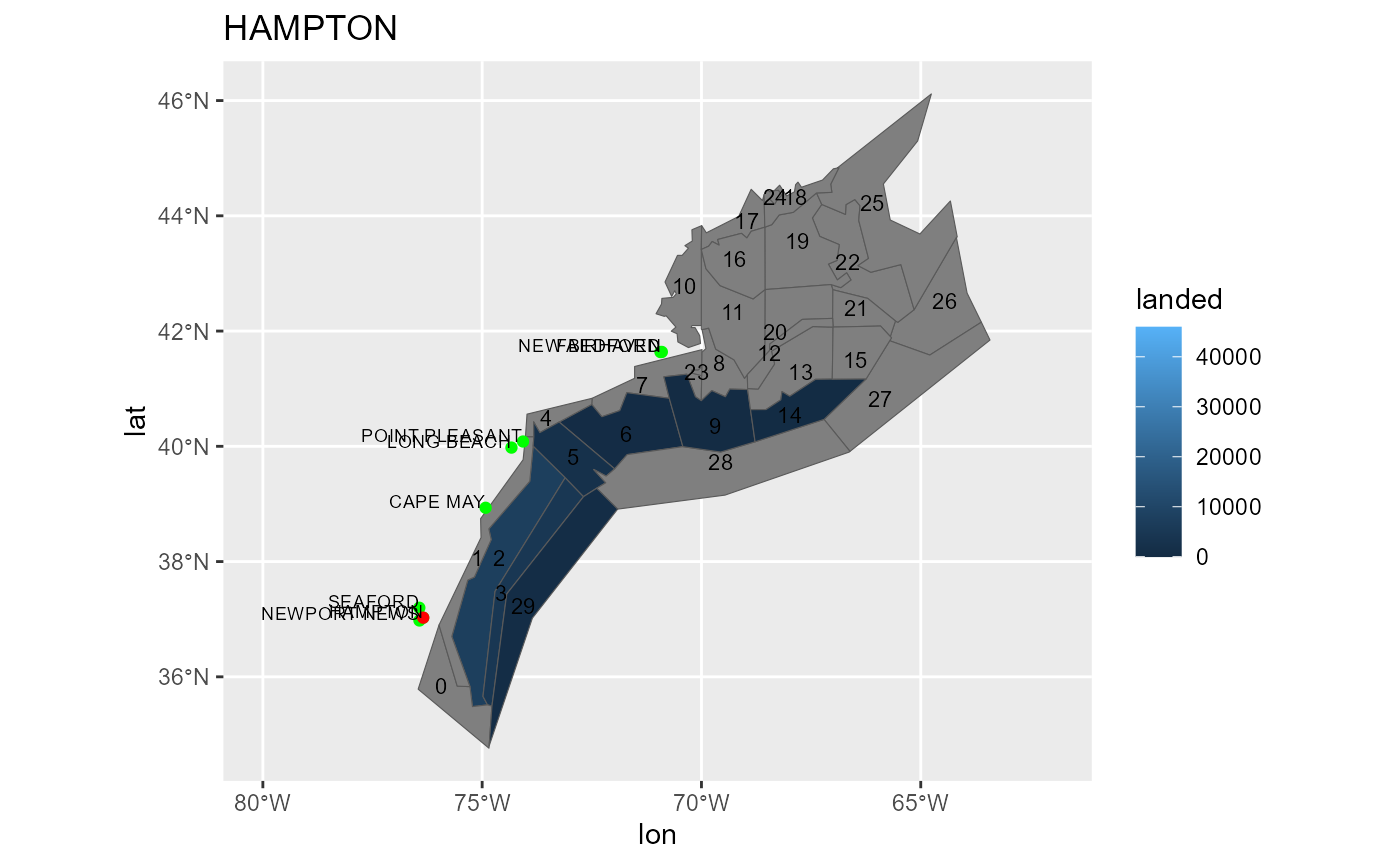
- HAMPTON (490118)
- NEWPORT NEWS (490910)
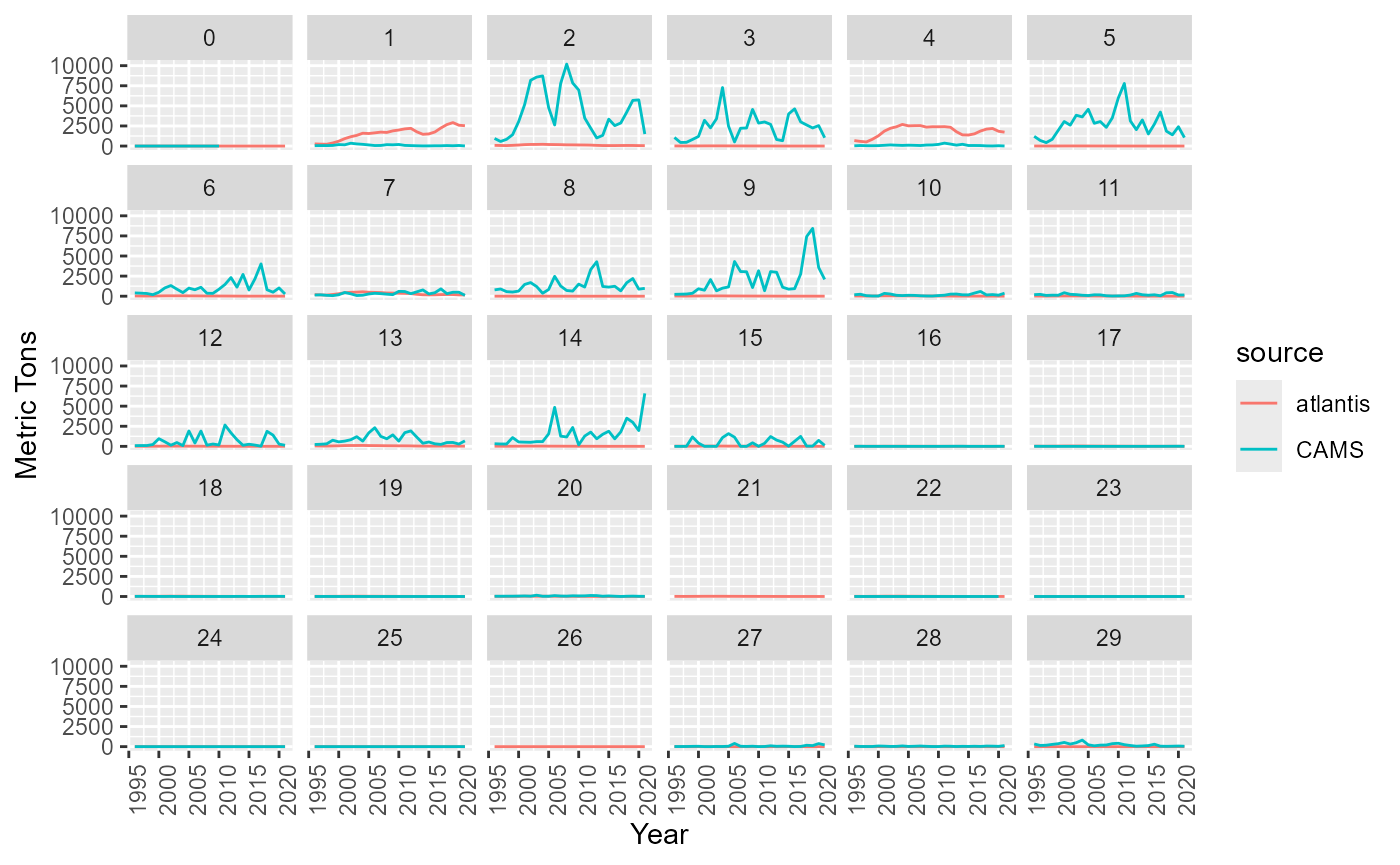
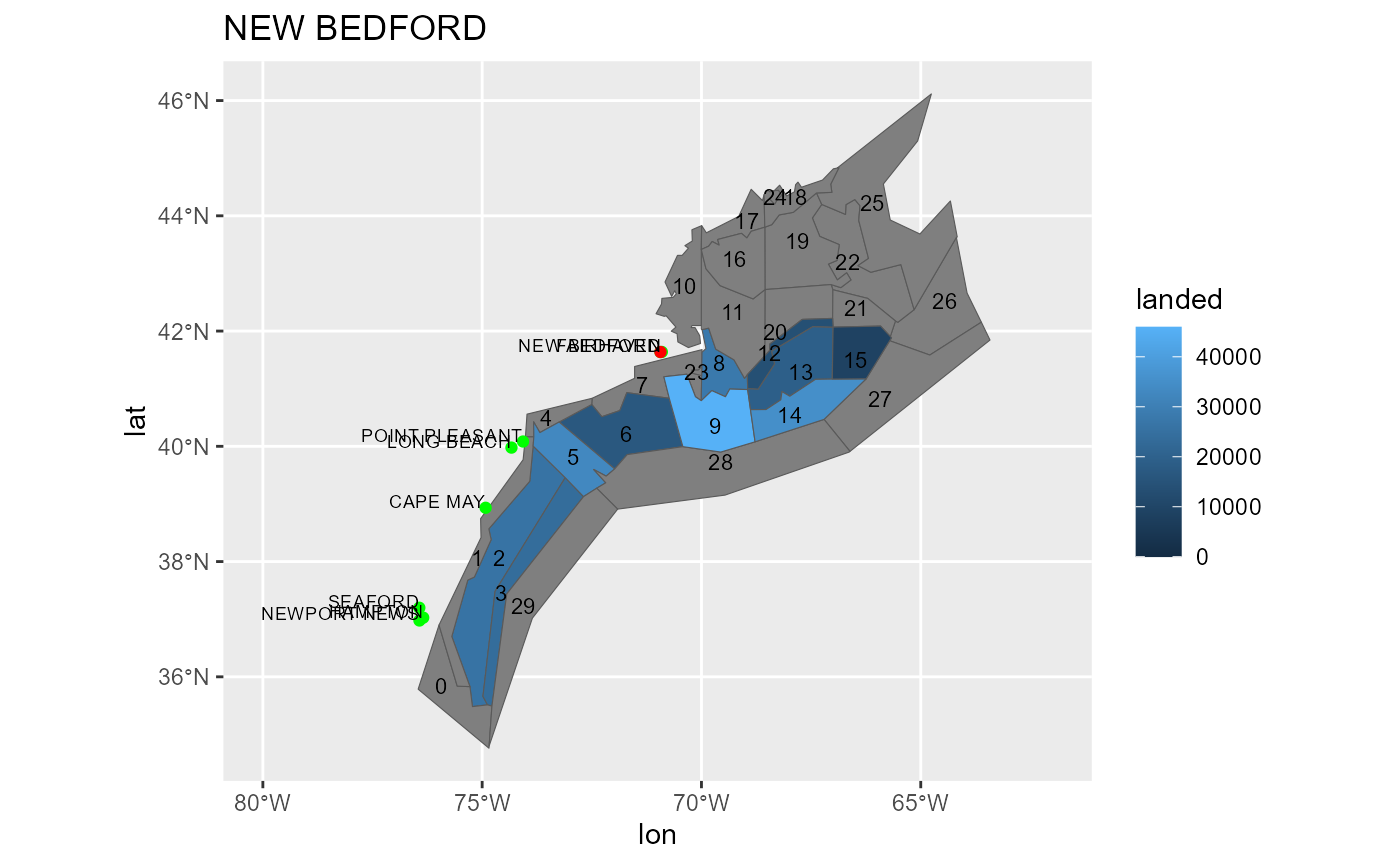
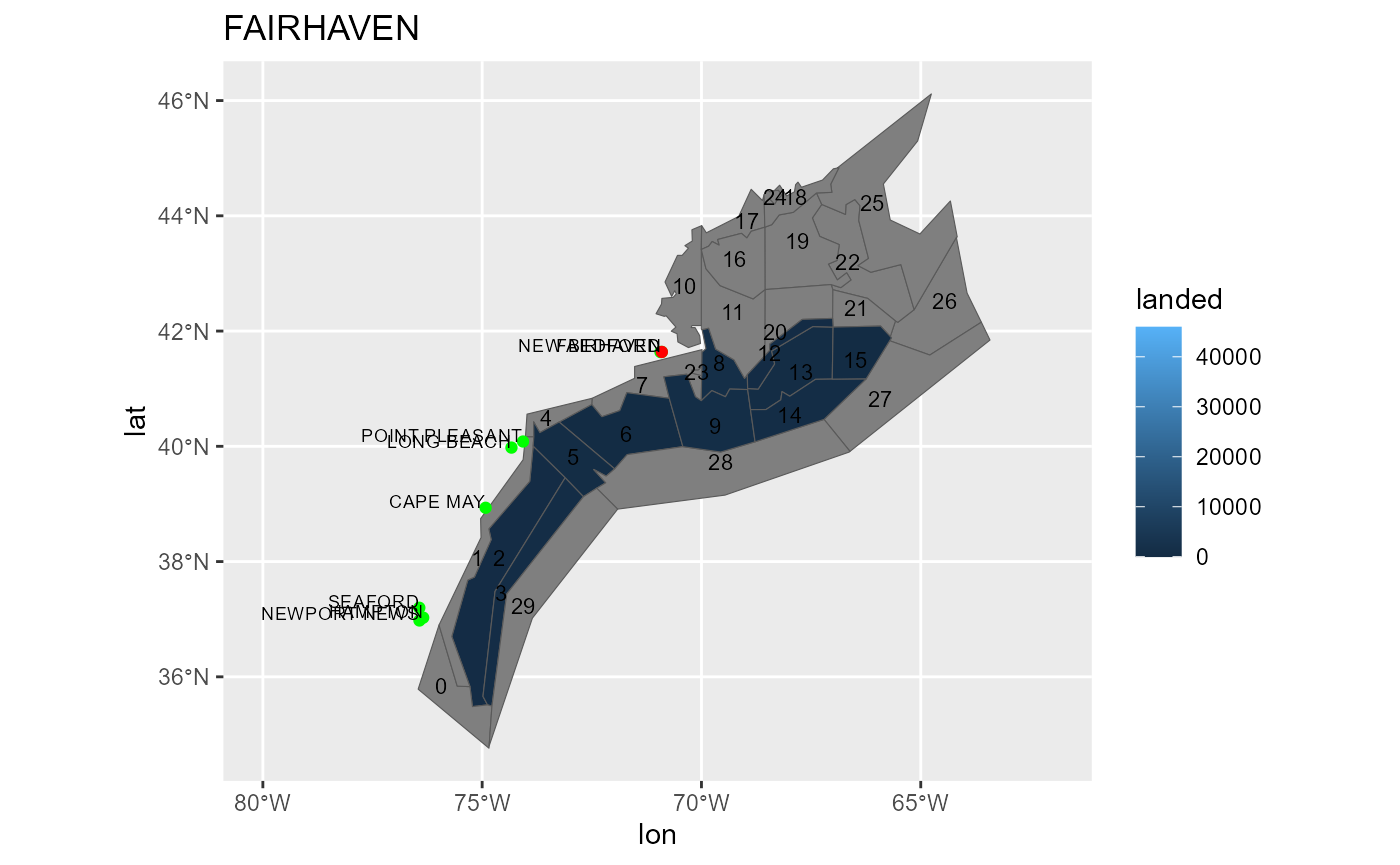
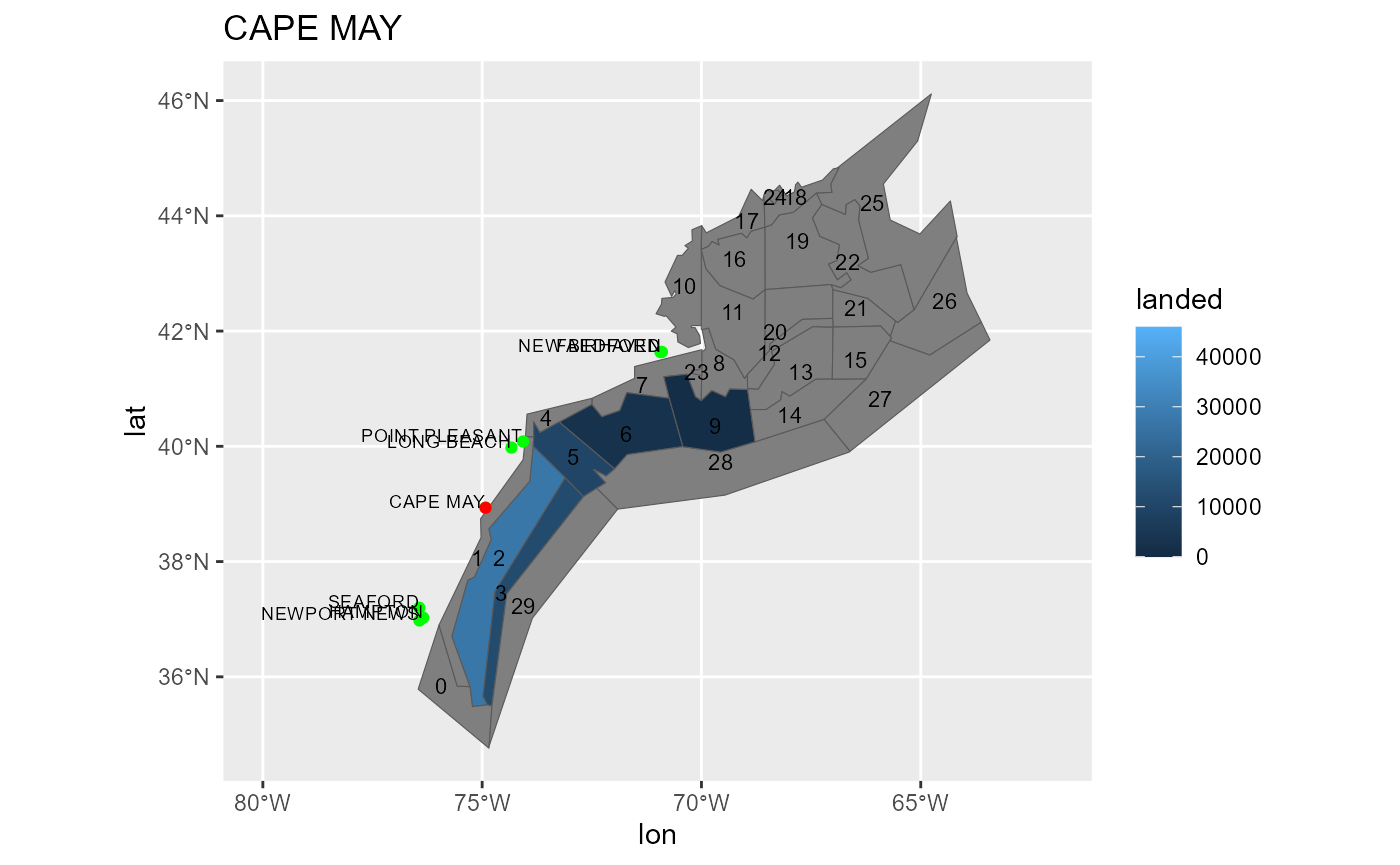
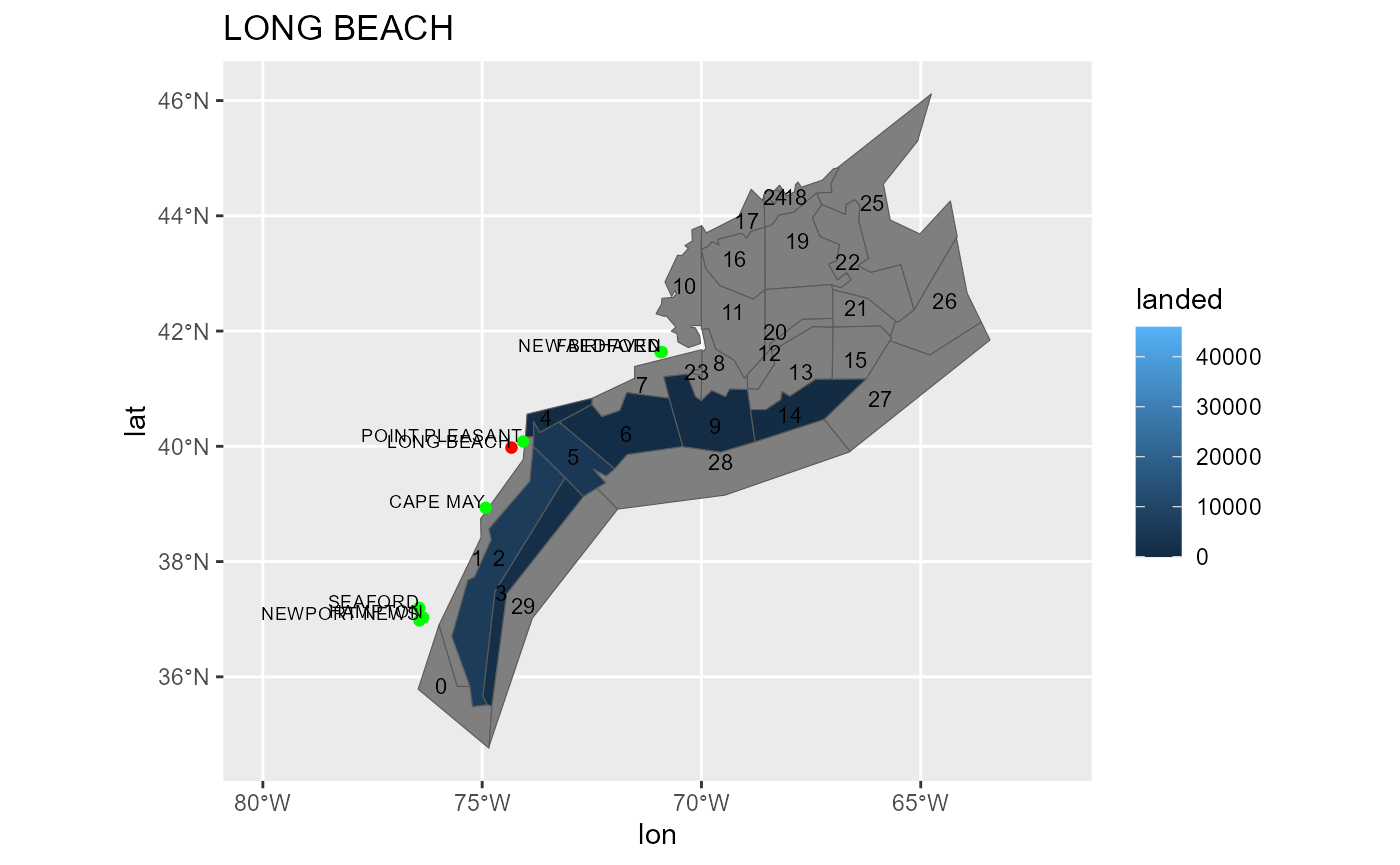
Landings (data) by box spatially
#> Warning in st_point_on_surface.sfc(sf::st_zm(x)): st_point_on_surface may not
#> give correct results for longitude/latitude data
#> Warning: `position_dodge()` requires non-overlapping x
#> intervals.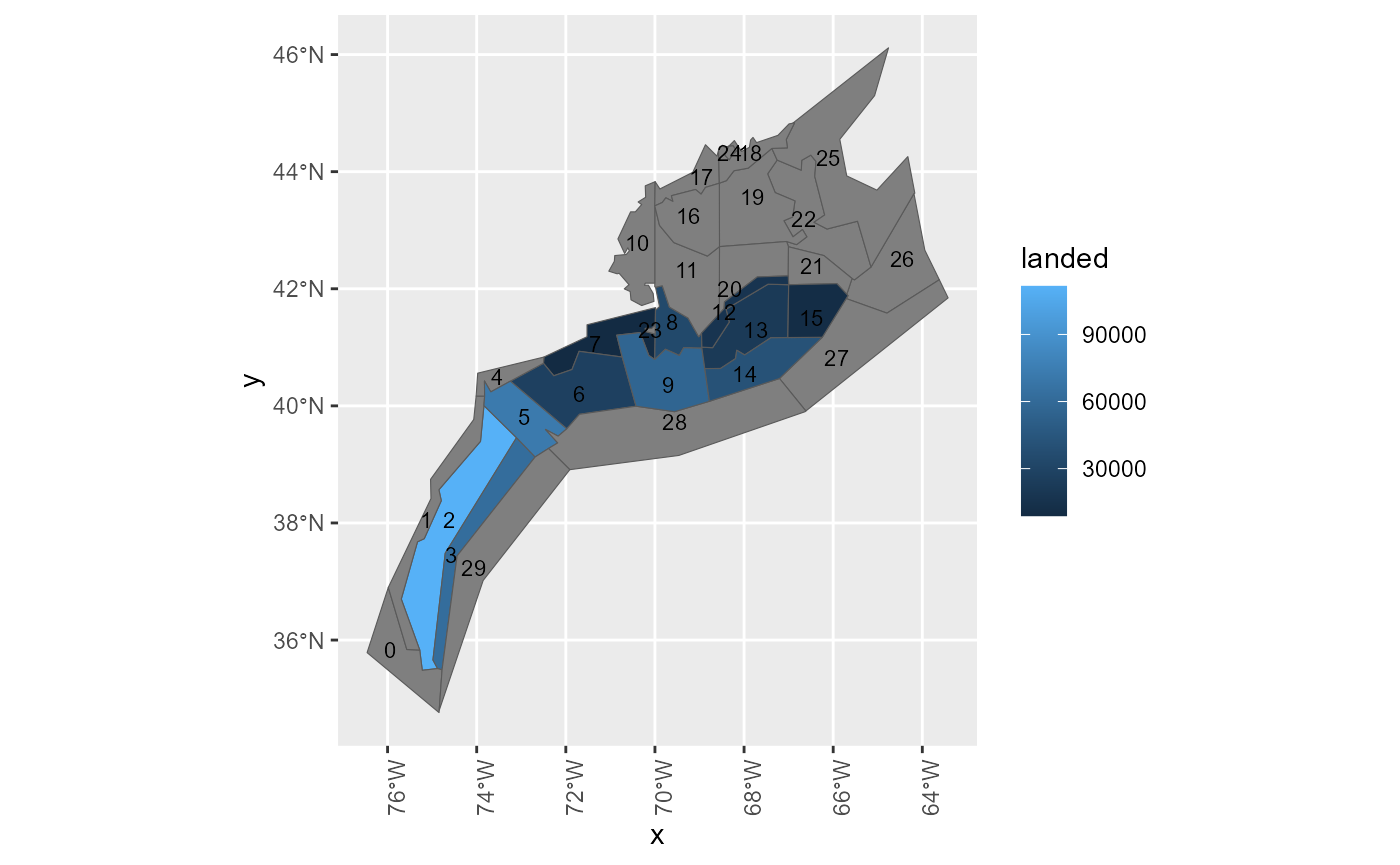
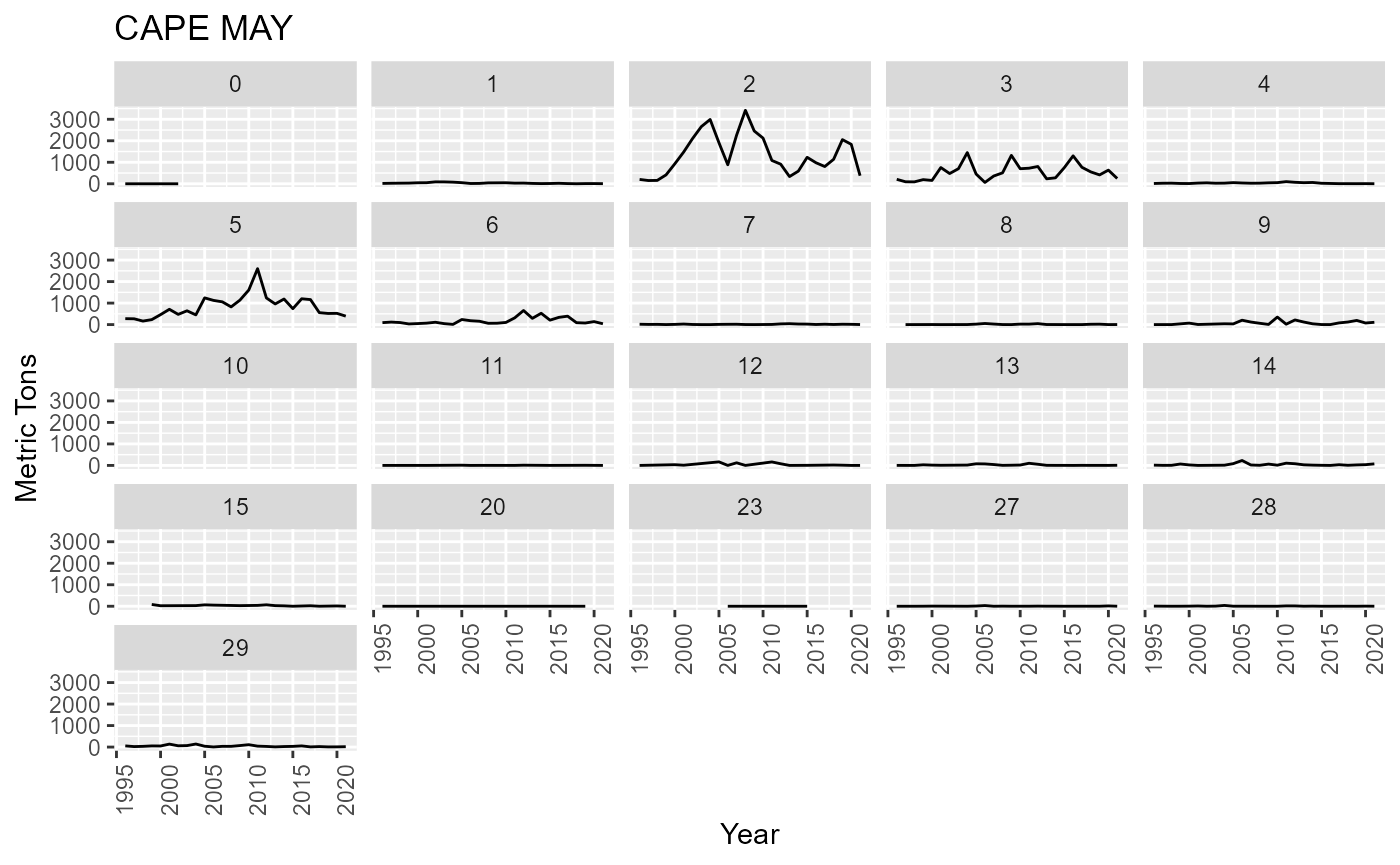
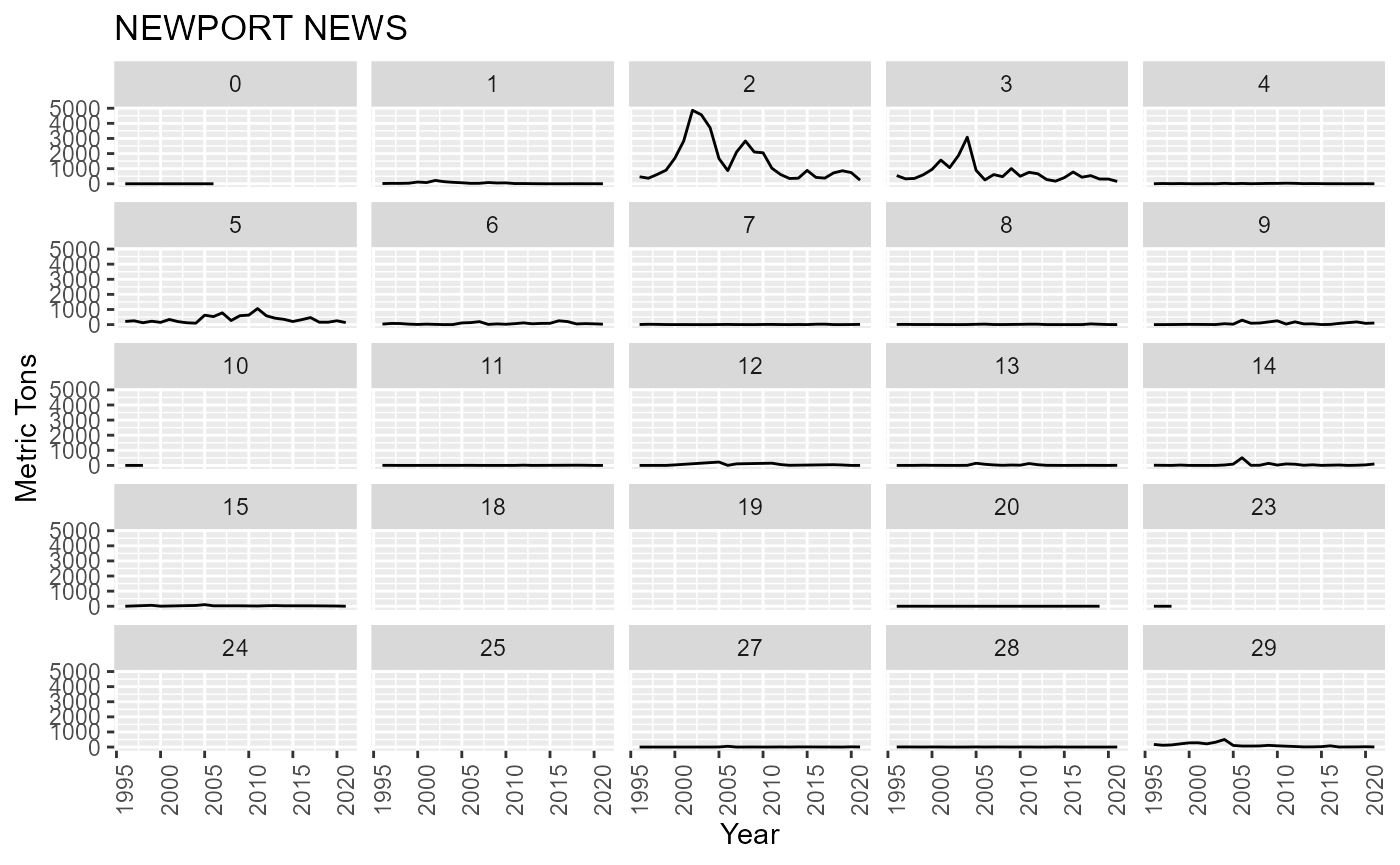
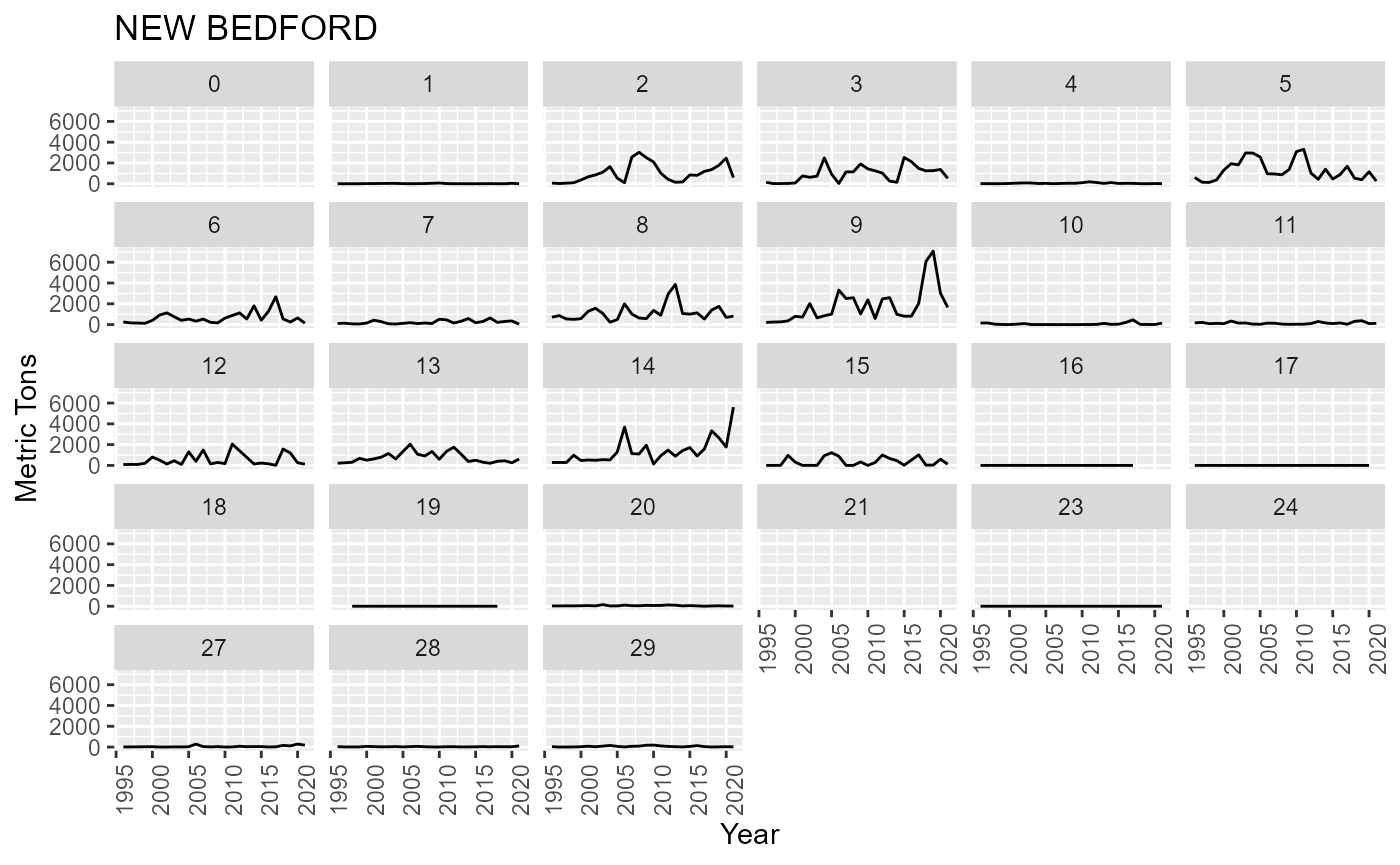
Boxes that contribute 95% of landings 2, 3, 5, 6, 7, 8, 9, 12, 13, 14, 15
Aggregate remaining data as “other” fleet
The remaining ports (other than the ports listed above) make up ~10% of total landings. All trips associated with these ports will be combined to form one fleet which will fish in the footprint below. This maintains the communities at sea idea for the main ports but takes into account all remaining landings to satisfy model requirements
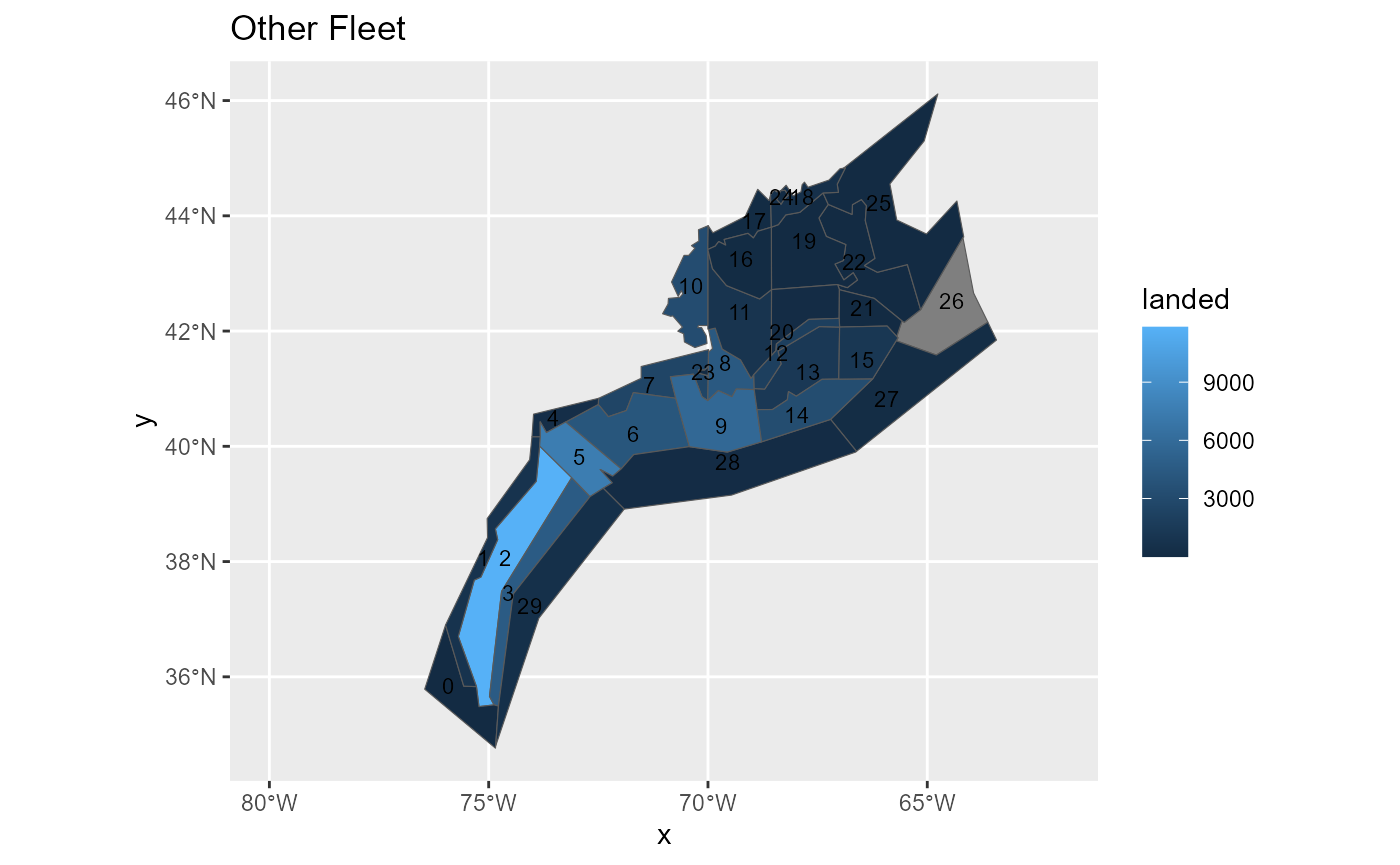
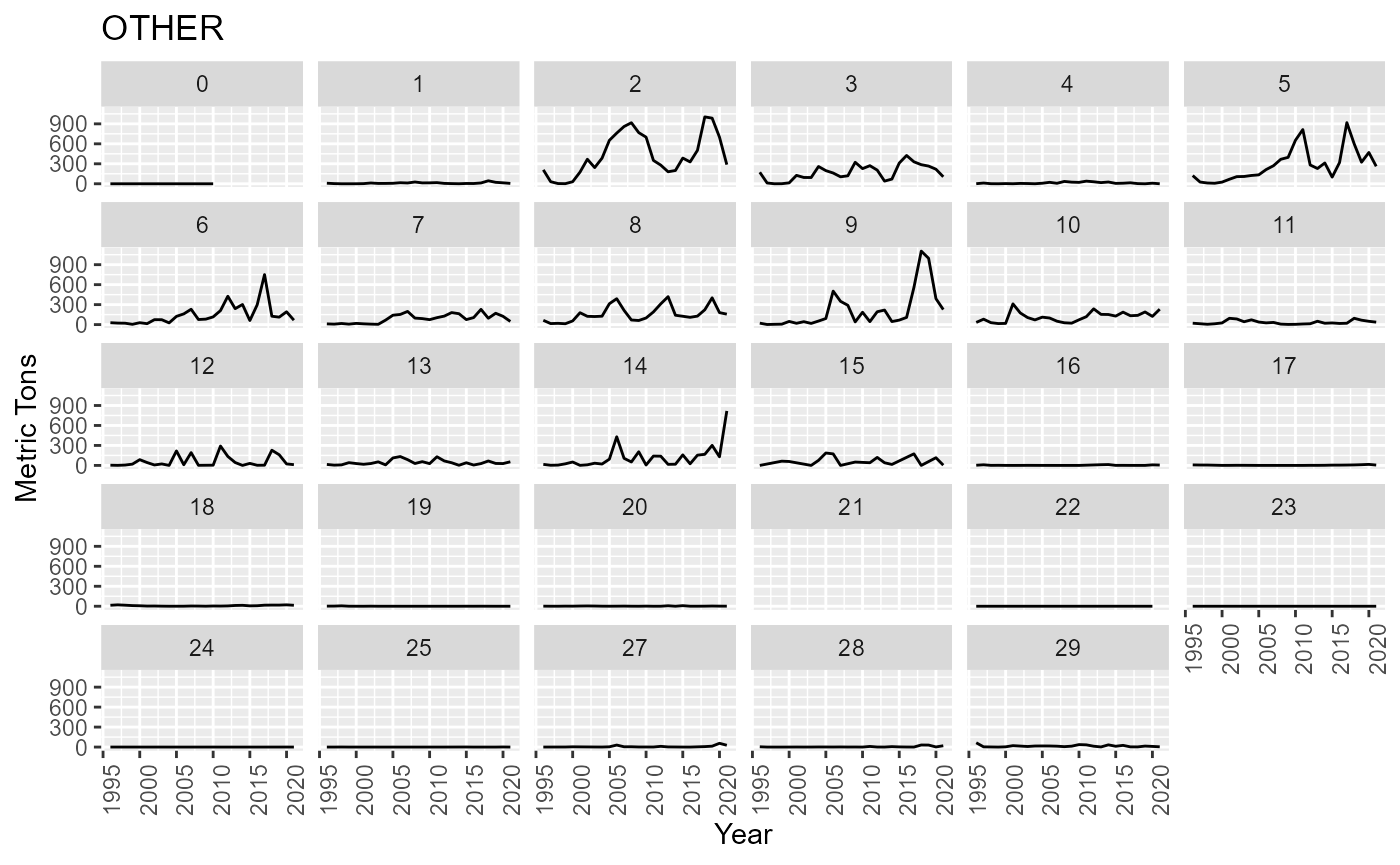
Total Landings over 1996-2021 = 5.5382^{4} metric tons
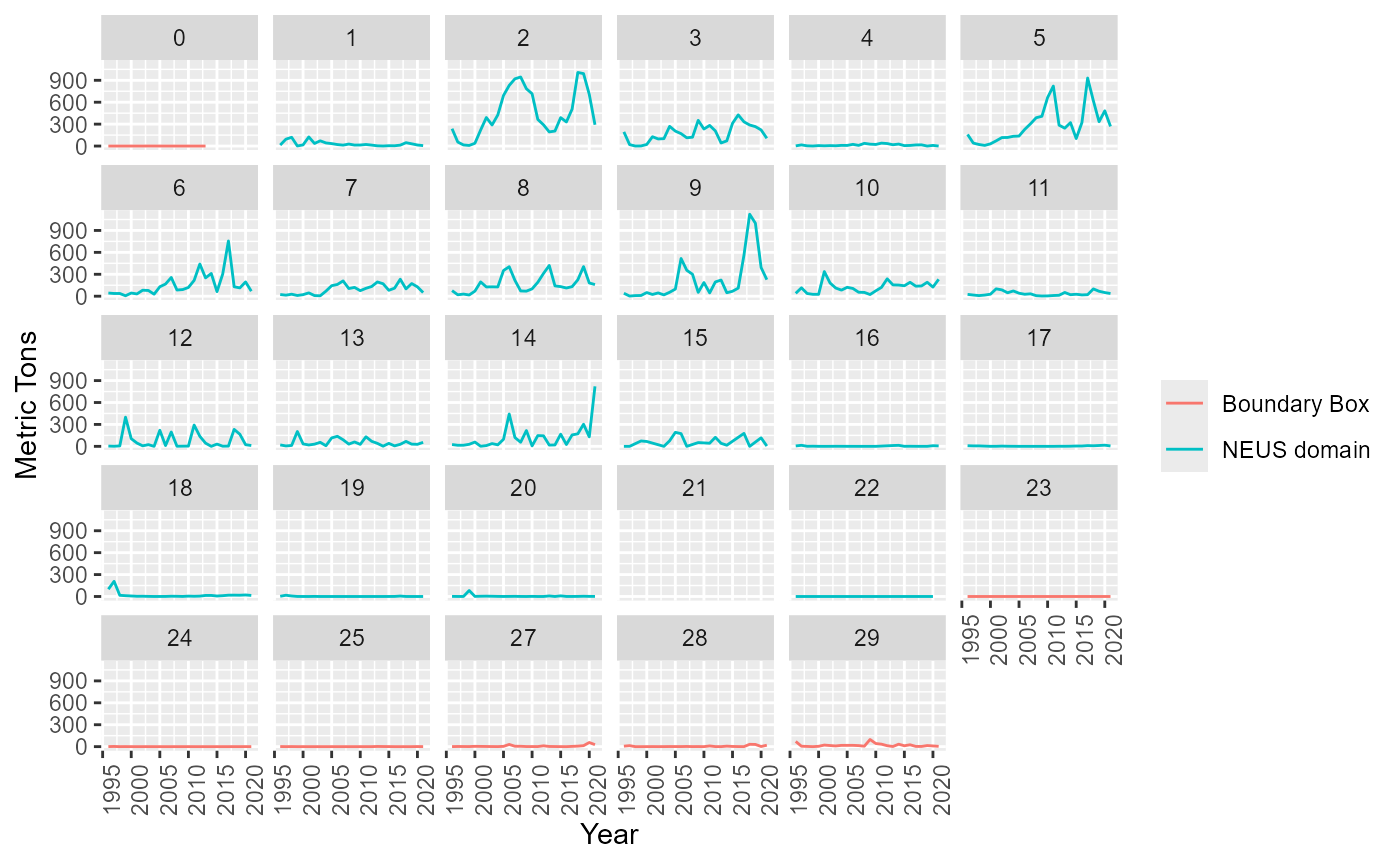
Time series of landings by box of other fleet
Effort
The effort variable is Days at sea (DAS) and is a crude metric. Only integer values and rounded up to the nearest whole day. It is the length of the trip. Note: For each record of a trip (multiple records based on the species caught) the DAS is replicated, so to calculate the true DAS we need to find distinct Trip-DAS
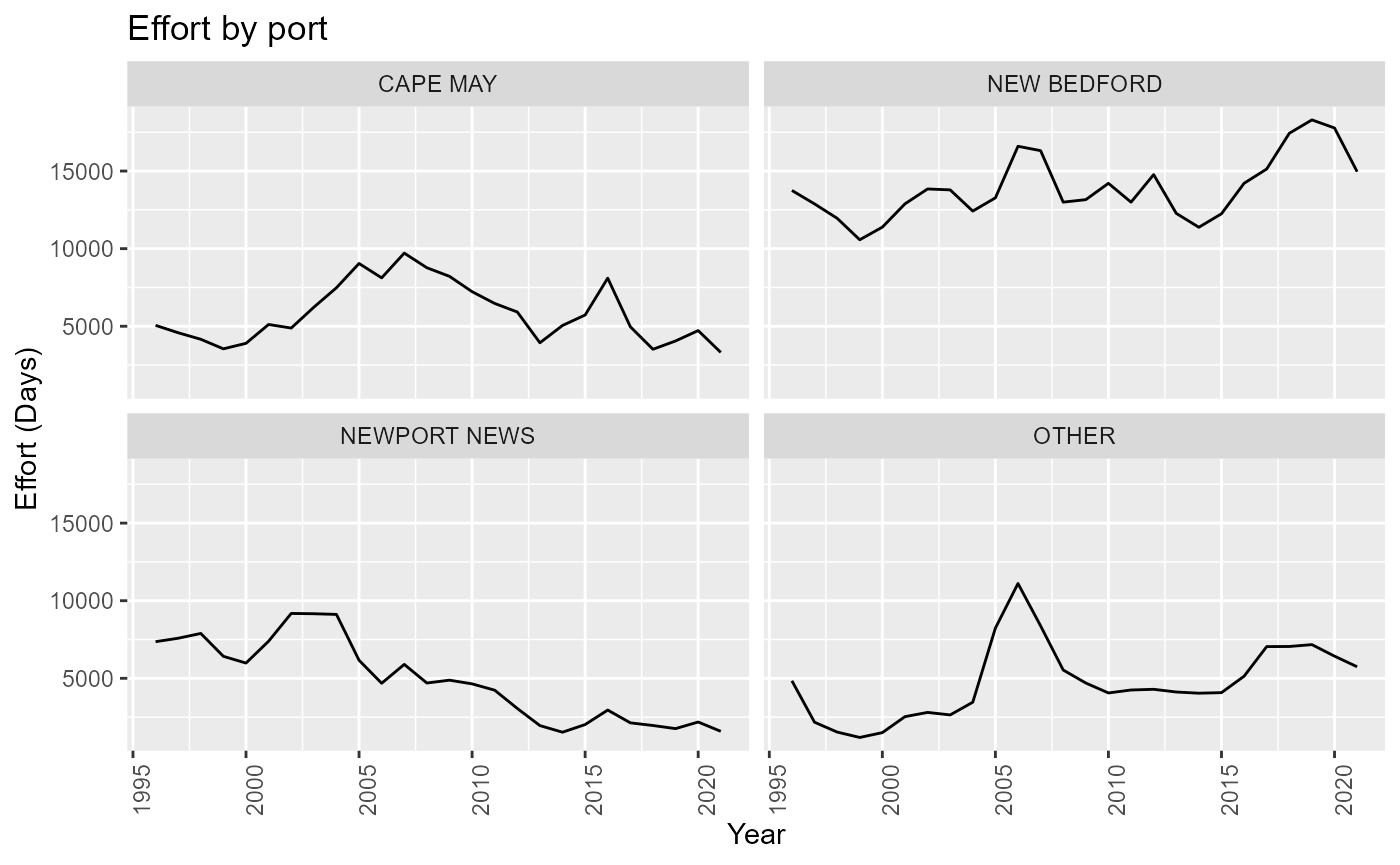
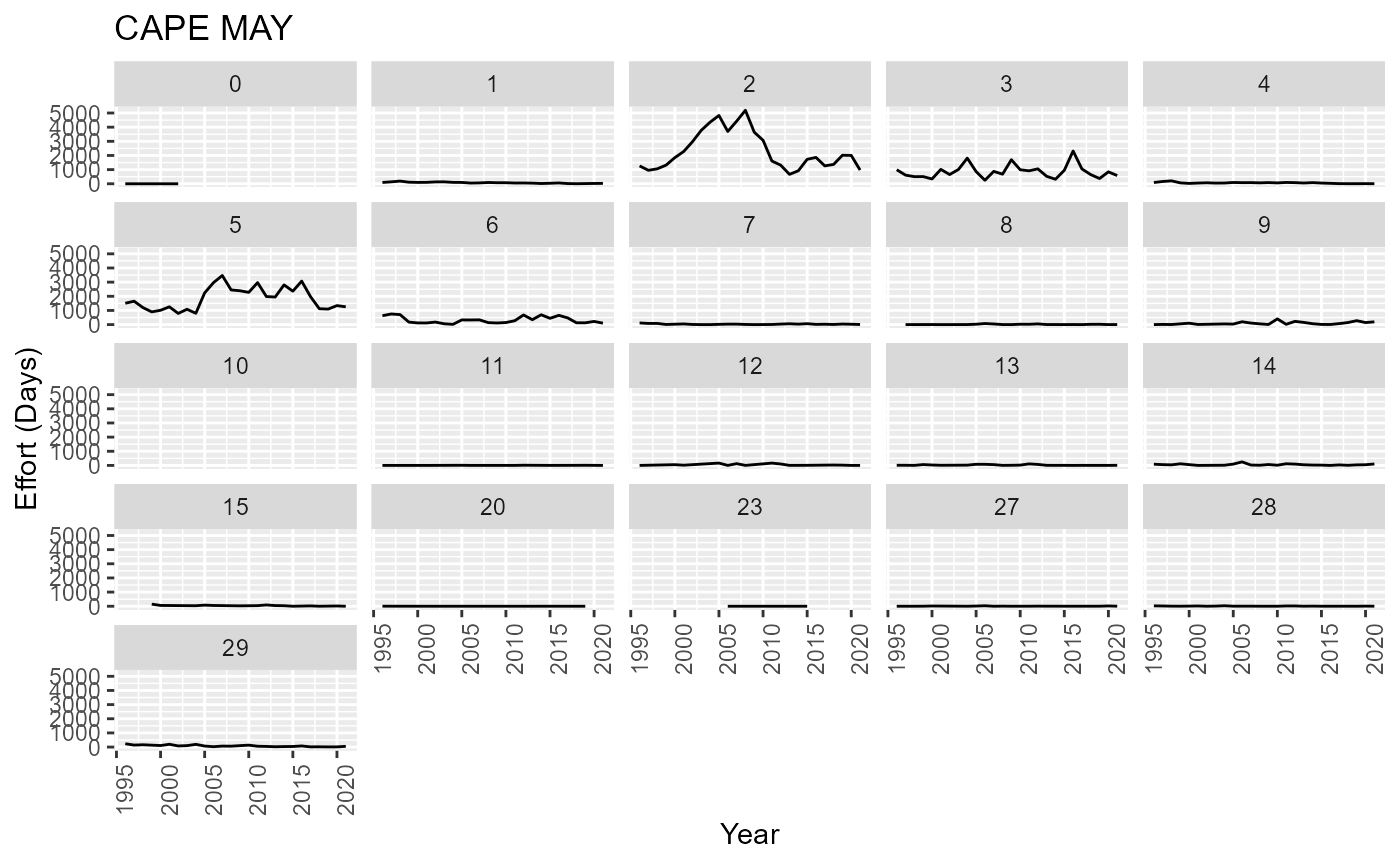
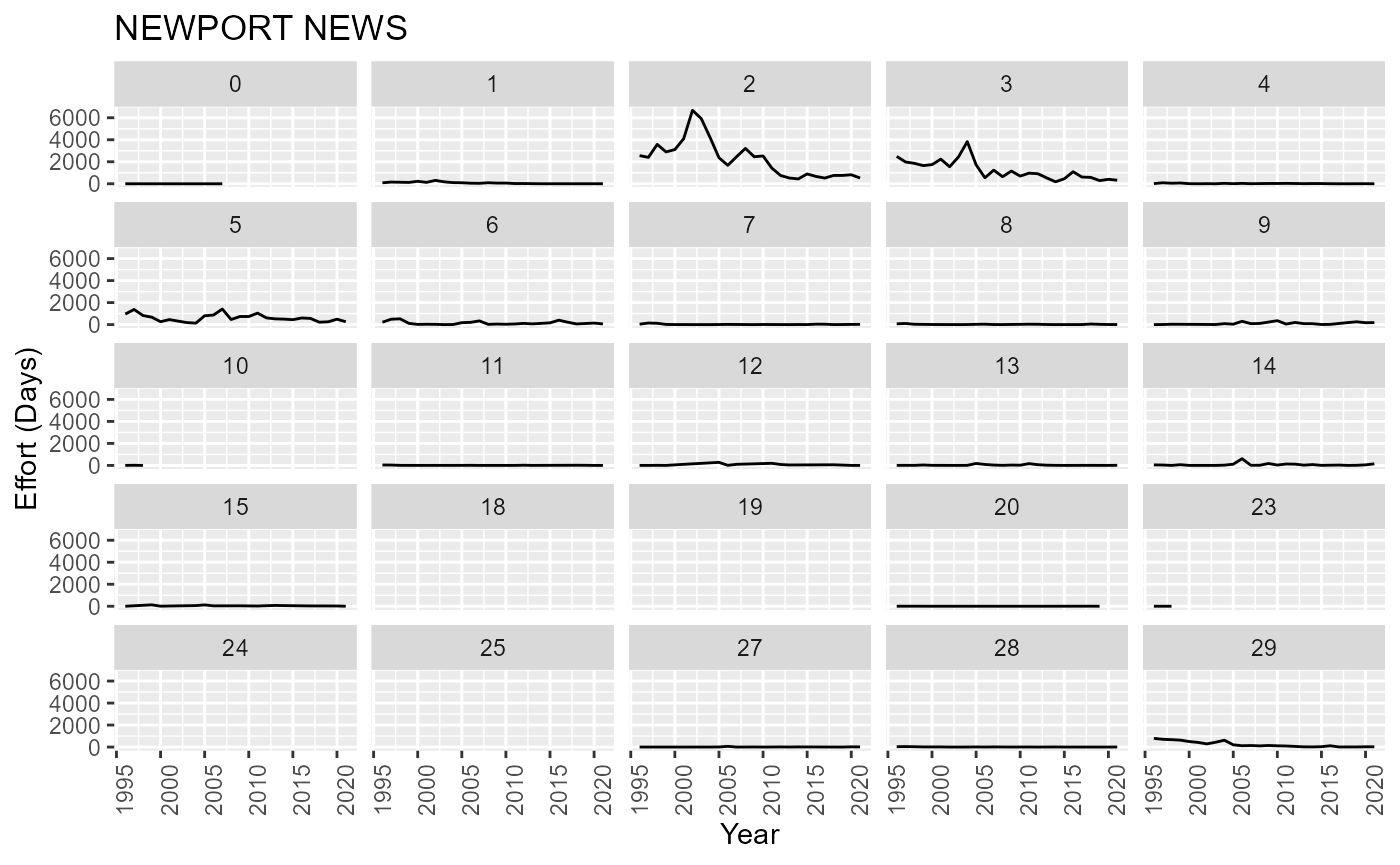
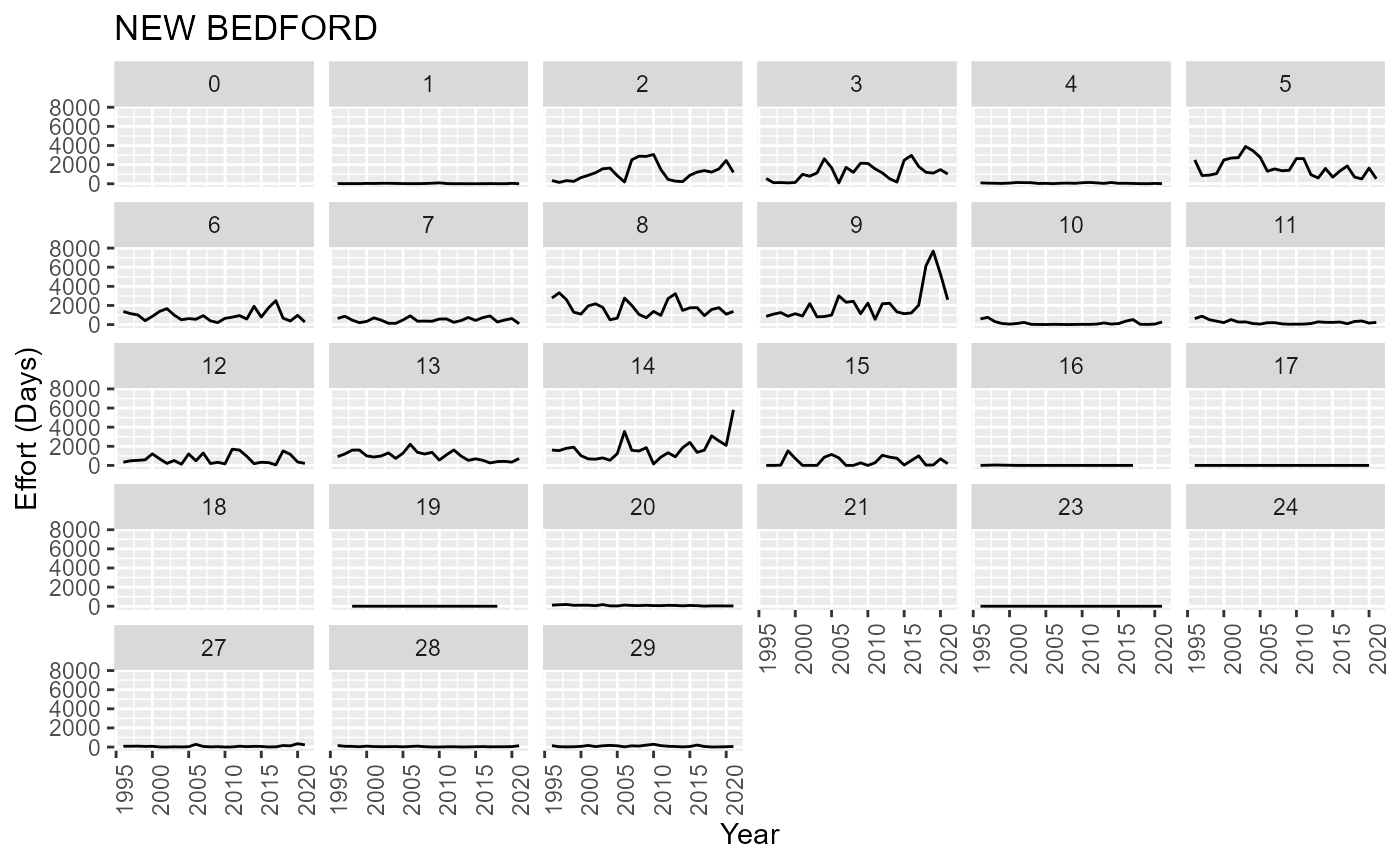
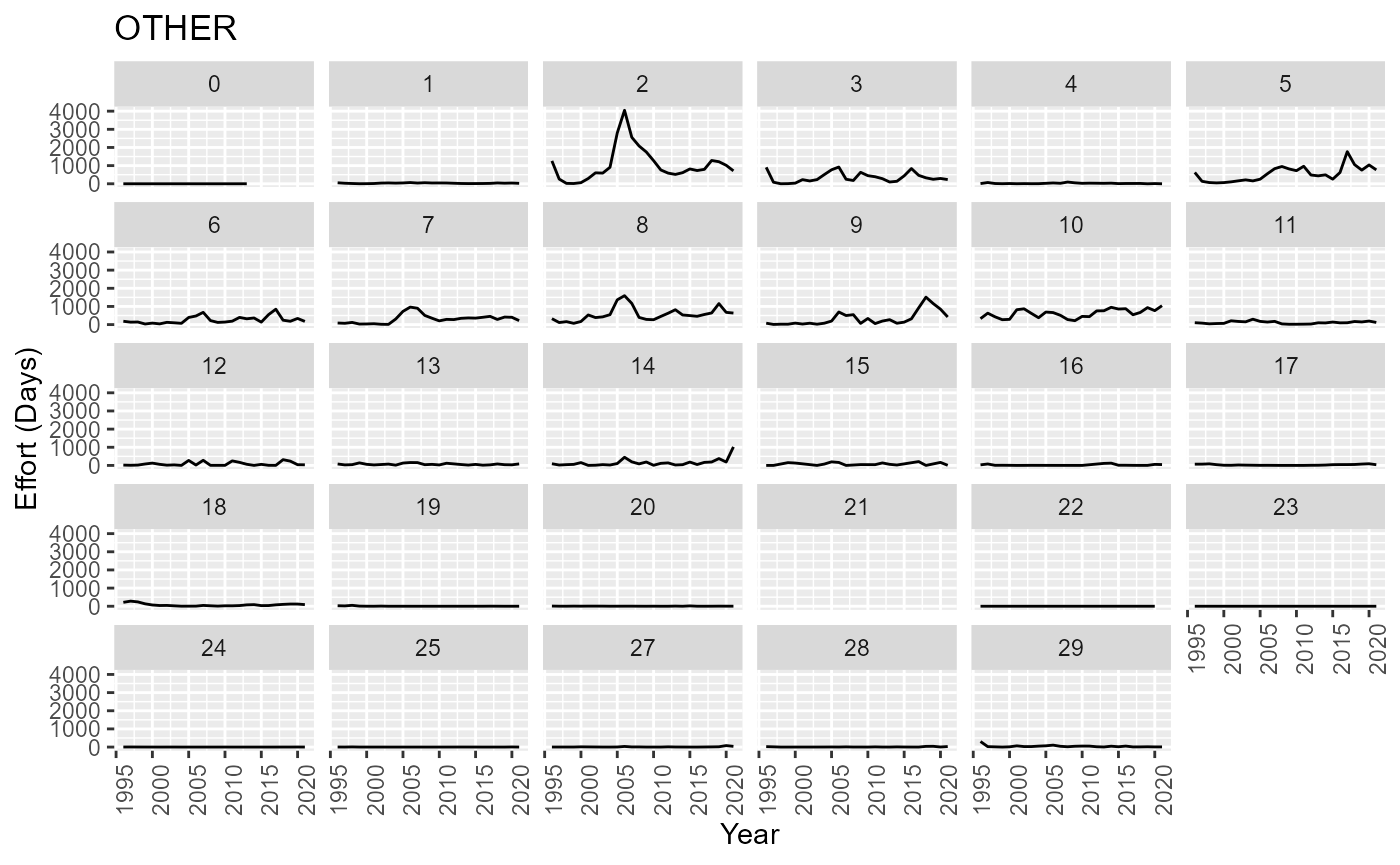
After aggregating the top ports based on the decisions found in this section {#sel} and combining all remaining ports into an “other fleet” we can look at the total effort by fleet in units: days at sea
#> Are landings in lbs or metric tons?
#> Calculating trip effort for main ports
#> calculating landings for main ports
#> calculating effort for other ports
#> calculating landings for other ports
#> combining all data
#> Are landings in lbs or metric tons?