Plots the food web associated with an Rpath object.
Arguments
- Rpath.obj
Rpath model created by
rpath().- eco.name
Optional name of the ecosystem. Default is the `eco.name` attribute from the rpath object created from running
rpath().- line.col
The color of the lines between nodes of the food web.
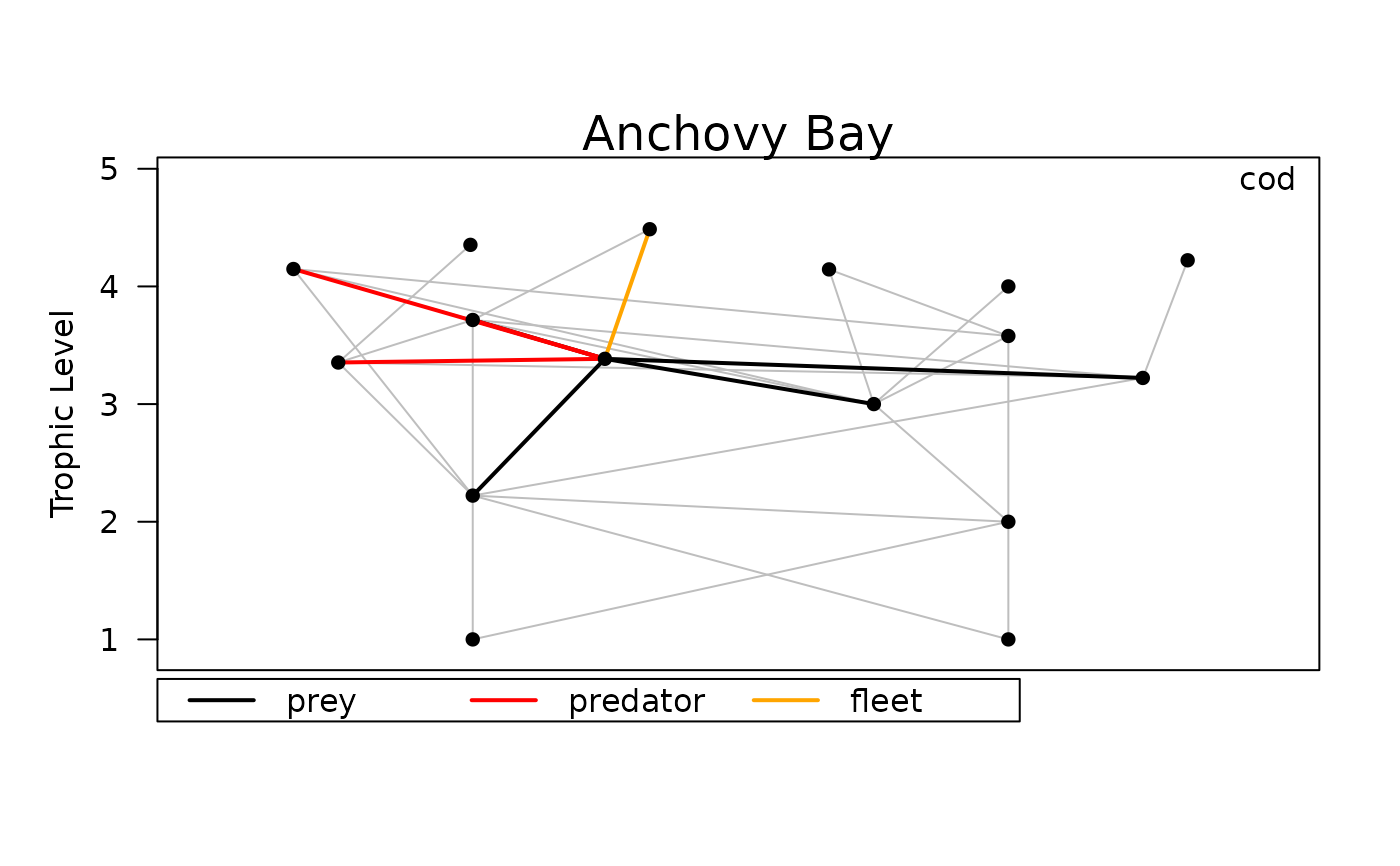
- highlight
Group number or name to highlight the connections of that group. Valid values are found in the `Group` field of the object created from running
rpath().- highlight.col
Color of the connections to the highlighted group, vector of length 3. Defaults to black for prey, red for predator, orange for fleet.
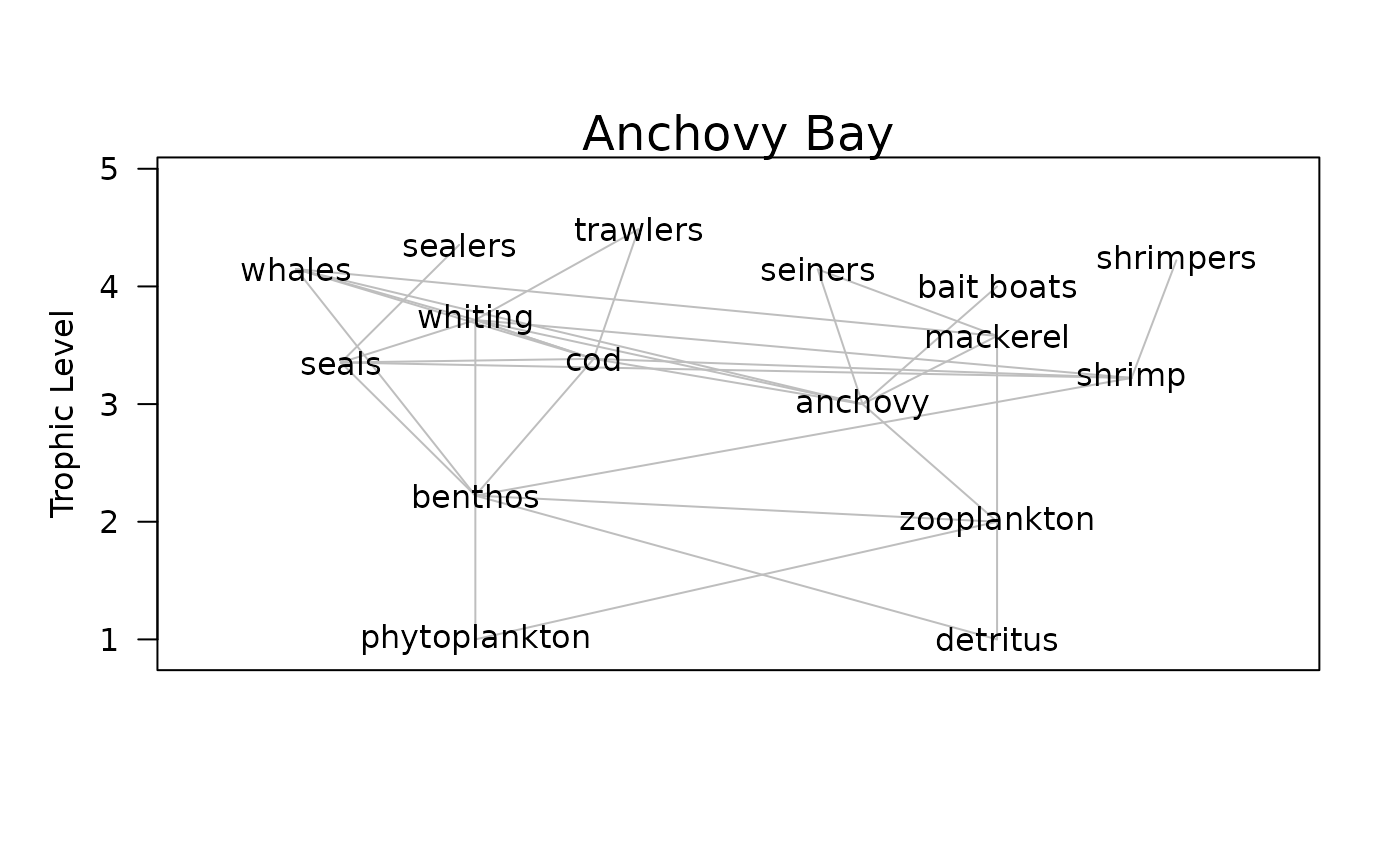
- labels
Logical whether or not to display group names. If
TRUEandlabel.pos= NULL, no points will be plotted, just label names.- label.pos
A position specifier for the labels. Values of 1, 2, 3, 4 indicate positions below, to the left of, above, and to the right of the points, respectively. A null value will cause the labels to be plotted without the points, assuming that
labels= TRUE.- label.num
Logical value indication whether group numbers should be used for labels instead of names.
- label.cex
Numeric value of the relative size of the labels within the plot.
- fleets
Logical value indicating whether or not to include fishing fleets in the food web plot.
- type.col
The color of the points corresponding to the types of the group. Must be of length 1 or 4. Color order will be consumers, primary producers, detrital, and fleet groups.
- box.order
Vector of box numbers to change the default plot order. Must include all box numbers
See also
Other Rpath functions:
MTI(),
check.rpath.params(),
create.rpath.params(),
frate.table(),
read.rpath.params(),
rpath(),
rpath.consumers(),
rpath.detrital(),
rpath.gears(),
rpath.groups(),
rpath.living(),
rpath.mixotrophs(),
rpath.producers(),
rpath.stanzas(),
stanzaplot(),
write.Rpath(),
write.rpath.params()
Examples
# Read in Rpath parameter file, generate and name model object
Rpath.obj <- rpath(AB.params, eco.name = "Anchovy Bay")
# Plot food web diagram with all groups labeled, including fleets
webplot(Rpath.obj, labels = TRUE, fleets = TRUE)

# Plot food web diagram without labels, highlighting connections of cod group
webplot(Rpath.obj, highlight = "cod",fleets = TRUE)
# Plot food web diagram without labels, highlighting connections of cod group
webplot(Rpath.obj, highlight = "cod",fleets = TRUE)