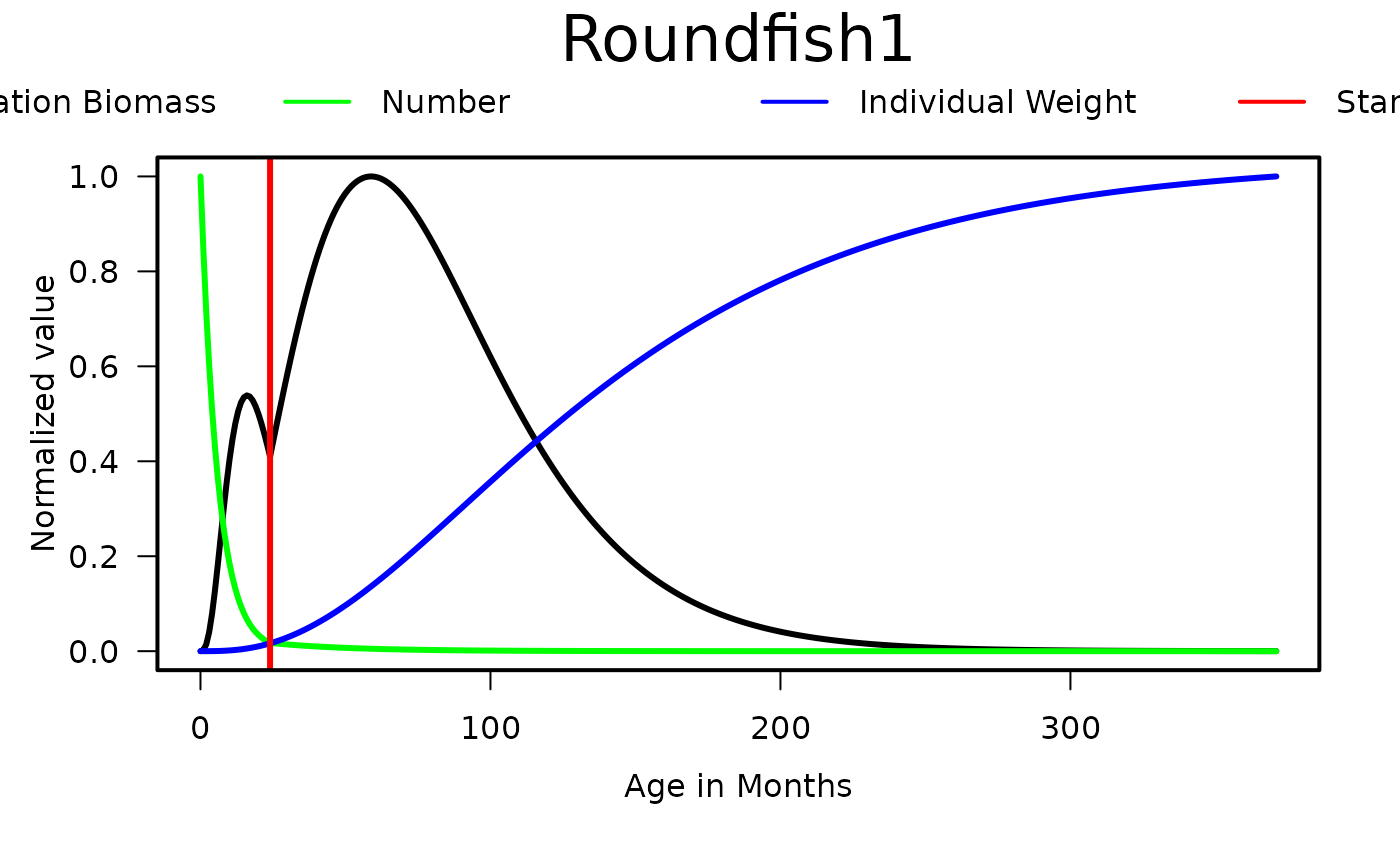
Plots the biomass composition of multistanza groups from an Rpath.stanzas object.
Usage
stanzaplot(
  Rpath.params,
  StanzaGroup,
  line.cols = c("black", "green", "blue", "red")
)
Arguments
- Rpath.params
R object containing the parameters needed to create a
Rpathmodel. This is generated either by thecreate.rpath.params()orread.rpath.params()functions.- StanzaGroup
The Stanza group's name to be plotted.Valid values are found in the `stanzas` field of the Rpath parameter file.
- line.cols
A vector of four colors used to represent the population biomass, relative number, individual weights, and stanza separation lines.
See also
Other Rpath functions:
MTI(),
check.rpath.params(),
create.rpath.params(),
frate.table(),
read.rpath.params(),
rpath(),
rpath.consumers(),
rpath.detrital(),
rpath.gears(),
rpath.groups(),
rpath.living(),
rpath.mixotrophs(),
rpath.producers(),
rpath.stanzas(),
webplot(),
write.Rpath(),
write.rpath.params()