These pages document decisions made regarding datasets and modeling for multispecies model keyruns for Georges Bank, USA. Methods documentation and eventually draft manuscripts will be found here too. The target date for initial model keyrun reviews is October 2022.
Model “keyruns” are defined as “standardized model runs updated with recent data, producing agreed output.” The ICES group WGSAM regularly reviews multispecies model keyruns using criteria found here (ICES, 2019).
Project overview
The overall goal of the MS-Keyrun project is to have multispecies modeling datasets and tools technically reviewed, and to receive recommendations for further development and testing prior to consideration for use by management bodies. This is of interest to both regional fishery management councils in the Northeast US.
Objectives
MS-Keyrun model development and testing objectives are based on general ecosystem based management questions as well as specific discussions regarding EBFM development in New England. We will use this as an opportunity to address questions about the effects of management on the broader ecosystem, and about performance of assessment tools.
- EBFM Objective 1: what happens with all the species in the region
under a certain management regime?
- Apply a full system model to assess “side effects” of target species management
- Ability to implement fishing and biological scenarios
- Hypothesis testing and MSE framework desirable
- EBFM Objective 2: how well do multispecies models perform for
assessment?
- Consider alternative model structures
- Biomass dynamics
- Size structured
- Age structured
- Evaluate data availability for each structure
- Evaluate estimation performance of each structure
- Evaluate uncertainty and sensitivity
- Evaluate feasibility of developing and using multi-model inference
- Consider alternative model structures
Place-based approach
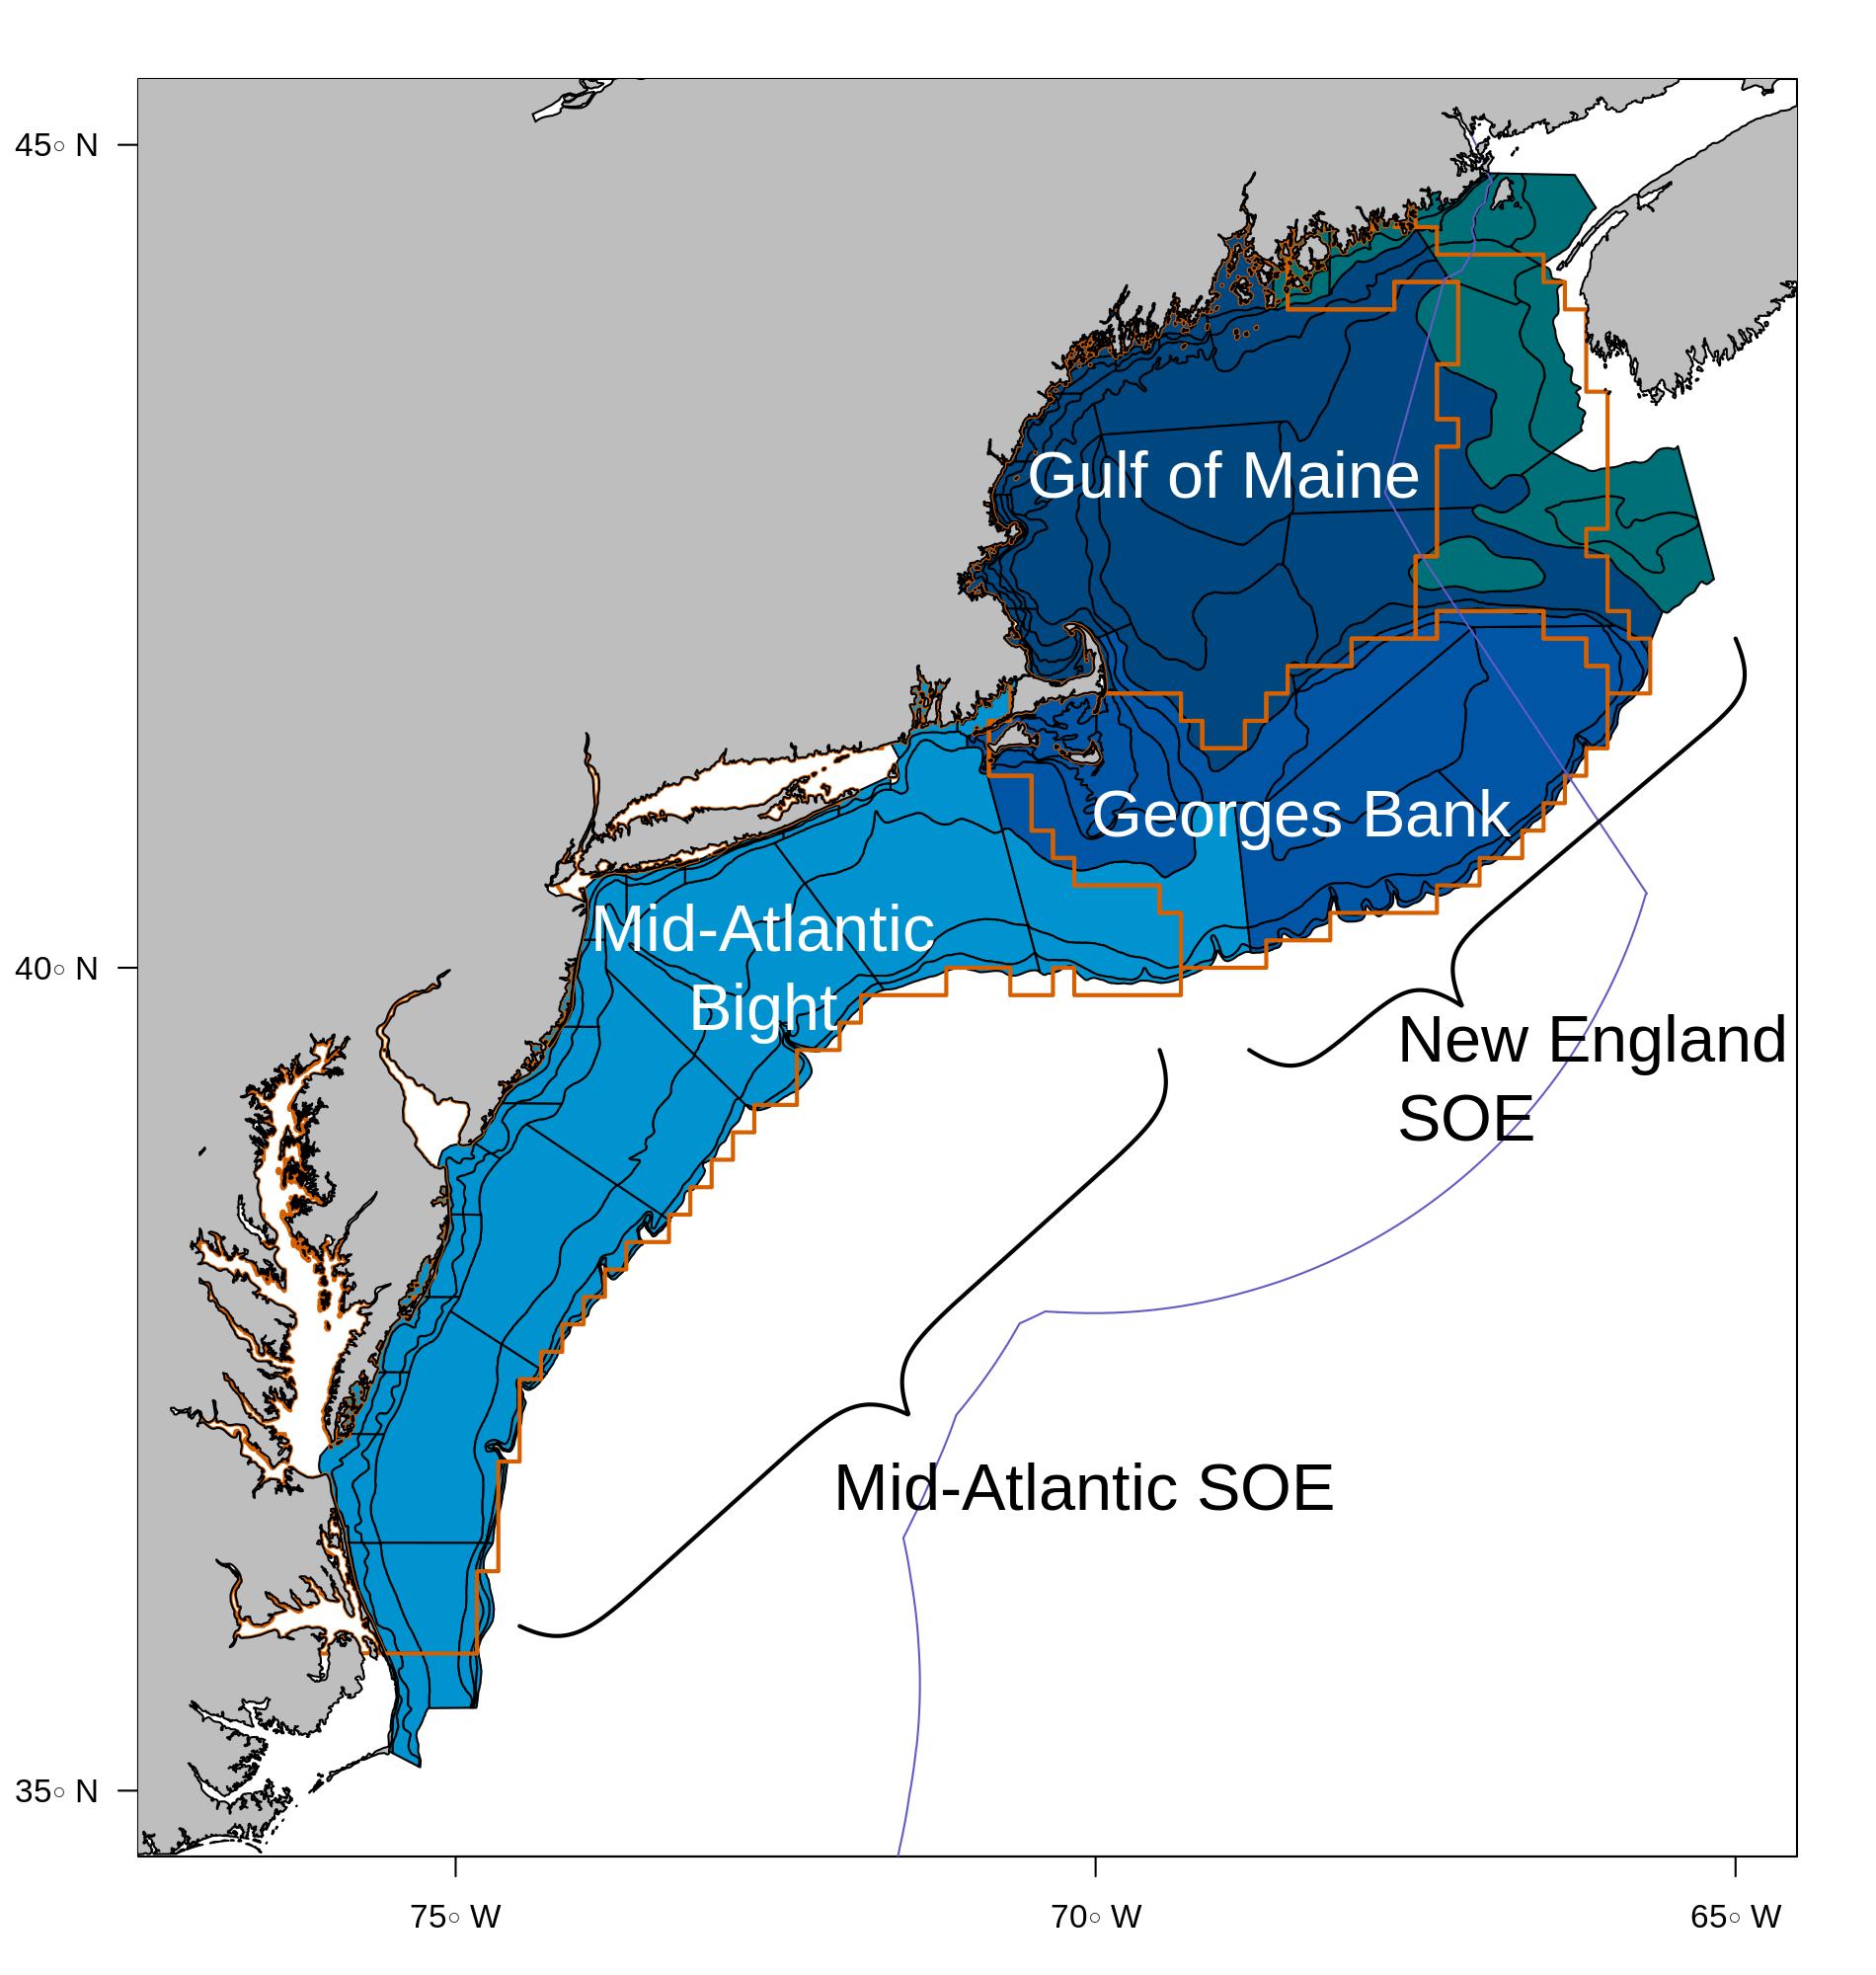
The project currently implements several place-based multispecies assessment models and one food web model. “Place-based” means a common spatial footprint based on ecological production, which contrasts with the current species-based management system of stock-defined spatial footprints that differ by stock and species. (See stock area comparisons.) Therefore, the input data for this project differs from the input data for most current stock assessments, and the results of these multispecies assessments are not directly comparable with current single species assessments. However, similar processes can be applied to evaluate these models. Georges Bank as defined for this project uses the NEFSC bottom trawl survey strata highlighted in medium blue below, which corresponds to the spatial unit for survey-derived ecosystem indicators in the Northeast Fisheries Science Center (NEFSC) New England State of the Ecosystem (SOE) report. Orange outlines indicate the ten minute square definitions for Ecological Production Units defined by a previous analysis.
Review process
While the models applied here have been published in some form, all were updated to include estimation capability, and other changes were made. Therefore, we seek a general review of these models. The U.S. National Research Council has guidelines for using models to support environmental regulation (NRC, 2007b) which have been adapted by ICES WGSAM. Reviews of relatively new models fall under the “constructed model review” category (NRC, 2007a).This means that for each model, reviews should evaluate:
- Spatial and temporal resolution
- Algorithm choices
- Assumptions (scientific basis, computational infrastructure;
adequacy of conceptual model)
- Data availability/software tools
- Quality assurance/quality control (code testing)
- Test scenarios
- Corroboration with observations
- Uncertainty/sensitivity analysis
- Peer review (previous)
Common attributes across models
A common dataset for 10 Georges Bank species has been developed, as
well as a simulated dataset for model performance testing. This
mskeyrun data package holds both datasets. All modeling
teams used these datasets. Group decisions on data are also documented
below.
Years: 1968-2019
Area: Georges Bank (see map above)
Species: Atlantic cod (Gadus morhua), Atlantic herring (Clupea harengus), Atlantic mackerel (Scomber scombrus), Goosefish (Lophius americanus), Haddock (Melanogrammus aeglefinus), Silver hake (Merluccius bilinearis), Spiny dogfish (Squalus acanthias), Winter flounder (Pseudopleuronectes americanus), Winter skate (Leucoraja ocellata), and Yellowtail flounder (Limanda ferruginea)
Decisions leading to this temporal, spatial, and species resolution are documented in detail at the links below.
Data needs
Decisions with meeting notes - 3 June 2020
Dataset dimensions
Year, season, area decisions - 8 July 2020
Fleet Definitions - 26 Feb 2021
Species, environment, data package decisions - 5 August 2020
Age, length, and diet composition decisions - 3 September 2020
Dataset source and methods documentation
Which Georges Bank survey footprint - 4 November 2020
Georges Bank data were derived from Northeast Fisheries Science Center (NEFSC) databases using R packages developed to improve efficiency and reproducibility. R packages survdat, comlandr, and mscatch were used to retrieve and aggregate data to be saved in mskeyrun.
Simulated dataset methods
The simulated dataset is based on output of the Norwegian and Barents Sea (NOBA) Atlantis model (Hansen et al., 2016, 2019). Atlantis is an end-to-end spatial ecosystem model capable of including climate effects, seasonal migration, food web, and fishery interactions (Audzijonyte et al., 2019). The simulated dataset contains comparable survey, fishery, and composition data as the Georges Bank dataset, but the time series span 80 simulation years and include 11 species. This dataset was used for initial model development, code quality testing, and model skill assessment by the modeling teams. Details of the dataset are available in the link.
Dataset structure
The data package mskeyrun was developed in R (R Core Team, 2022).
Individual data products include survey indices, survey length and age
compositions, survey diet compositions, fishery indices, fishery length
and age compositions, and additional biological parameters
(length-weight). All mskeyrun datasets are listed here:
Models
For the October 2022 review, three models are presented:
- Multispecies surplus production model (MSSPM)
- Multispecies length-structured model (Hydra)
- Full food web model (RPath)
Model documentation
Multispecies surplus production model (MSSPM)
The reviewed model is based on the simulation model MS-PROD (Gamble & Link, 2009), implemented in C++. Multi-species surplus production models can be used to quantify species interactions, and because of their focus on minimal population structure, the barriers to begin modeling are surmountable due to lower data needs for each species than a corresponding age-structured assessment model. Generally, these include: biomass or survey index time series, catch data time series, spatial overlap and food habits information (for competitive and predation interactions). MS-PROD has previously been used in simulation analyses addressing aggregate fish production and marine mammal interactions in the Northeast US and on Georges Bank (S. Gaichas et al., 2012; Smith et al., 2015).
The Multi-Species Surplus Production Model (MSSPM) software enables a user to build discrete-form single species and multi-species surplus production models. The software allows a user to 1) define a model, using choices of growth, harvest, competition, and predation forms, 2) run the model, which estimates the necessary parameters using choices for optimization algorithms, and 3) visualize the estimated data. A user can conduct diagnostic testing of a fitted model including retrospective analysis and parameter profiling. Forecasts may be generated using the estimated parameters and additional harvest and uncertainty parameters. The software has a specialized user interface, the REsource Management Options Review and Analysis (REMORA) tool that allows a non-technical user to explore fisheries management policy under different types and levels of uncertainty.
Multispecies length-structured model (Hydra)
The reviewed model is based on the simulation model Hydra (S. K. Gaichas et al., 2017), implemented in ADMB (Fournier et al., 2012). Hydra’s structure is derived from the length-based multispecies simulation model, LeMANS (Hall et al., 2006; Rochet et al., 2011), with additional options for growth, and recruitment functional forms and more detailed fishing fleets. Hydra simulations have previously been used to support EBFM analyses for the New England Fishery Management Council, and were reviewed in 2018 as part of an Ecosystem Based Management Strategy Review for Georges Bank.
A key feature of Hydra that differentiates it from LeMANS and other length-based models is its treatment of length information. Attempting to balance model complexity and run time with available data and adequately modeling length-based processes, Hydra applies an equal number of length bins to all modeled species. The modeler specifies the overall number of bins (5 in the original simulation model), and the size in cm spanned by each bin for each species. The original Hydra simulation model used narrower length bins for smaller fish sizes and a length bin spanning a wider range of sizes for larger fish to efficiently represent changes size selectivity of predators and fisheries. The estimation model uses equal width bins equally dividing each species’ maximum observed length into the overall number of bins.
Modeler decisions on length bin number and width combined with individual species growth parameters both contribute to the model temporal scale, which internally calculated and set equal to the time required for the fastest-growing species to grow out of its smallest length bin (if that is less than one year). Therefore, model timesteps will never exceed one year, but can be subannual.
For this review, the simulation model code was forked and an objective function added, with modifications to the data section to accommodate new data inputs and to the parameter section to estimate fishery and survey selectivity and catchability. As an estimation model, Hydra can be fitted to multiple data streams. Currently the objective function comprises the following components, catch (by species for each fleet), size composition of the catch (by species for each fleet), survey abundance index (by species for each survey), survey size composition (by species for each survey), survey diet composition (stomach weight by predator size bin for each predator species and survey), and recruitment (annual deviations from mean recruitment by species). A detailed description of the objective function equations is available here.
Hydra input files were developed directly from mskeyrun
datasets by modifying functions in Andy Beet’s hydradata R
package. The function create_Rdata_mskeyrun.R (code)
allows the user to specify whether datasets should be constructed from
Atlantis-simulated or real Georges Bank data, and the number of length
bins to use for composition data, then creates an R data object. This
data object is then used to create data and parameter input files using
the function hydradata::create_datpin_files().
Hydra output visualizations were developed to evaluate model fits with different settings and input datasets. The current diagnostics include model fits to each survey index, model fits to catch by fleet, comparisons of estimated and observed length compositions by year and in aggregate across years for each modeled species, residuals of fits to length compositions, and comparisons of estimated and observed diet composition. In addition, model outputs of estimated recruitment, total biomass, fishery and survey selectivity, fishing mortality, and predation mortality are produced. Initial model skill assessment compares model output total biomass with known total biomass for the simulated datasets.
All model code, data processing, and visualization is available online:
- Hydra model estimation version code https://github.com/thefaylab/hydra_sim
- Hydra estimation model data file generation https://github.com/thefaylab/hydradata
- Hydra model diagnostics https://github.com/thefaylab/hydra_diag
Full food web model (RPath)
The reviewed model is based on a Georges Bank parameterization of Rpath (Lucey et al., 2020), a food web model implemented in R (R Core Team, 2022). Rpath includes formal capability for MSE (Lucey et al., 2021), making it an ideal tool for the objectives of this project. Previous food web modeling efforts in the Northeast US included Georges Bank (J. Link et al., 2008; J. S. Link et al., 2006), but evaluated food web structure and response to perturbations at a more aggregated taxonomic level.
Results
Individual model results
These are overviews of what will be presented that will be updated throughout the meeting, with more details available in the google drive set up for reviewers.
Multispecies surplus production model (MSSPM)
The software was previously presented and the framework was reviewed to the WGSAM in 2021. For that review we implemented a process of 3-levels of simulation testing for this modeling software: comparison testing, integration testing, and skill assessment. Comparison testing used simulated data from an operating model with the same structure as used in the software with known parameter values, known harvest time series, and known biomass time series (without and with uncertainty). Integration testing uses simulated data from an operating model with a different structure (Norwegian Barents Atlantis Model, NOBA) thus different parameters, and known catch and biomass time series without uncertainty to demonstrate that software modules (e.g., parameter estimation, diagnostics, forecasting/projection) produce reasonable results. Skill assessment uses simulated data from an operating model with a different structure (NOBA) thus different parameters, and catch and biomass index time series with uncertainty. For comparison testing, MSSPM fits the operating model perfectly (\(r^2\)=1.00) for data without uncertainty, and fits decrease as uncertainty increases in biomass time series (e.g., with cv=0.5, \(r^2\) ranges from 0.50 to 0.60). For integration testing, the best fit model \(r^2\) was 0.44.
All Georges Bank models are developed using catch data to drive the
dynamics and survey indices (relative biomass) data for fitting. Harvest
data (mskeyrun::catchIndex.rda) was used to drive the model
dynamics. A combined survey index
(mskeyrun::surveyIndexAll.rda) was used for the relative
biomass time series to fit the model to. A model-derived bottom
temperature index was tested as a covariate to influence carrying
capacity and population growth rates of some species. The time period of
the model is 1969-2019. Four test scenarios were conducted to compare
basic surplus production models with and without environmental
covariates and predation.
Multispecies length-structured model (Hydra)
Hydra model diagnostics and progress fitting to three datasets will
be presented:
* Simulated data with 5 length bins
* Simulated data with 10 length bins
* Georges Bank data with 5 length bins
We use 5 length bins as a starting structure for fitting the Georges Bank data because the simulation model Hydra used 5 length bins. We do not consider any of these models fully converged as keyruns, rather the diagnostics with each dataset are intended to give insight into model behavior and performance.
Specifically, the simulated datasets with different numbers of length bins are intended to evaluate model sensitivity to this choice of input data structure and tradeoffs with overall performance. These datasets also allow preliminary comparisons with true Atlantis quantities (biomass, recruitment, diet) as a step towards skill assessment. Sensitivity of the model to the Other food parameter was identified as a high priority in the 2018 simulation model review, and is being evaluated with the simulated dataset.
Fits to the real Georges Bank data have just begun, and have already highlighted several implicit assumptions in the Hydra model code that have been addressed. The time period for modeling has been adjusted to 1978-2019 to avoid starting the model with extremely high catches observed 1968-1977.