Allocate landings to Georges Bank EPU
Source:vignettes/allocateLandingsEPU.Rmd
allocateLandingsEPU.RmdSpatial: Approaches for Georges Bank Option 1
The spatial footprint for the Georges Bank EPU (Ecological Production Unit) is defined as the set of survey strata that are at 50% within the 10 min square definition of the EPU.
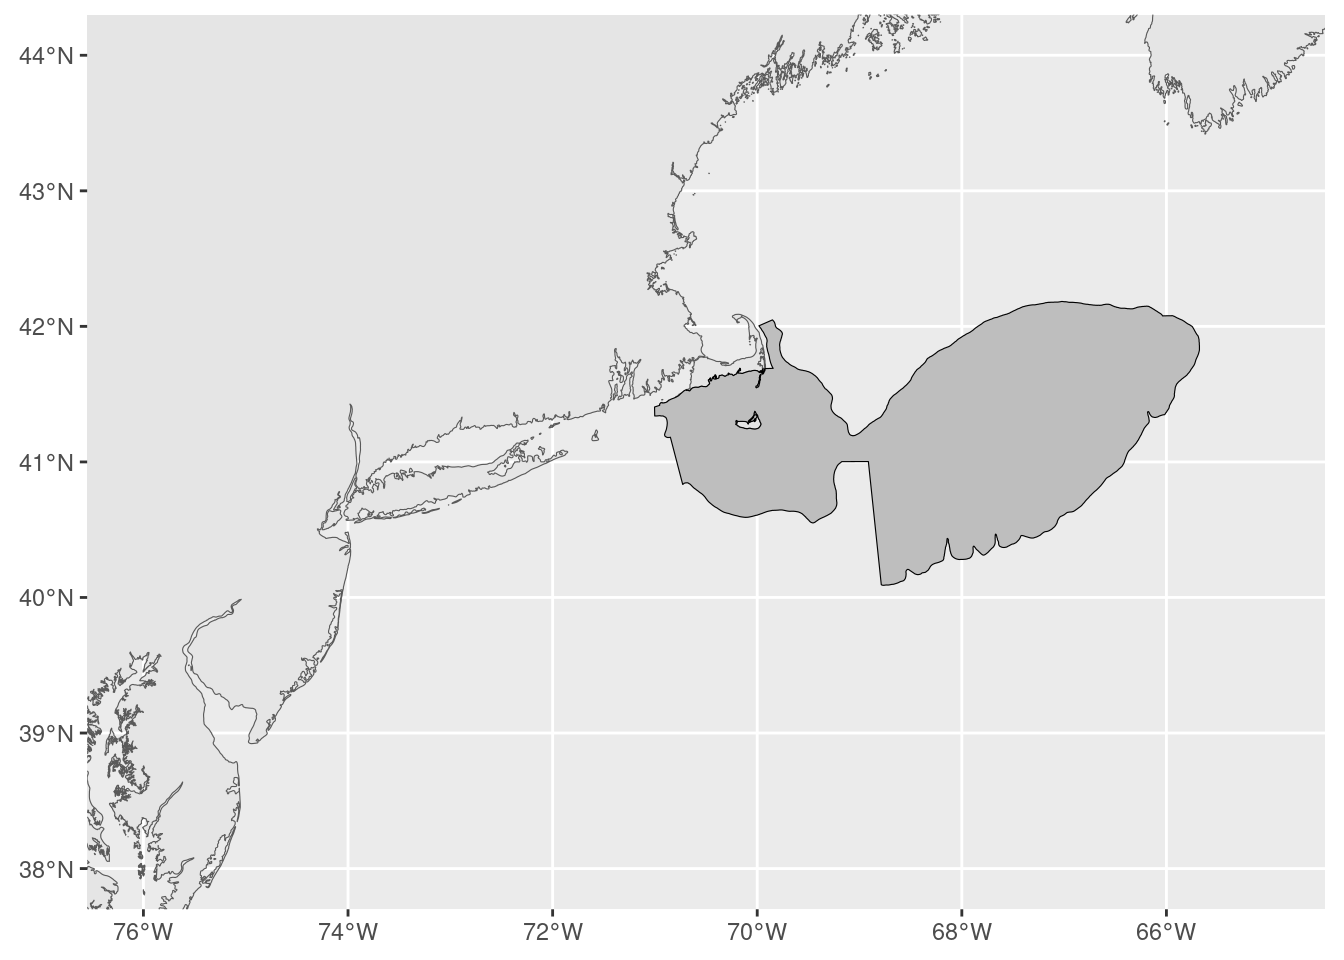
Figure 1: Georges Bank EPU
Overlay the surrounding statistical areas:
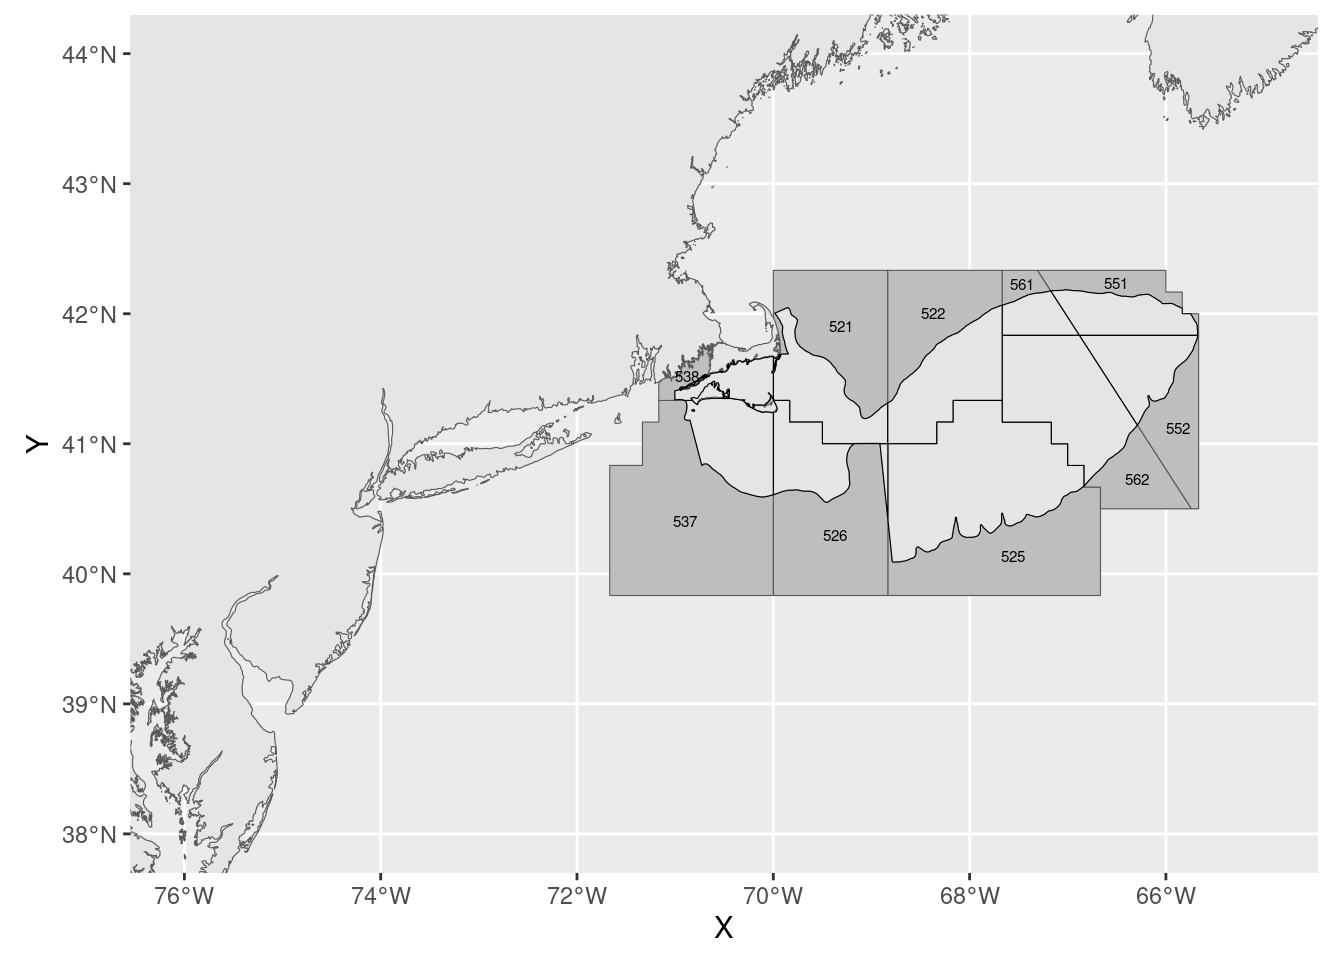
Figure 2: Statistical areas intersected by Georges Bank EPU
Fishing data are available by statistical area. The statistical areas surrounding Georges Bank EPU (521, 522, 525, 526, 537, 538, 551, 552, 561, 562) contain catch from Georges Bank and its neighboring EPUs. This data needs to be partitioned and catch allocated to the Georges Bank EPU.
Method for partitioning catch data
Methods found in (Benjamin, S et al., 2018; DePiper, 2014) and the offshoreWind package are briefly summarized below. It is necessary to run the package from the mars server.
VTR data are joined with observer data (since observer data is considered reliable). A duration model is fitted to characterize a spatial footprint (rather than a single point location) associated with a trip (DePiper (2014)). Gear type and trip length (which includes multiple hauls) influence the spatial precision.
The duration model is then broadly applied to all VTR data. The result being a set of maps (or rasters). Each map/raster depicts the spatial probability of fishing for a trip.
The
offshoreWindpackage then uses these rasters combined to determine the landings assigned to any spatial footprint supplied. This is achieved by calculating the overlap of the rasters with the user supplied spatial footprint.
The shape file shown in Figure 2 is supplied to the offshoreWind package and the landings with each statistical area (for each year) are then allocated to each portion of a statistical area (within Georges Bank and outside Georges Bank). The proportion of landings attributed to Georges Bank are then calculated and displayed below.
The top ranked species of interest are shown below. Each panel depicts the proportion of landings (for each species) in Georges Bank relative to the statistical area.
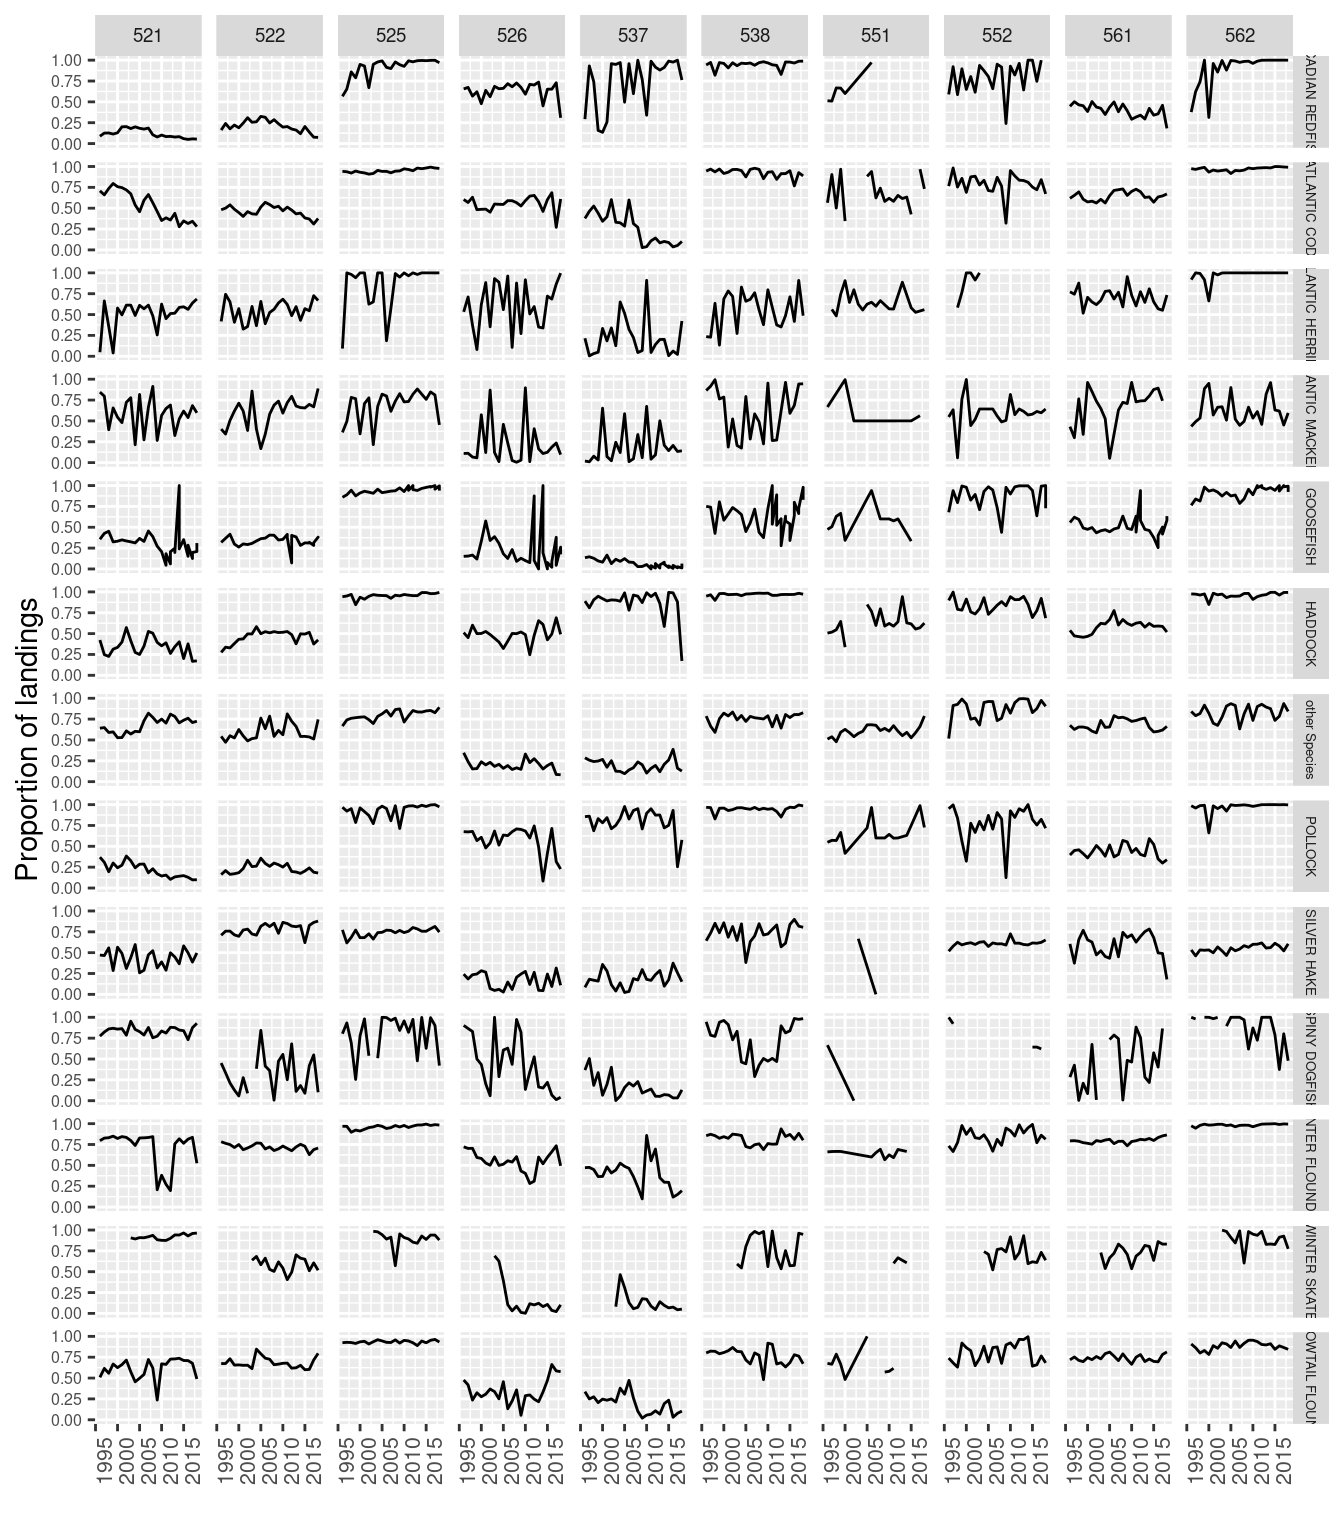
Figure 3: Proportion of landings in GB relative to statistical area
The total landings of each species by stat area is shown below. This should ideally be compared to landings from comlandr. We should also determine how landings on the Canadian side of the Hague line should be handled
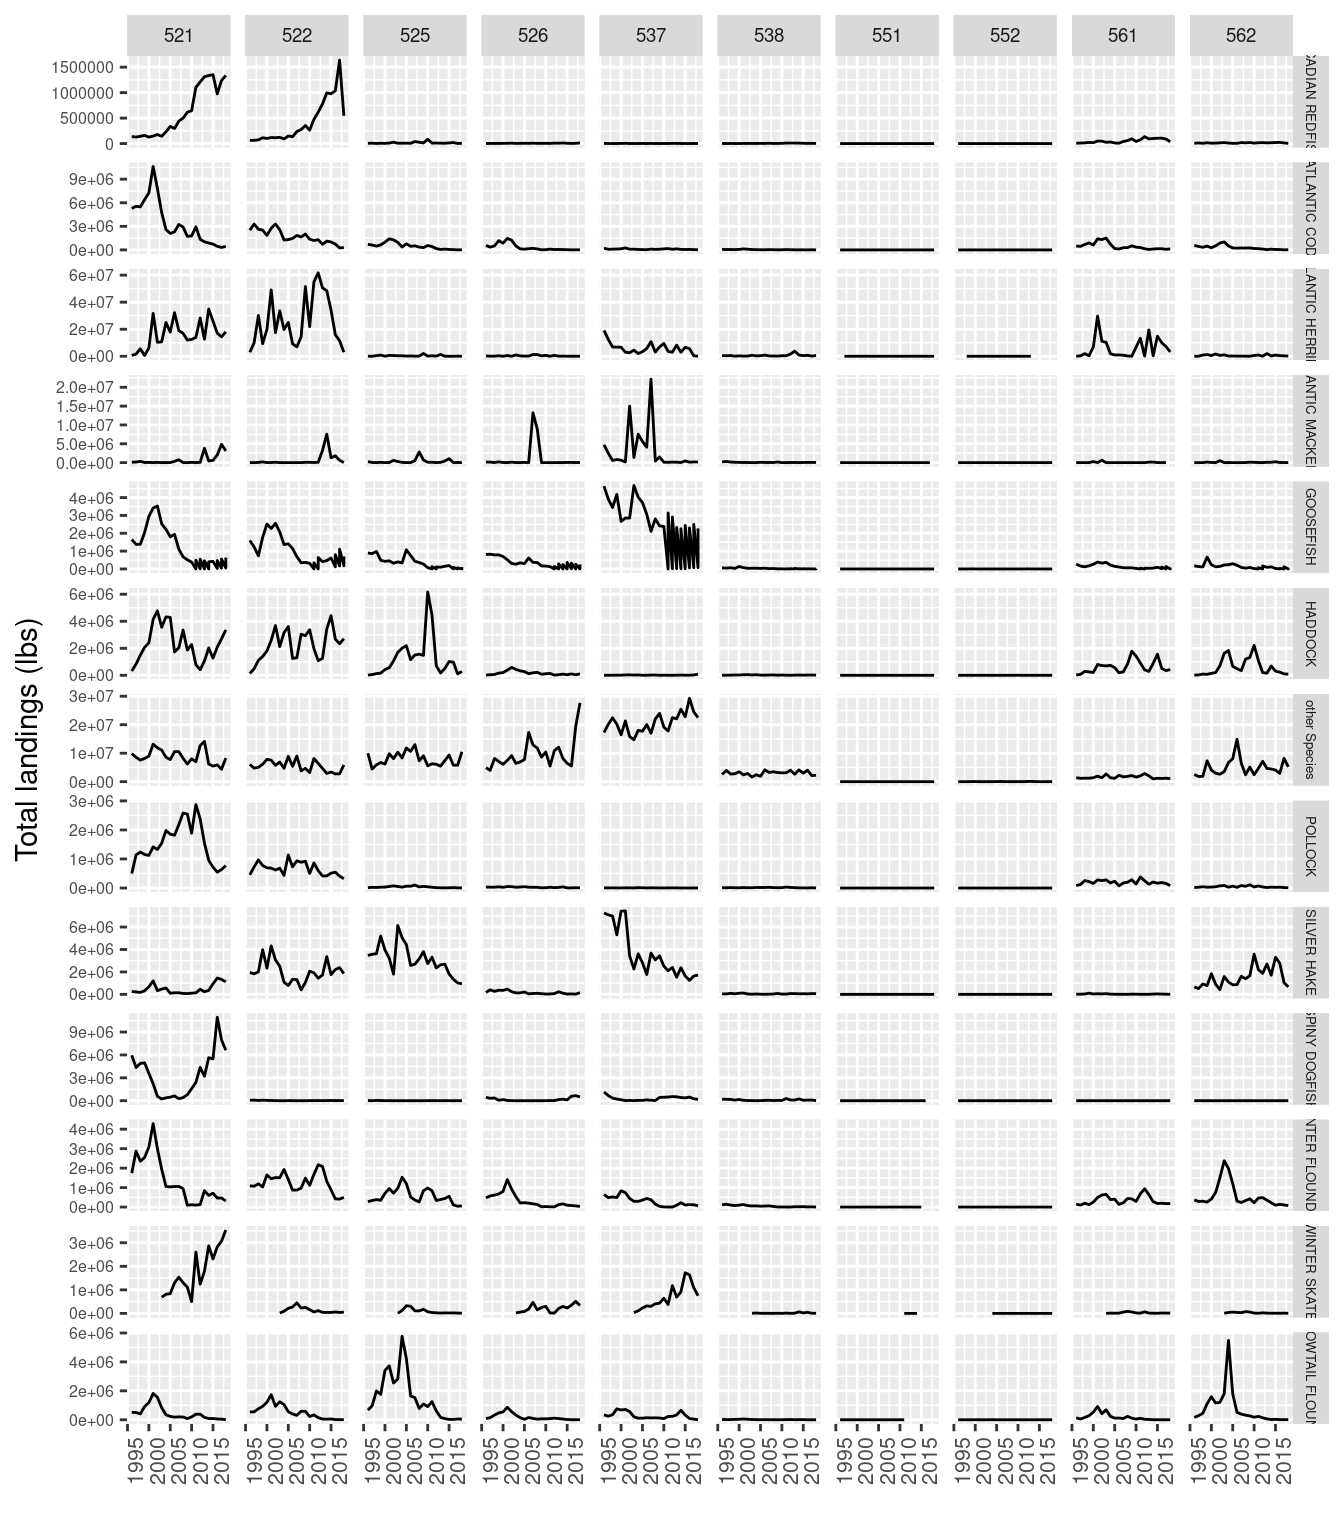
Figure 4: Total landings by statistical area
The majority of landings (for a species) occurs in statistical areas where the proportion allocated to Georges Bank is fairly constant.