class: right, middle, my-title, title-slide .title[ # Northeast Fisheries Science Center <br />Ecosystem Modeling Update ] .subtitle[ ## NEMoW 6, ToR 1<br /> 29 August 2023 ] .author[ ### Sean Lucey, Presenter<br /><br /><br />Contributors: Brandon Beltz, Andy Beet, Joe Caracappa, Kiersten Curti, Gavin Fay (UMass Dartmouth),<br />Sarah Gaichas, Robert Gamble, Ron Klasky (S&T), Scott Large, Sean Lucey, Maria Cristina Perez (UMass Dartmouth),<br />Howard Townsend (S&T), Sarah Weisberg (Stony Brook U) ] --- class: top, left # Updates .pull-left-40[ ## Since NEMoW 5 in 2019 * Atlantis `\(^{*+}\)` * Rpath `\(^{*+}\)` * MS-Keyrun project, ICES WGSAM review `\(^+\)` * Multspecies model skill assessment `\(^+\)` * Multspecies MSE `\(^+\)` `\(^*\)` climate-y `\(^+\)` management-y ] .pull-right-60[  .right[.contrib[https://xkcd.com/1328]] ] ??? Everyone loves an update --- # Atlantis NEUSv2: **major** update .pull-left[  ] .pull-right[  .right[.contrib[https://xkcd.com/2224]] ] ??? ATLANTIS MODELERS--WE SEE YOU --- background-image: url("https://ars.els-cdn.com/content/image/1-s2.0-S030438002200148X-gr3_lrg.jpg") background-size: 500px background-position: right # Atlantis NEUSv2: **major** update .pull-left[ ## From Joe on Wednesday x2 * Forcing with GLORYS12V1 and primary production in the newly calibrated model <a name=cite-caracappa_northeast_2022></a>([Caracappa, et al., 2022](https://www.sciencedirect.com/science/article/pii/S030438002200148X)) ## From Andy on Thursday * Running in the cloud ## In progress * Sensitivity to fishing scenarios * Testing ecosystem overfishing indicators for the Northeast US * Integrating spatial fleets and ports of origin * Climate projections using MOM-6 planned .footnote[https://github.com/NOAA-EDAB/neus-atlantis] ] .pull-right[] --- background-image: url("https://github.com/NOAA-EDAB/presentations/raw/master/docs/EDAB_images/Balance_concept.png") background-size: 700px background-position: right # Rpath: AFSC collaboration .pull-left-40[ ## From Sean and Kerim on Thursday * How to Rpath <a name=cite-lucey_conducting_2020></a>([Lucey, et al., 2020a](http://www.sciencedirect.com/science/article/pii/S0304380020301290)) ## More than EwE in R * MSE capability <a name=cite-lucey_evaluating_2021></a>([Lucey, et al., 2021](http://www.sciencedirect.com/science/article/pii/S0165783620302976)) * [Rpath MSE course code](https://github.com/thefaylab/cinar-mse-projects/blob/main/multispecies/RpathOM_HCR_PSPS.md) ## In progress * Documentation/vignettes * (AFSC) Ecosense and fitting integration * New regional models (next slides) * Georges Bank Rpath part of MS-Keyrun project (next next slides) * Food web risk indicators planned .footnote[https://github.com/NOAA-EDAB/Rpath] ] .pull-right-60[] --- background-image: url("https://raw.githubusercontent.com/NOAA-EDAB/presentations/master/docs/EDAB_images/BeltzMABrangeshiftdiet.png") background-size: 700px background-position: right # Rpath: Mid Atlantic .pull-left-40[ Brandon Beltz MS thesis *Food web impacts of warming-driven migration shifts of top predators in the Mid-Atlantic Bight (MAB)* * Shifts in migration range had more impact than shifts in migration timing * Non-prey species showed large changes in biomass in response to changes in predator migration. This suggests strong indirect effects are occurring and shows the more intricate ways that the food web can respond to change ] .pull-right-60[] --- background-image: url("https://raw.githubusercontent.com/NOAA-EDAB/presentations/master/docs/EDAB_images/Weisberg_PopDy_Poster_2023.png") background-size: 700px background-position: right # Rpath: Gulf of Maine .pull-left-40[ Sarah Weisberg PhD thesis section/PopDy Fellowship *Advancing Climate-Informed, Ecosystem-Based Fisheries Management Through Food Web Modeling, Indicator Development And Risk Analysis In The Rapidly Warming Gulf Of Maine* * Ecological network analysis shows regimes in Gulf of Maine food web efficiency/resilience. Highly efficient food webs have lower resilience due to fewer trophic pathways decreasing redundancy. * The Gulf of Maine had low resilience in the 2000s, corresponding to poor fish condition .footnote[p.s. [Shiny GOM used in IEA course](https://connect.fisheries.noaa.gov/content/6c128564-f8b2-49c4-8afc-614f9e2e7a5b/)] ] .pull-right-60[] --- # MS-Keyrun project: EBFM Objectives in the Northeast US * EBFM Objective 1: what happens with all the species in the region under a certain management regime? + Apply a full system model to assess "side effects" of target species management + Ability to implement fishing and biological scenarios + Hypothesis testing and MSE framework desirable * EBFM Objective 2: how well do multispecies models perform for assessment? + Consider alternative model structures + Biomass dynamics + Size structured + Age structured + Evaluate data availability for each structure + Evaluate estimation performance of each structure + Evaluate uncertainty and sensitivity + Evaluate feasibility of developing and using multi-model inference ??? MS-Keyrun model development and testing objectives are based on general ecosystem based management questions as well as specific discussions regarding EBFM development in New England. We will use this as an opportunity to address questions about the effects of management on the broader ecosystem, and about performance of assessment tools. --- background-image: url("https://raw.githubusercontent.com/NOAA-EDAB/presentations/master/docs/EDAB_images/EPU_Designations_Map.jpg") background-size: 650px background-position: right ## Place-based approach .pull-left-40[ "Place-based" means a common spatial footprint based on ecological production, which contrasts with the current species-based management system of stock-defined spatial footprints that differ by stock and species. The medium blue area in the map is Georges Bank as defined by NEFSC trawl survey strata. SOE = State of the Ecosystem report *The input data for this project differs from the input data for most current stock assessments, and the results of these multispecies assessments are not directly comparable with current single species assessments.* ] .pull-right-60[ <!--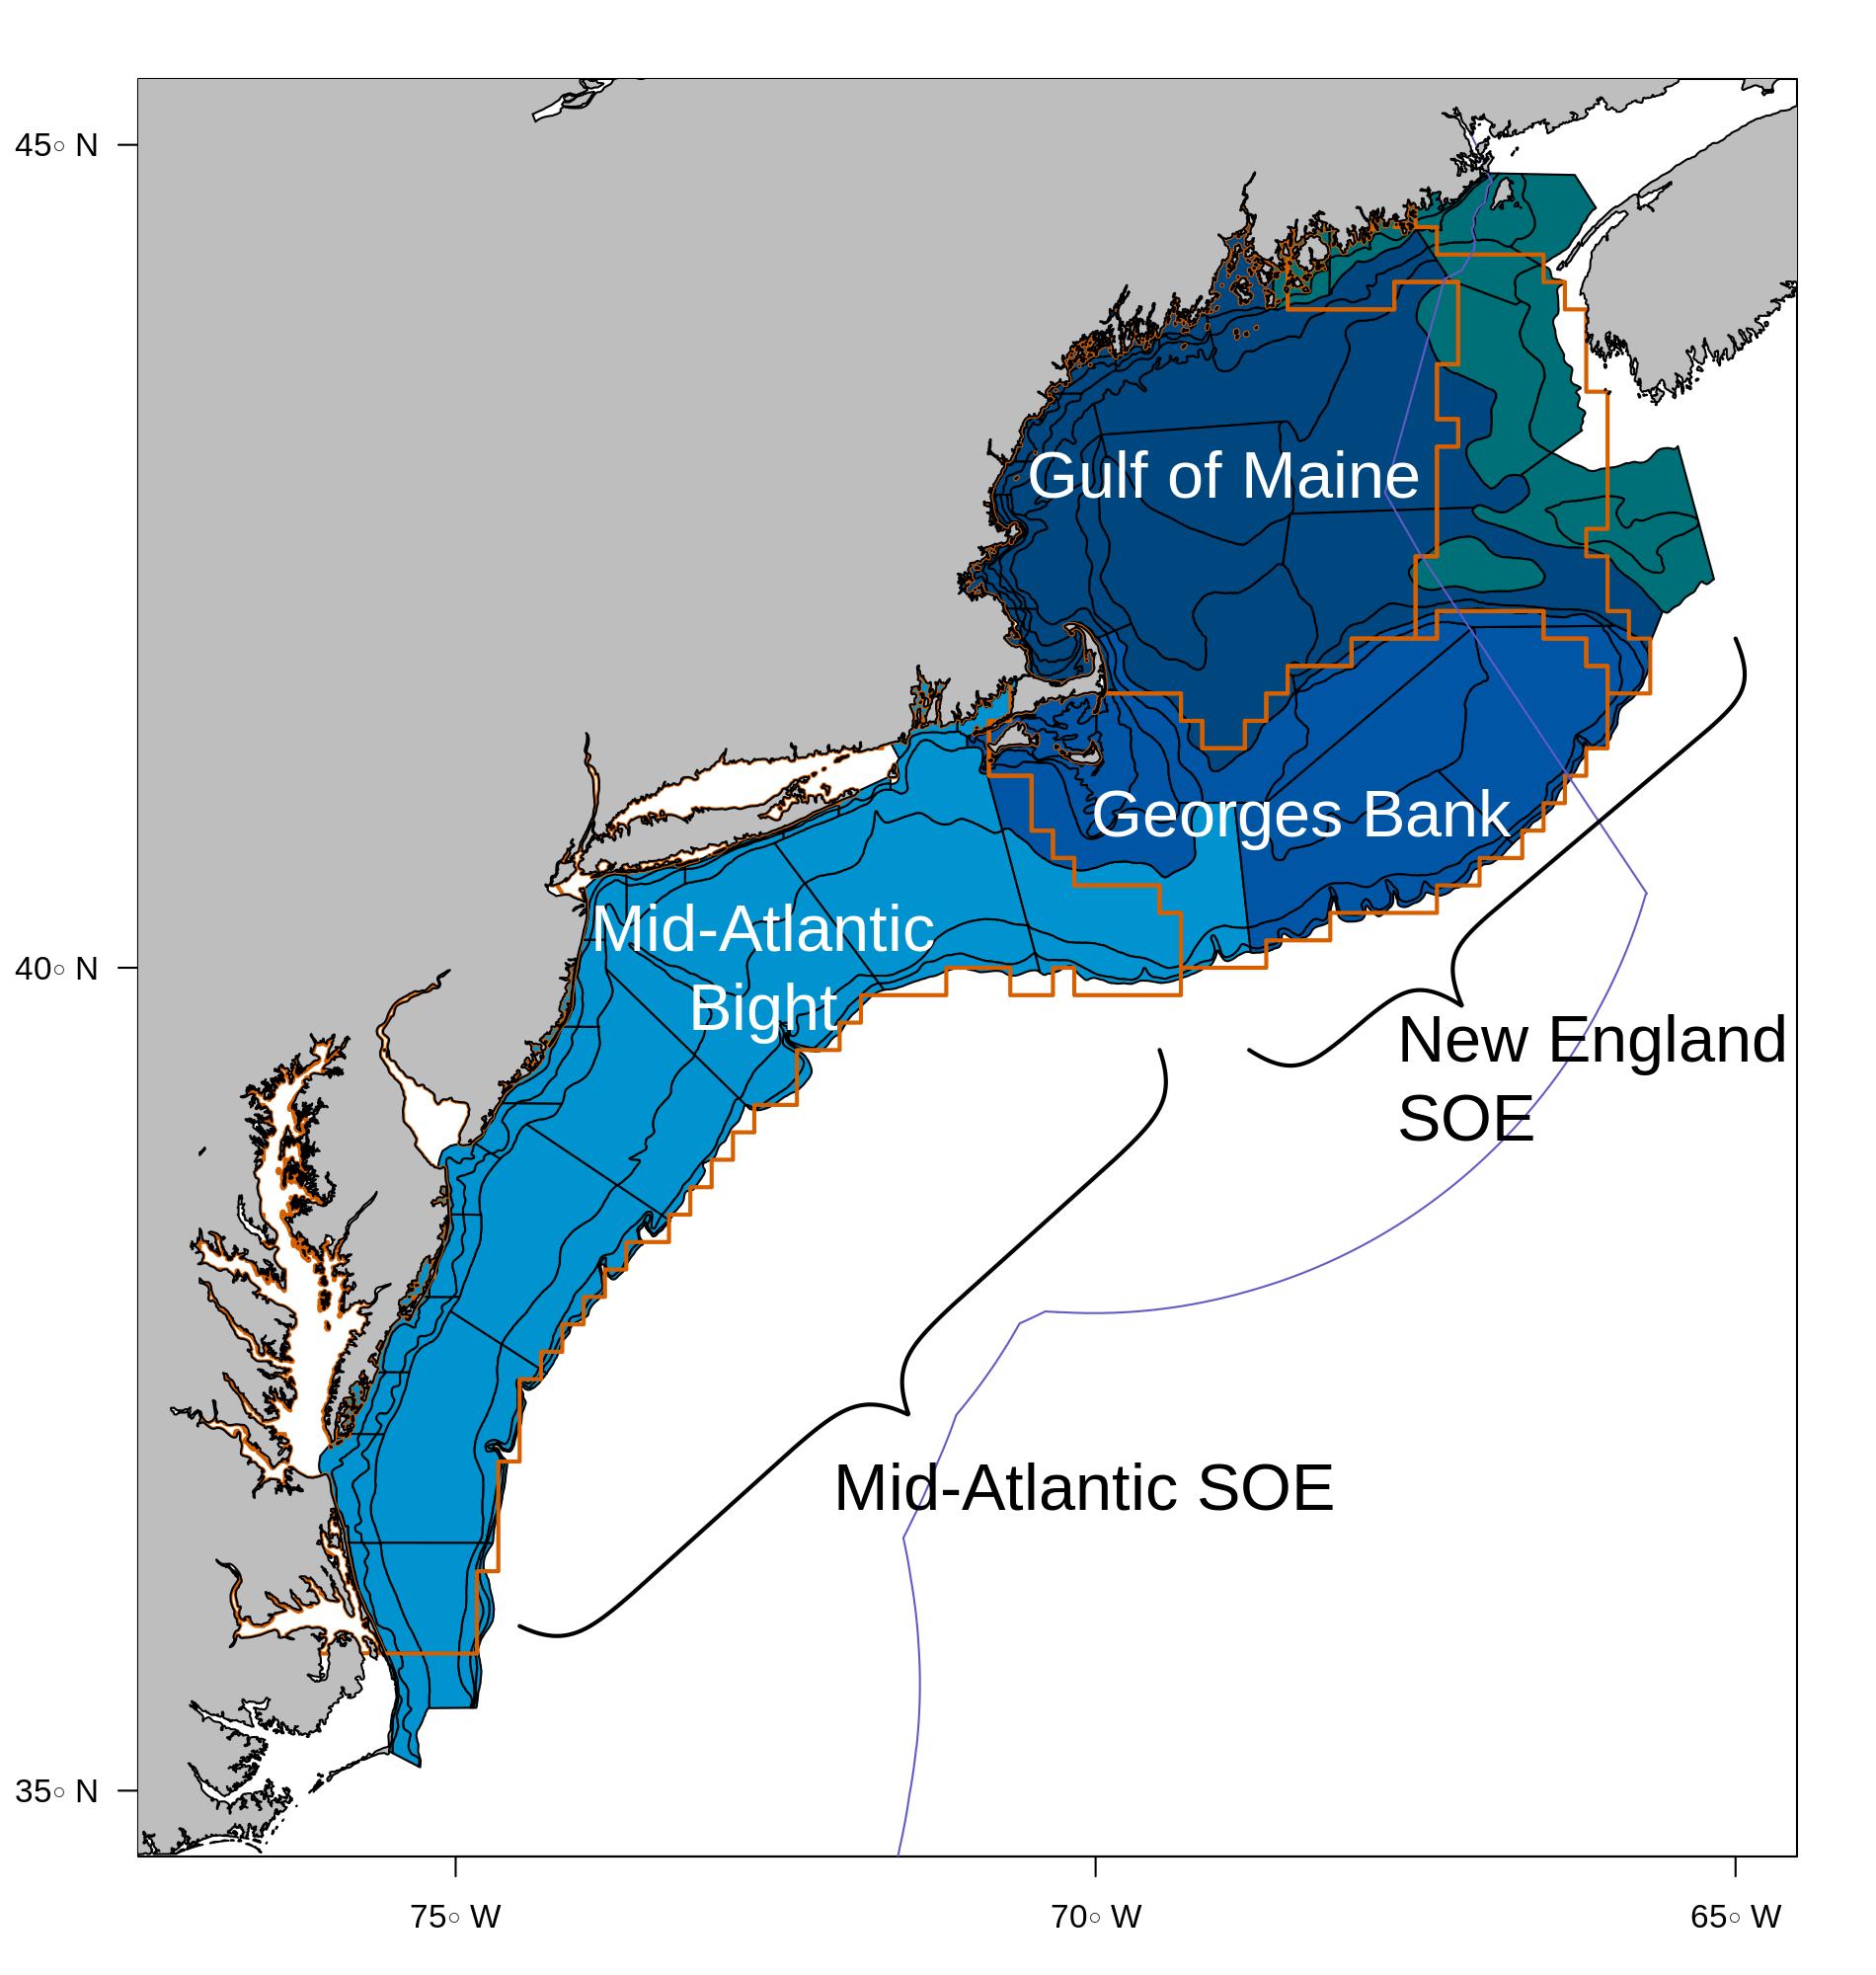--> ] ??? The project currently implements several place-based multispecies assessment models and one food web model. "Place-based" means a common spatial footprint based on ecological production, which contrasts with the current species-based management system of stock-defined spatial footprints that differ by stock and species. (See <a href="stockAreas.html"> stock area comparisons</a>.) Therefore, the input data for this project differs from the input data for most current stock assessments, and the results of these multispecies assessments are not directly comparable with current single species assessments. However, similar processes can be applied to evaluate these models. Georges Bank as defined for this project uses the NEFSC bottom trawl survey strata highlighted in medium blue below, which corresponds to the spatial unit for survey-derived ecosystem indicators in the Northeast Fisheries Science Center (NEFSC) New England State of the Ecosystem (SOE) report. Orange outlines indicate the ten minute square definitions for Ecological Production Units defined by a previous analysis. --- # Objective 1: evaluate system responses to management ## [Rpath](https://github.com/NOAA-EDAB/Rpath) ([Lucey, et al., 2020a](http://www.sciencedirect.com/science/article/pii/S0304380020301290)) with MSE capability ([Lucey, et al., 2021](http://www.sciencedirect.com/science/article/pii/S0165783620302976)) .pull-left[  ] .pull-right[  ] --- # Objective 2: evaluate multispecies assessment tools .pull-left-60[ ## Multispecies production MSSPM <a name=cite-gamble_analyzing_2009></a>([Gamble, et al., 2009a](http://linkinghub.elsevier.com/retrieve/pii/S0304380009003998)) ## Multispecies catch at length Hydra <a name=cite-gaichas_combining_2017></a>([Gaichas, et al., 2017a](https://academic.oup.com/icesjms/article/74/2/552/2669545/Combining-stock-multispecies-and-ecosystem-level)) (and eventually) ## Multispecies catch at age <a name=cite-curti_evaluating_2013></a>([Curti, et al., 2013a](http://www.nrcresearchpress.com/doi/abs/10.1139/cjfas-2012-0229)) .footnote[ Fisheries Integrated Toolbox: MSSPM: https://nmfs-ecosystem-tools.github.io/MSSPM/ *Hydra-Associated GitHub repositories* * hydra-sim (Simulation Model Wiki): https://github.com/NOAA-EDAB/hydra_sim/wiki * hydra-sim (estimation fork): https://github.com/thefaylab/hydra_sim * hydradata (estimation fork): https://github.com/thefaylab/hydradata * hydra-diag (diagnostics): https://github.com/thefaylab/hydra_diag ] ] .pull-right-40[  .footnote[https://xkcd.com/2323/] ] --- ## Common attributes across models A common dataset for 10 Georges Bank species has been developed, as well as a simulated dataset for model performance testing. The [`mskeyrun`](https://noaa-edab.github.io/ms-keyrun/) data package holds both datasets. All modeling teams used these datasets. Group decisions on data are also documented [online](https://noaa-edab.github.io/ms-keyrun/articles/mskeyrun.html#data-needs). .pull-left-40[ **Years:** 1968-2019 **Area:** Georges Bank (previous map) **Species:** Atlantic cod (*Gadus morhua*), Atlantic herring (*Clupea harengus*), Atlantic mackerel (*Scomber scombrus*), Goosefish (*Lophius americanus*), Haddock (*Melanogrammus aeglefinus*), Silver hake (*Merluccius bilinearis*), Spiny dogfish (*Squalus acanthias*), Winter flounder (*Pseudopleuronectes americanus*), Winter skate (*Leucoraja ocellata*), and Yellowtail flounder (*Limanda ferruginea*) ] .pull-right-60[  ] --- # Common datasets to streamline model comparison .pull-left[ Real data from NEFSC databases via R packages [`survdat`](https://noaa-edab.github.io/survdat/), [`comlandr`](https://noaa-edab.github.io/comlandr/), [`mscatch`](https://noaa-edab.github.io/mscatch/)  ] .pull-right[ Simulated data from Norwegian Barents Sea Atlantis model via R package [`atlantisom`](https://sgaichas.github.io/poseidon-dev/atlantisom_landingpage.html) **Norwegian-Barents Sea** [Hansen et al. 2016](https://www.imr.no/filarkiv/2016/04/fh-2-2016_noba_atlantis_model_til_web.pdf/nn-no), [2018](https://journals.plos.org/plosone/article?id=10.1371/journal.pone.0210419) .center[  ] ] --- ## [ms-keyrun real biomass and catch data](https://noaa-edab.github.io/ms-keyrun/articles/GBsurveycatchviz.html) <iframe width="1212" height="682" src="https://noaa-edab.github.io/ms-keyrun/articles/GBsurveycatchviz.html" title="MS-keyrun real biomass and catch data" frameborder="0" allow="accelerometer; autoplay; clipboard-write; encrypted-media; gyroscope; picture-in-picture" style="width:100%; height:100%;" allowfullscreen></iframe> --- ## [ms-keyrun real diet data](https://noaa-edab.github.io/ms-keyrun/articles/GBdietcomp.html) <iframe width="1212" height="682" src="https://noaa-edab.github.io/ms-keyrun/articles/GBdietcomp.html" title="MS-keyrun real diet data" frameborder="0" allow="accelerometer; autoplay; clipboard-write; encrypted-media; gyroscope; picture-in-picture" style="width:100%; height:100%;" allowfullscreen></iframe>" frameborder="0" allow="accelerometer; autoplay; clipboard-write; encrypted-media; gyroscope; picture-in-picture" style="width:100%; height:100%;" allowfullscreen></iframe> --- background-image: url("https://github.com/NOAA-EDAB/presentations/raw/master/docs/EDAB_images/NRCmodelLifeCycle.png") background-size: 650px background-position: right ## WGSAM 2022: constructed model (framework) review <a name=cite-nrc_chapter_2007></a>([NRC, 2007](https://www.nap.edu/read/11972/chapter/6)) .pull-left-40[ For each model, reviews should evaluate: 1. Spatial and temporal resolution 1. Algorithm choices 1. Assumptions (scientific basis, computational infrastructure; adequacy of conceptual model) 1. Data availability/software tools 1. Quality assurance/quality control (code testing) 1. Test scenarios 1. Corroboration with observations 1. Uncertainty/sensitivity analysis 1. Peer review (previous) ] .pull-right-60[] --- background-image: url(https://github.com/NOAA-EDAB/presentations/raw/master/docs/EDAB_images/work-in-progress.png) background-size: 200px background-position: bottom right # [Full Review](https://ices-library.figshare.com/articles/report/Working_Group_on_Multispecies_Assessment_Methods_WGSAM_outputs_from_2022_meeting_/22087292) and Work in progress .pull-left[ * Challenge of place based approach for stocks with substantial dynamics outside Georges Bank: "In that case, expanding the models outside the boundaries of the EPU, and/or explicitly accounting for the input/output of fish and energy across the boundaries will likely be needed" * Dedicated R packages for data positively reviewed * Standardize diet interactions and better quantify other food in estimation models using Rpath * Do model self-tests * Model specific structural and sensitivity recommendations ] .pull-right[ ## In progress * Self tests (4 species Hydra) * Model specific recommendations in progress + Fleet changes + Feeding parameters * Testing in progress (next slides) * Work continues on input datasets ] --- # Multispecies model skill assessment .pull-left-40[ [Stow et al. 2009](https://www.sciencedirect.com/science/article/abs/pii/S0924796308001103?via%3Dihub)  ] .pull-right-60[ [Olsen et al. 2016](https://journals.plos.org/plosone/article?id=10.1371/journal.pone.0146467)  ] ??? "Both our model predictions and the observations reside in a halo of uncertainty and the true state of the system is assumed to be unknown, but lie within the observational uncertainty (Fig. 1a). A model starts to have skill when the observational and predictive uncertainty halos overlap, in the ideal case the halos overlap completely (Fig. 1b). Thus, skill assessment requires a set of quantitative metrics and procedures for comparing model output with observational data in a manner appropriate to the particular application." --- ## [ms-keyrun simulated data](https://noaa-edab.github.io/ms-keyrun/articles/SimData.html) <iframe width="1212" height="682" src="https://noaa-edab.github.io/ms-keyrun/articles/SimData.html" title="MS-keyrun simulated data" frameborder="0" allow="accelerometer; autoplay; clipboard-write; encrypted-media; gyroscope; picture-in-picture" style="width:100%; height:100%;" allowfullscreen></iframe> --- ## Multispecies model skill assessment based on NOBA Atlantis (Townsend et al, WIP) .pull-left[ Stepwise development process of self fitting, fitting to atlantis output, then skill assessment using atlantis output  Profiles for estimated parameters; but *what to compare K values to?*  ] .pull-right[ Can test model diagnostic tools as well  Using simulated data in [`mskeyrun` package](https://noaa-edab.github.io/ms-keyrun/), available to all ] --- ## Initial results for Hydra: Single model fit to biomass vs biomass skill .pull-left[  ] .pull-right[  ] .center[ *MODELS SHOWN ARE EXAMPLE TRIAL FITS, NOT FINISHED OR GOOD MODELS* ] --- ## Initial results for Hydra: Biomass Skill across model structures .pull-left[  ] .pull-right[  ] .center[ *MODELS SHOWN ARE EXAMPLE TRIAL FITS, NOT FINISHED OR GOOD MODELS* ] --- ## Initial results for Hydra: example skill summary statistics, 5 bin model structures .pull-left[  ] .pull-right[  ] .center[ *MODELS SHOWN ARE EXAMPLE TRIAL FITS, NOT FINISHED OR GOOD MODELS* ] --- ## Multispecies model skill comparison, ICES WGSAM 2023-2024 Do the same thing with Gadget, CEATTLE, Mizer, LeMans, Rpath... more participants welcome! .pull-left[ [Simulated datasets](https://github.com/NOAA-EDAB/ms-keyrun/issues/56) have been added to mskeyrun  ] .pull-right[ [Discussion ongoing](https://github.com/NOAA-EDAB/ms-keyrun/discussions) for planned comparisons  ] --- background-image: url(https://github.com/NOAA-EDAB/presentations/raw/master/docs/EDAB_images/pMSEhydra.png) background-size: 830px background-position: right # [EBFM pMSE](https://d23h0vhsm26o6d.cloudfront.net/pMSE-Final-Report2.pdf) .pull-left-30[ Gavin Fay, Lisa Kerr, Madeleine Guyant, Jerelle Jesse, Emily Liljestrand Hydra: multispecies operating model conditioned on Georges Bank data within MSE framework as prototype test of EBFM strategies. Results: additional flexibility and increased yield possible with EBFM "ceilings and floors" without increased risk to single stocks. ] .pull-right-70[] --- ## References .contrib[ <a name=bib-caracappa_northeast_2022></a>[Caracappa, J. C. et al.](#cite-caracappa_northeast_2022) (2022). "A northeast United States Atlantis marine ecosystem model with ocean reanalysis and ocean color forcing". En. In: _Ecological Modelling_ 471, p. 110038. ISSN: 0304-3800. DOI: [10.1016/j.ecolmodel.2022.110038](https://doi.org/10.1016%2Fj.ecolmodel.2022.110038). URL: [https://www.sciencedirect.com/science/article/pii/S030438002200148X](https://www.sciencedirect.com/science/article/pii/S030438002200148X) (visited on Aug. 08, 2022). <a name=bib-curti_evaluating_2013></a>[Curti, K. L. et al.](#cite-curti_evaluating_2013) (2013a). "Evaluating the performance of a multispecies statistical catch-at-age model". En. In: _Canadian Journal of Fisheries and Aquatic Sciences_ 70.3, pp. 470-484. ISSN: 0706-652X, 1205-7533. DOI: [10.1139/cjfas-2012-0229](https://doi.org/10.1139%2Fcjfas-2012-0229). URL: [http://www.nrcresearchpress.com/doi/abs/10.1139/cjfas-2012-0229](http://www.nrcresearchpress.com/doi/abs/10.1139/cjfas-2012-0229) (visited on Jan. 13, 2016). <a name=bib-gaichas_combining_2017></a>[Gaichas, S. K. et al.](#cite-gaichas_combining_2017) (2017a). "Combining stock, multispecies, and ecosystem level fishery objectives within an operational management procedure: simulations to start the conversation". In: _ICES Journal of Marine Science_ 74.2, pp. 552-565. ISSN: 1054-3139. DOI: [10.1093/icesjms/fsw119](https://doi.org/10.1093%2Ficesjms%2Ffsw119). URL: [https://academic.oup.com/icesjms/article/74/2/552/2669545/Combining-stock-multispecies-and-ecosystem-level](https://academic.oup.com/icesjms/article/74/2/552/2669545/Combining-stock-multispecies-and-ecosystem-level) (visited on Oct. 18, 2017). <a name=bib-gamble_analyzing_2009></a>[Gamble, R. J. et al.](#cite-gamble_analyzing_2009) (2009a). "Analyzing the tradeoffs among ecological and fishing effects on an example fish community: A multispecies (fisheries) production model". En. In: _Ecological Modelling_ 220.19, pp. 2570-2582. ISSN: 03043800. DOI: [10.1016/j.ecolmodel.2009.06.022](https://doi.org/10.1016%2Fj.ecolmodel.2009.06.022). URL: [http://linkinghub.elsevier.com/retrieve/pii/S0304380009003998](http://linkinghub.elsevier.com/retrieve/pii/S0304380009003998) (visited on Oct. 13, 2016). <a name=bib-lucey_evaluating_2021></a>[Lucey, S. M. et al.](#cite-lucey_evaluating_2021) (2021). "Evaluating fishery management strategies using an ecosystem model as an operating model". En. In: _Fisheries Research_ 234, p. 105780. ISSN: 0165-7836. DOI: [10.1016/j.fishres.2020.105780](https://doi.org/10.1016%2Fj.fishres.2020.105780). URL: [http://www.sciencedirect.com/science/article/pii/S0165783620302976](http://www.sciencedirect.com/science/article/pii/S0165783620302976) (visited on Dec. 09, 2020). <a name=bib-lucey_conducting_2020></a>[Lucey, S. M. et al.](#cite-lucey_conducting_2020) (2020a). "Conducting reproducible ecosystem modeling using the open source mass balance model Rpath". En. In: _Ecological Modelling_ 427, p. 109057. ISSN: 0304-3800. DOI: [10.1016/j.ecolmodel.2020.109057](https://doi.org/10.1016%2Fj.ecolmodel.2020.109057). URL: [http://www.sciencedirect.com/science/article/pii/S0304380020301290](http://www.sciencedirect.com/science/article/pii/S0304380020301290) (visited on Apr. 27, 2020). <a name=bib-nrc_chapter_2007></a>[NRC](#cite-nrc_chapter_2007) (2007). "Chapter 4. Model Evaluation". En. In: _Models in Environmental Regulatory Decision Making_. Washington D.C.: The National Academies Press, pp. 104-169. DOI: [10.17226/11972](https://doi.org/10.17226%2F11972). URL: [https://www.nap.edu/read/11972/chapter/6](https://www.nap.edu/read/11972/chapter/6) (visited on Aug. 29, 2019). ] ## Additional Resources [EBFM pMSE June 2023 New England Council](https://www.nefmc.org/library/june-2023-ecosystem-based-fishery-management-ebfm-committee) * [Presentation](https://d23h0vhsm26o6d.cloudfront.net/2_Draft-final-Prototype-Management-Evaluation-pMSE-simulation-results-and-output-2nd-mailing_2023-07-06-181333_tsor.pdf) * [Final Report](https://d23h0vhsm26o6d.cloudfront.net/pMSE-Final-Report2.pdf) * [One Page Summaries](https://d23h0vhsm26o6d.cloudfront.net/4b_pMSE-one-page-sumamries_2023-07-06-181512_pgju.pdf) .footnote[ Slides available at https://noaa-edab.github.io/presentations Contact: <Sarah.Gaichas@noaa.gov> ] --- .center[ # Extra slides: Model equations press "p" to see slide comments with even more equations ] --- background-image: url("https://github.com/NOAA-EDAB/presentations/raw/master/docs/EDAB_images/Balance_concept.png") background-size: 700px background-position: right ## Food web: [Rpath](https://github.com/NOAA-EDAB/Rpath) in collaboration with AFSC .pull-left[ Species interactions: - Full predator-prey: Consumption leads to prey mortality and predator growth - Static and dynamic model components Static model: For each group, `\(i\)`, specify: Biomass `\(B\)` (or Ecotrophic Efficiency `\(EE\)`) Population growth rate `\(\frac{P}{B}\)` Consumption rate `\(\frac{Q}{B}\)` Diet composition `\(DC\)` Fishery catch `\(C\)` Biomass accumulation `\(BA\)` Im/emigration `\(IM\)` and `\(EM\)` Solving for `\(EE\)` (or `\(B\)`) for each group: `$$B_i\Big(\frac{P}{B}\Big)_i*EE_i+IM_i+BA_i=\sum_{j}\Big[ B_j\Big (\frac{Q}{B}\Big)_j*DC_{ij}\Big ]+EM_i+C_i$$` ] .pull-right[ ] ??? Predation mortality `$$M2_{ij} = \frac{DC_{ij}QB_jB_j}{B_i}$$` Fishing mortality `$$F_i = \frac{\sum_{g = 1}^n (C_{ig,land} + C_{ig,disc})}{B_i}$$` Other mortality `$$M0_i = PB_i \left( 1 - EE_i \right)$$` --- background-image: url("https://github.com/NOAA-EDAB/presentations/raw/master/docs/EDAB_images/ForagingArena.png") background-size: 380px background-position: right ## Food web: [Rpath](https://github.com/NOAA-EDAB/Rpath) in collaboration with AFSC .pull-left-70[ Dynamic model (with MSE capability): `$$\frac{dB_i}{dt} = \left(1 - A_i - U_i \right) \sum_{j} Q \left(B_i, B_j \right) - \sum_{j} Q \left( B_j, B_i \right) - M0_iB_i - C_m B_i$$` Consumption: `$$Q \left( B_i, B_j \right) = Q_{ij}^* \Bigg( \frac{V_{ij} Ypred_j}{V_{ij} - 1 + \left( 1 - S_{ij} \right) Ypred_j + S_{i} \sum_k \left( \alpha_{kj} Ypred_k \right)} \Bigg) \times \\\Bigg( \frac{D_{ij} Yprey_i^{\theta_{ij}}}{D_{ij} - 1 + \big( \left( 1 - H_{ij} \right) Yprey_i + H_{i} \sum_k \left( \beta_{ik} Yprey_k \right) \big)^{\theta_{ij}}} \Bigg)$$` Where `\(V_{ij}\)` is vulnerability, `\(D_{ij}\)` is “handling time” accounting for predator saturation, and `\(Y\)` is relative biomass which may be modified by a foraging time multiplier `\(Ftime\)`, `$$Y[pred|prey]_j = Ftime_j \frac {B_j}{B_j^*}$$` ] .pull-right-30[ ] ??? The parameters `\(S_{ij}\)` and `\(H_{ij}\)` are flags that control whether the predator density dependence `\(S_{ij}\)` or prey density dependence `\(H_{ij}\)` are affected solely by the biomass levels of the particular predator and prey, or whether a suite of other species’ biomasses in similar roles impact the relationship. For the default value for `\(S_{ij}\)` of 0 (off), the predator density dependence is only a function of that predator biomass and likewise for prey with the default value of 0 for `\(H_{ij}\)`. Values greater than 0 allow for a density-dependent effects to be affected by a weighted sum across all species for predators, and for prey. The weights `\(\alpha_{kj}\)` and `\(\beta_{kj}\)` are normalized such that the sum for each functional response (i.e. `\(\sum_k\alpha_{kj}\)` and `\(\sum_k\beta_{kj}\)` for the functional response between predator *j* and prey *i*) sum to 1. The weights are calculated from the density-independent search rates for each predator/prey pair, which is equal to `\(2Q_{ij}^*V_{ij} / (V_{ij} - 1)B_i^*B_j^*\)`. --- ## Multispecies production simulation: [Kraken](https://github.com/NOAA-EDAB/Kraken) and estimation [FIT: MSSPM](https://nmfs-ecosystem-tools.github.io/MSSPM/) Species interactions: - Predation: Top down (predation decreases population growth of prey, predator population growth independent of prey) - Competition: Within and between species groups *Based on Shaefer and Lotka-Volterra population dynamics and predation equations* - Species have intrinsic population growth rate `\(r_i\)` - Full model has - Carrying capacity `\(K\)` at the species group level `\(K_G\)` and at the full system level `\(K_\sigma\)` - Within group competition `\(\beta_{ig}\)` and between group competition `\(\beta_{iG}\)` slow population growth near `\(K\)` - Predation `\(\alpha_{ip}\)` and harvest `\(H_i\)` reduce population `$$\frac{dN_i}{dt} = r_iN_i \bigg(1 - \frac{N_i}{K_G} - \frac{\sum_g \beta_{ig}N_g}{K_G} - \frac{\sum_G \beta_{iG}N_G}{K_\sigma - K_G} \bigg) - N_i\sum_p\alpha_{ip}N_p - H_iN_i$$` - Simpler version used in most applications has interaction coefficient `\(\alpha\)` that incorporates carrying capacity `$$B_{i,t+1}=B_{i,t} + r_iB_{i,t} - B_{i,t}\sum_j\alpha_{i,j}B_{j,t} - C_{i,t}$$` ??? Interaction coefficients `\(\alpha_{i,j}\)` can be positive or negative `\(C\)` can be a Catch time series, an exploitation rate time series `\(B_{i,t}*F_{i,t}\)` or an `\(qE\)` (catchability/Effort) time series. Environmental covariates can be included on growth or carrying capacity (in the model forms that have an explicit carrying capacity). --- ## Multispecies catch at length simulation model: [Hydra](https://github.com/NOAA-EDAB/hydra_sim) Species interactions: - Predation: Top down only (predators increase M of prey, predators grow regardless of prey) *Based on standard structured stock assessment population dynamics equations, Same MSVPA predation equation as MSCAA (but length based), same dependencies and caveats* - First, split `\(M\)` for species `\(i\)` size `\(j\)` into components: `$$M_{i,j,t} = M1_i + M2_{i,j,t}$$` - Calculate `\(M2\)` with MSVPA predation equation, which applies a predator consumption:biomass ratio to the suitable prey biomass for that predator. - Suitability, `\(\rho\)`, of prey species `\(m\)` size `\(n\)` for a given predator species `\(i\)` size `\(j\)` a function of size preference and vulnerability {0,1}. - Food intake `\(I\)` for each predator-at-size is temperature dependent consumption rate times mean stomach content weight. - Also sensitive to "other food" `\(\Omega\)`. `$$M2_{m,n,t} = \sum_i \sum_j I_{i,j,t} N_{i,j,t} \frac{\rho_{i,j,m,n}}{\sum_a \sum_b \rho_{i,j,a,b} W_{a,b} N_{a,b} + \Omega}$$` ??? But: - Covariates on growth, maturity, recruitment possible; intended for environmental variables - So could hack in prey-dependent growth but making it dynamic is difficult We specify 'preferred' predator-prey weight ratio (log scale) `\(\Psi_j\)` and variance in predator size preference `\(\sigma_j\)` to compare with the actual predator-prey weight ratio `\((w_n / w_j)\)` to get the size preference `\(\vartheta\)`. `$$\vartheta_{n,j} = \frac{1}{(w_n / w_j)\sigma_j \sqrt{2\pi}} e^{-\frac{[log_e(w_n / w_j) - \Psi_j]}{2\sigma_j^2}}$$` Food intake is `$$I_{i,j,t} = 24 [\delta_j e^{\omega_i T}]\bar{C}_{i,j,k,t}$$` --- ## Next: Multispecies catch at age estimation model: *seeking catchy name* [FIT: MSCAA](https://nmfs-ecosystem-tools.github.io/MSCAA/) Species interactions: - Predation: Top down only (predators increase M of prey, predators grow regardless of prey) *Based on standard age structured stock assessment population dynamics equations* - First, split `\(M\)` for species `\(i\)` age `\(a\)` into components: `$$M_{i,a,t} = M1_i + M2_{i,a,t}$$` - Calculate `\(M2\)` with MSVPA predation equation, which applies a predator consumption:biomass ratio to the suitable prey biomass for that predator. - Suitability is a function of predator size preference (based on an age-specific predator:prey weight ratio) and prey vulnerability (everything about the prey that isn't size related). - Also sensitive to "other food" `$$M2_{i,a,t} = \frac{1}{N_{i,a,t}W_{i,a,t}}\sum_j \sum_b CB_{j,b} B_{j,b,t} \frac{\phi_{i,a,j,b,t}}{\phi_{j,b,t}}$$` ??? Size preference is `$$g_{i,a,j,b,t}=\exp\bigg[\frac{-1}{2\sigma_{i,j}^2}\bigg(\ln\frac{W_{j,b,t}}{W_{i,a,t}}-\eta_{i,j}\bigg)^2\bigg]$$` Suitability, `\(\nu\)` of prey `\(i\)` to predator `\(j\)`: `$$\nu_{i,a,j,b,t}=\rho_{i,j}g_{i,a,j,b,t}$$` Scaled suitability: `$$\tilde\nu_{i,a,j,b,t}=\frac{\nu_{i,a,j,b,t}}{\sum_i \sum_a \nu_{i,a,j,b,t} + \nu_{other}}$$` Suitable biomass of prey `\(i\)` to predator `\(j\)`: `$$\phi_{i,a,j,b,t}=\tilde\nu_{i,a,j,b,t}B_{i,a,t}$$` Available biomass of other food, where `\(B_other\)` is system biomass minus modeled species biomass: `$$\phi_{other}=\tilde\nu_{other}B_{other,t}$$` Total available prey biomass: `$$\phi_{j,b,t}=\phi_{other} + \sum_i \sum_a \phi_{i,a,j,b,t}$$`