class: right, middle, my-title, title-slide # State of the Ecosystem <br /> NEFSC/GARFO ## 23 February 2021 ### Kimberly Bastille <br /> <br /> Many thanks to:<br /> Sarah Gaichas, Sean Lucey, Geret DePiper, Kimberly Hyde, Scott Large,<br /> and all SOE contributors --- class: top, left # Presentation Overview .pull-left[ <br/> <br/> <br/> <br/> <br/> * What is the State of the Ecosystem report * Highlights from the 2021 reports * Open data science and future product development ] .pull-right[  ] --- ## Integrated Ecosystem Assessment .pull-left[ <br> IEA Approach - Supports shift to ecosystem based management - Iterative - Collaborative ] .pull-right[ *The IEA Loop<sup>1</sup>* 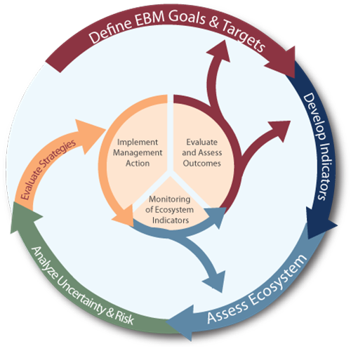 ] .footnote[ [1] https://www.integratedecosystemassessment.noaa.gov/national/IEA-approach ] ??? --- ## State of the Ecosystem (SOE) reporting Improving ecosystem information and synthesis for fishery managers .pull-left[ - Ecosystem indicators linked to management objectives <a name=cite-depiper_operationalizing_2017></a>([DePiper, et al., 2017](https://academic.oup.com/icesjms/article/74/8/2076/3094701)) + Contextual information + Report evolving since 2016 + Fishery-relevant subset of full Ecosystem Status Reports - Open science emphasis <a name=cite-bastille_improving_2020></a>([Bastille, et al., 2020](https://doi.org/10.1080/08920753.2021.1846155)) - Used within Mid-Atlantic Fishery Management Council's Ecosystem Process <a name=cite-muffley_there_2020></a>([Muffley, et al., 2020](https://doi.org/10.1080/08920753.2021.1846156)) ] .pull-right[ 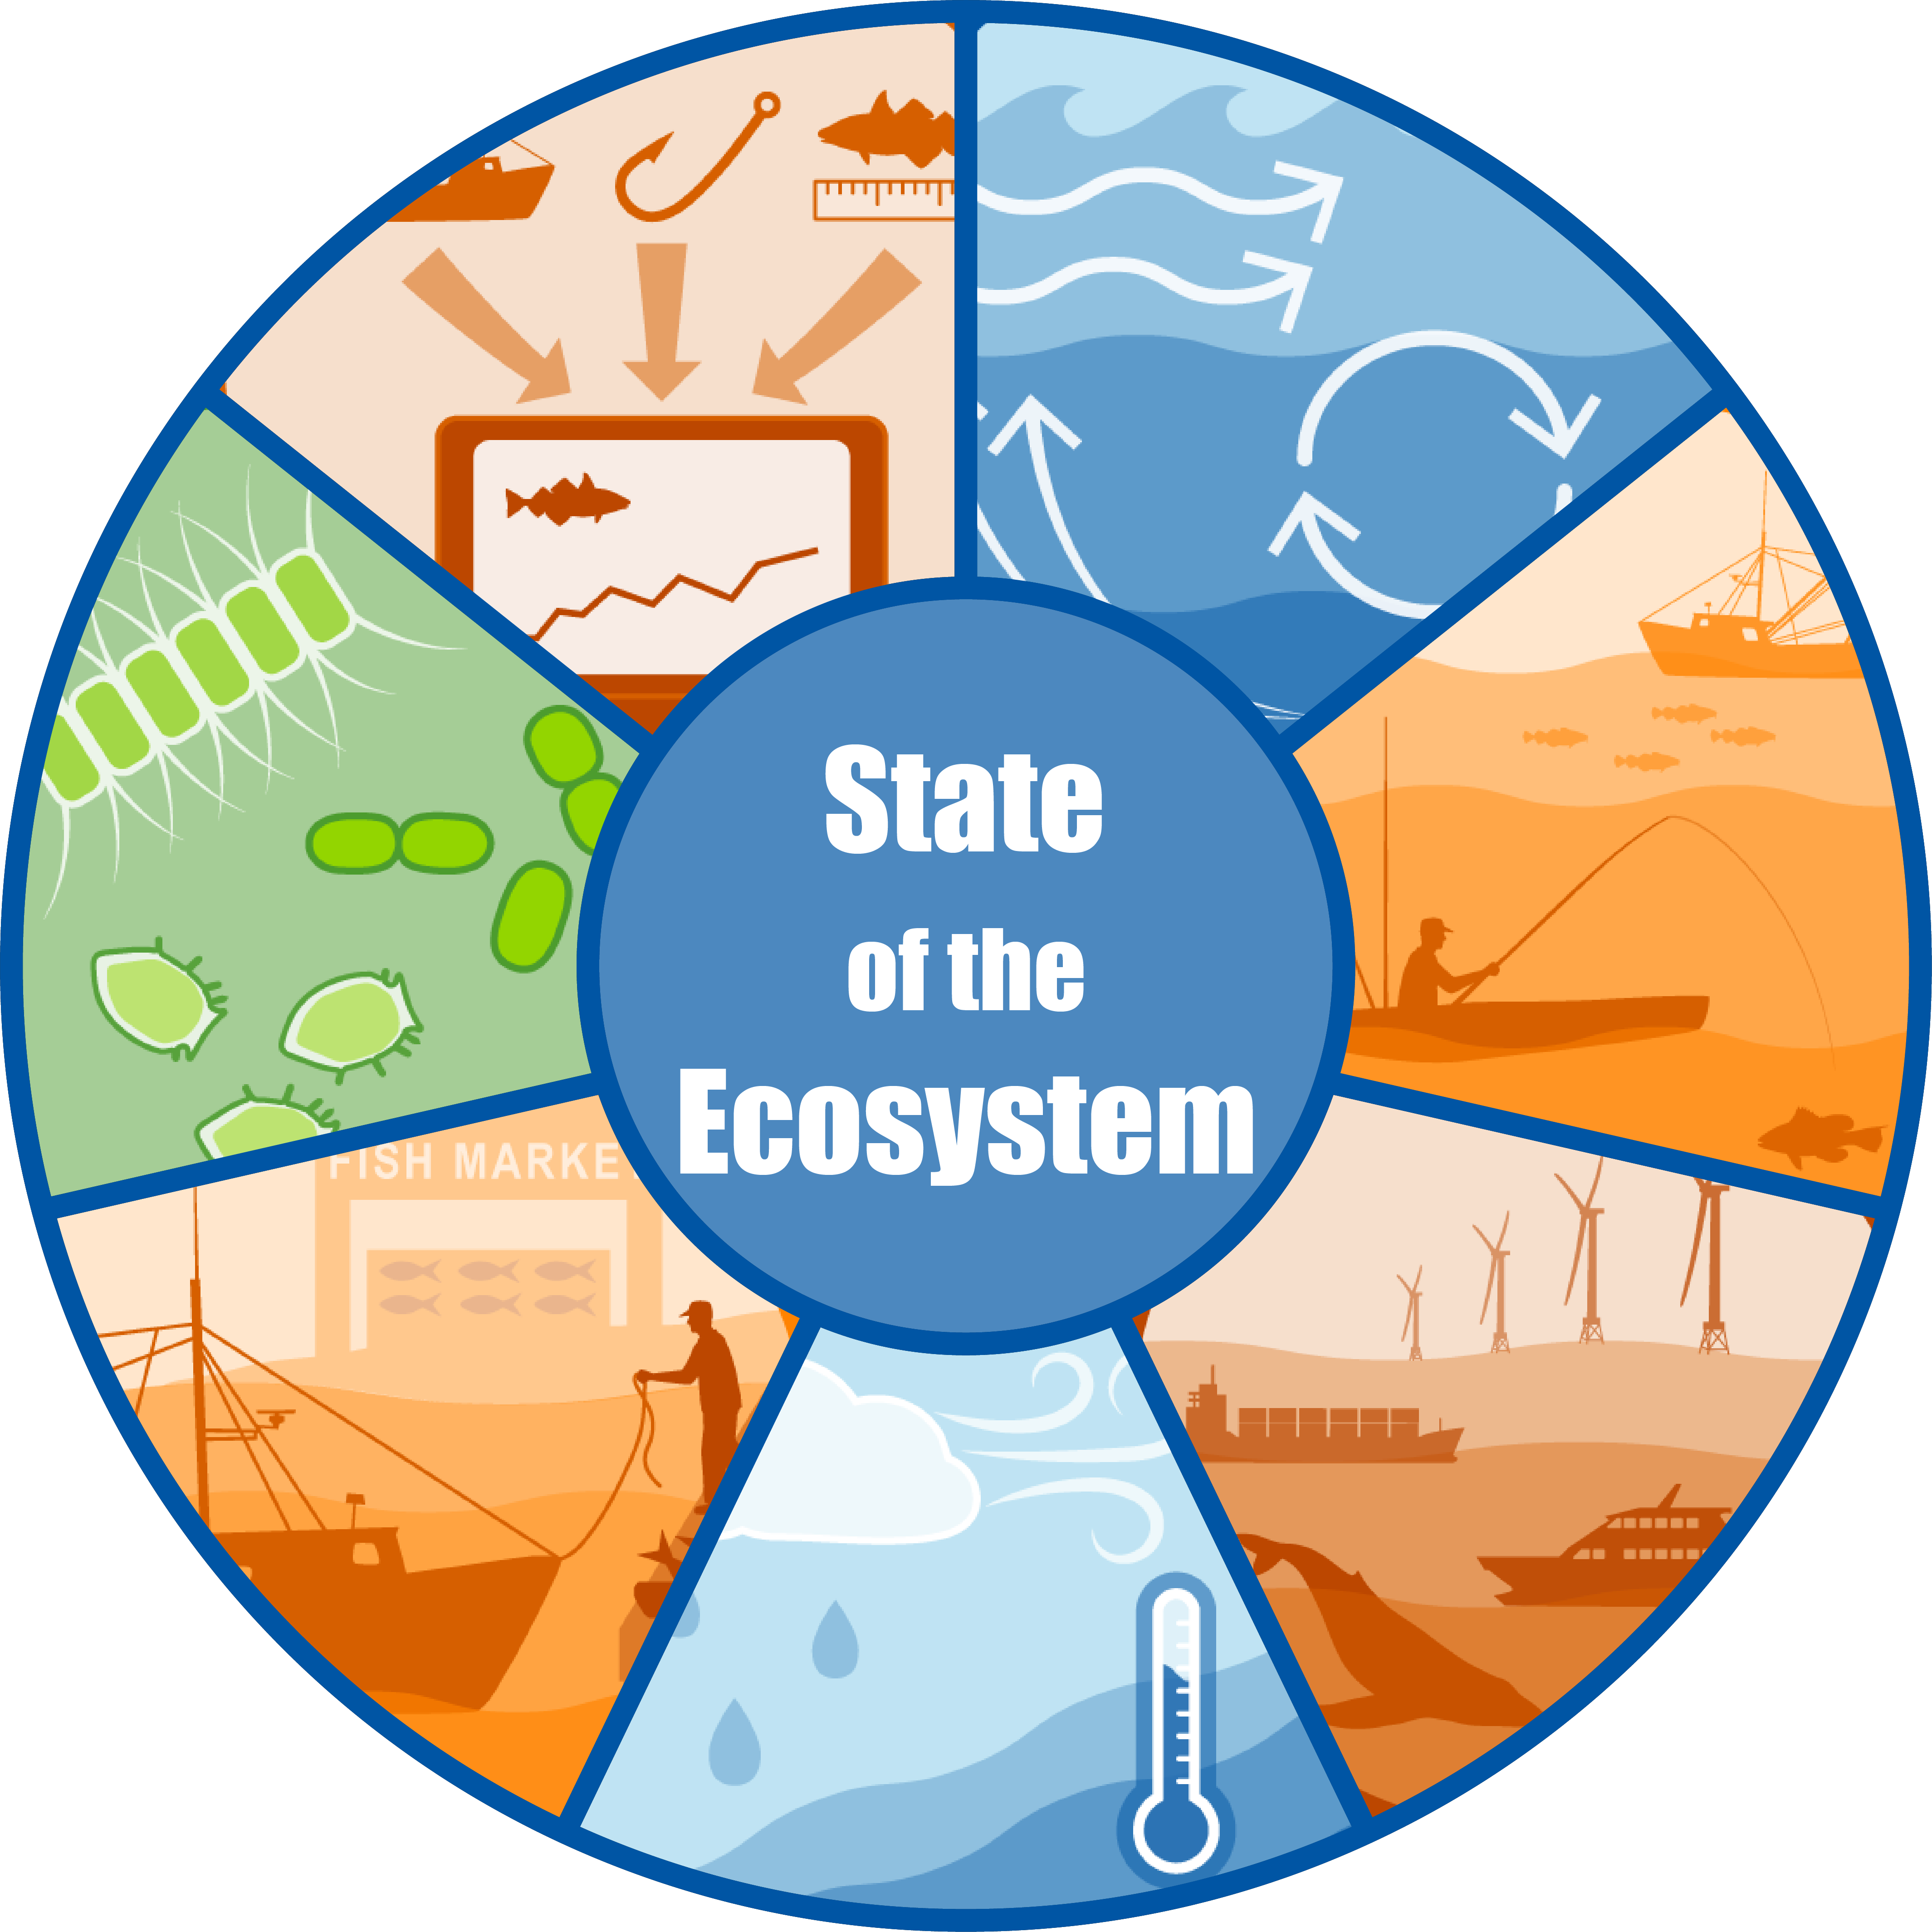 ] --- background-image: url("EDAB_images/nes-components-abstracted.png") background-size: 700px background-position: right bottom ## State of the Ecosystem (SOE) Reporting: Context for busy people *"So what?" --John Boreman, September 2016* 1. Clear linkage of ecosystem indicators with management objectives 1. Synthesis across indicators for big picture 1. Objectives related to human-well being placed first in report 1. Relatively short (< 30 pages), non-technical (but rigorous) text 1. Emphasis on reproducibility ??? In 2016, we began taking steps to address these common critiques of the ESR model Many indicators presented at WGNARS, used in larger Ecosystem Status reports Shorter, fishery specific State of the Ecosystem (SOE) report with conceptual models prototyped based on California Current reporting Feedback from fishery managers redesigned reporting to align with objectives outlined by WGNARS --- ## State of the Ecosystem - Document Orientation .pull-left[ Spatial scale 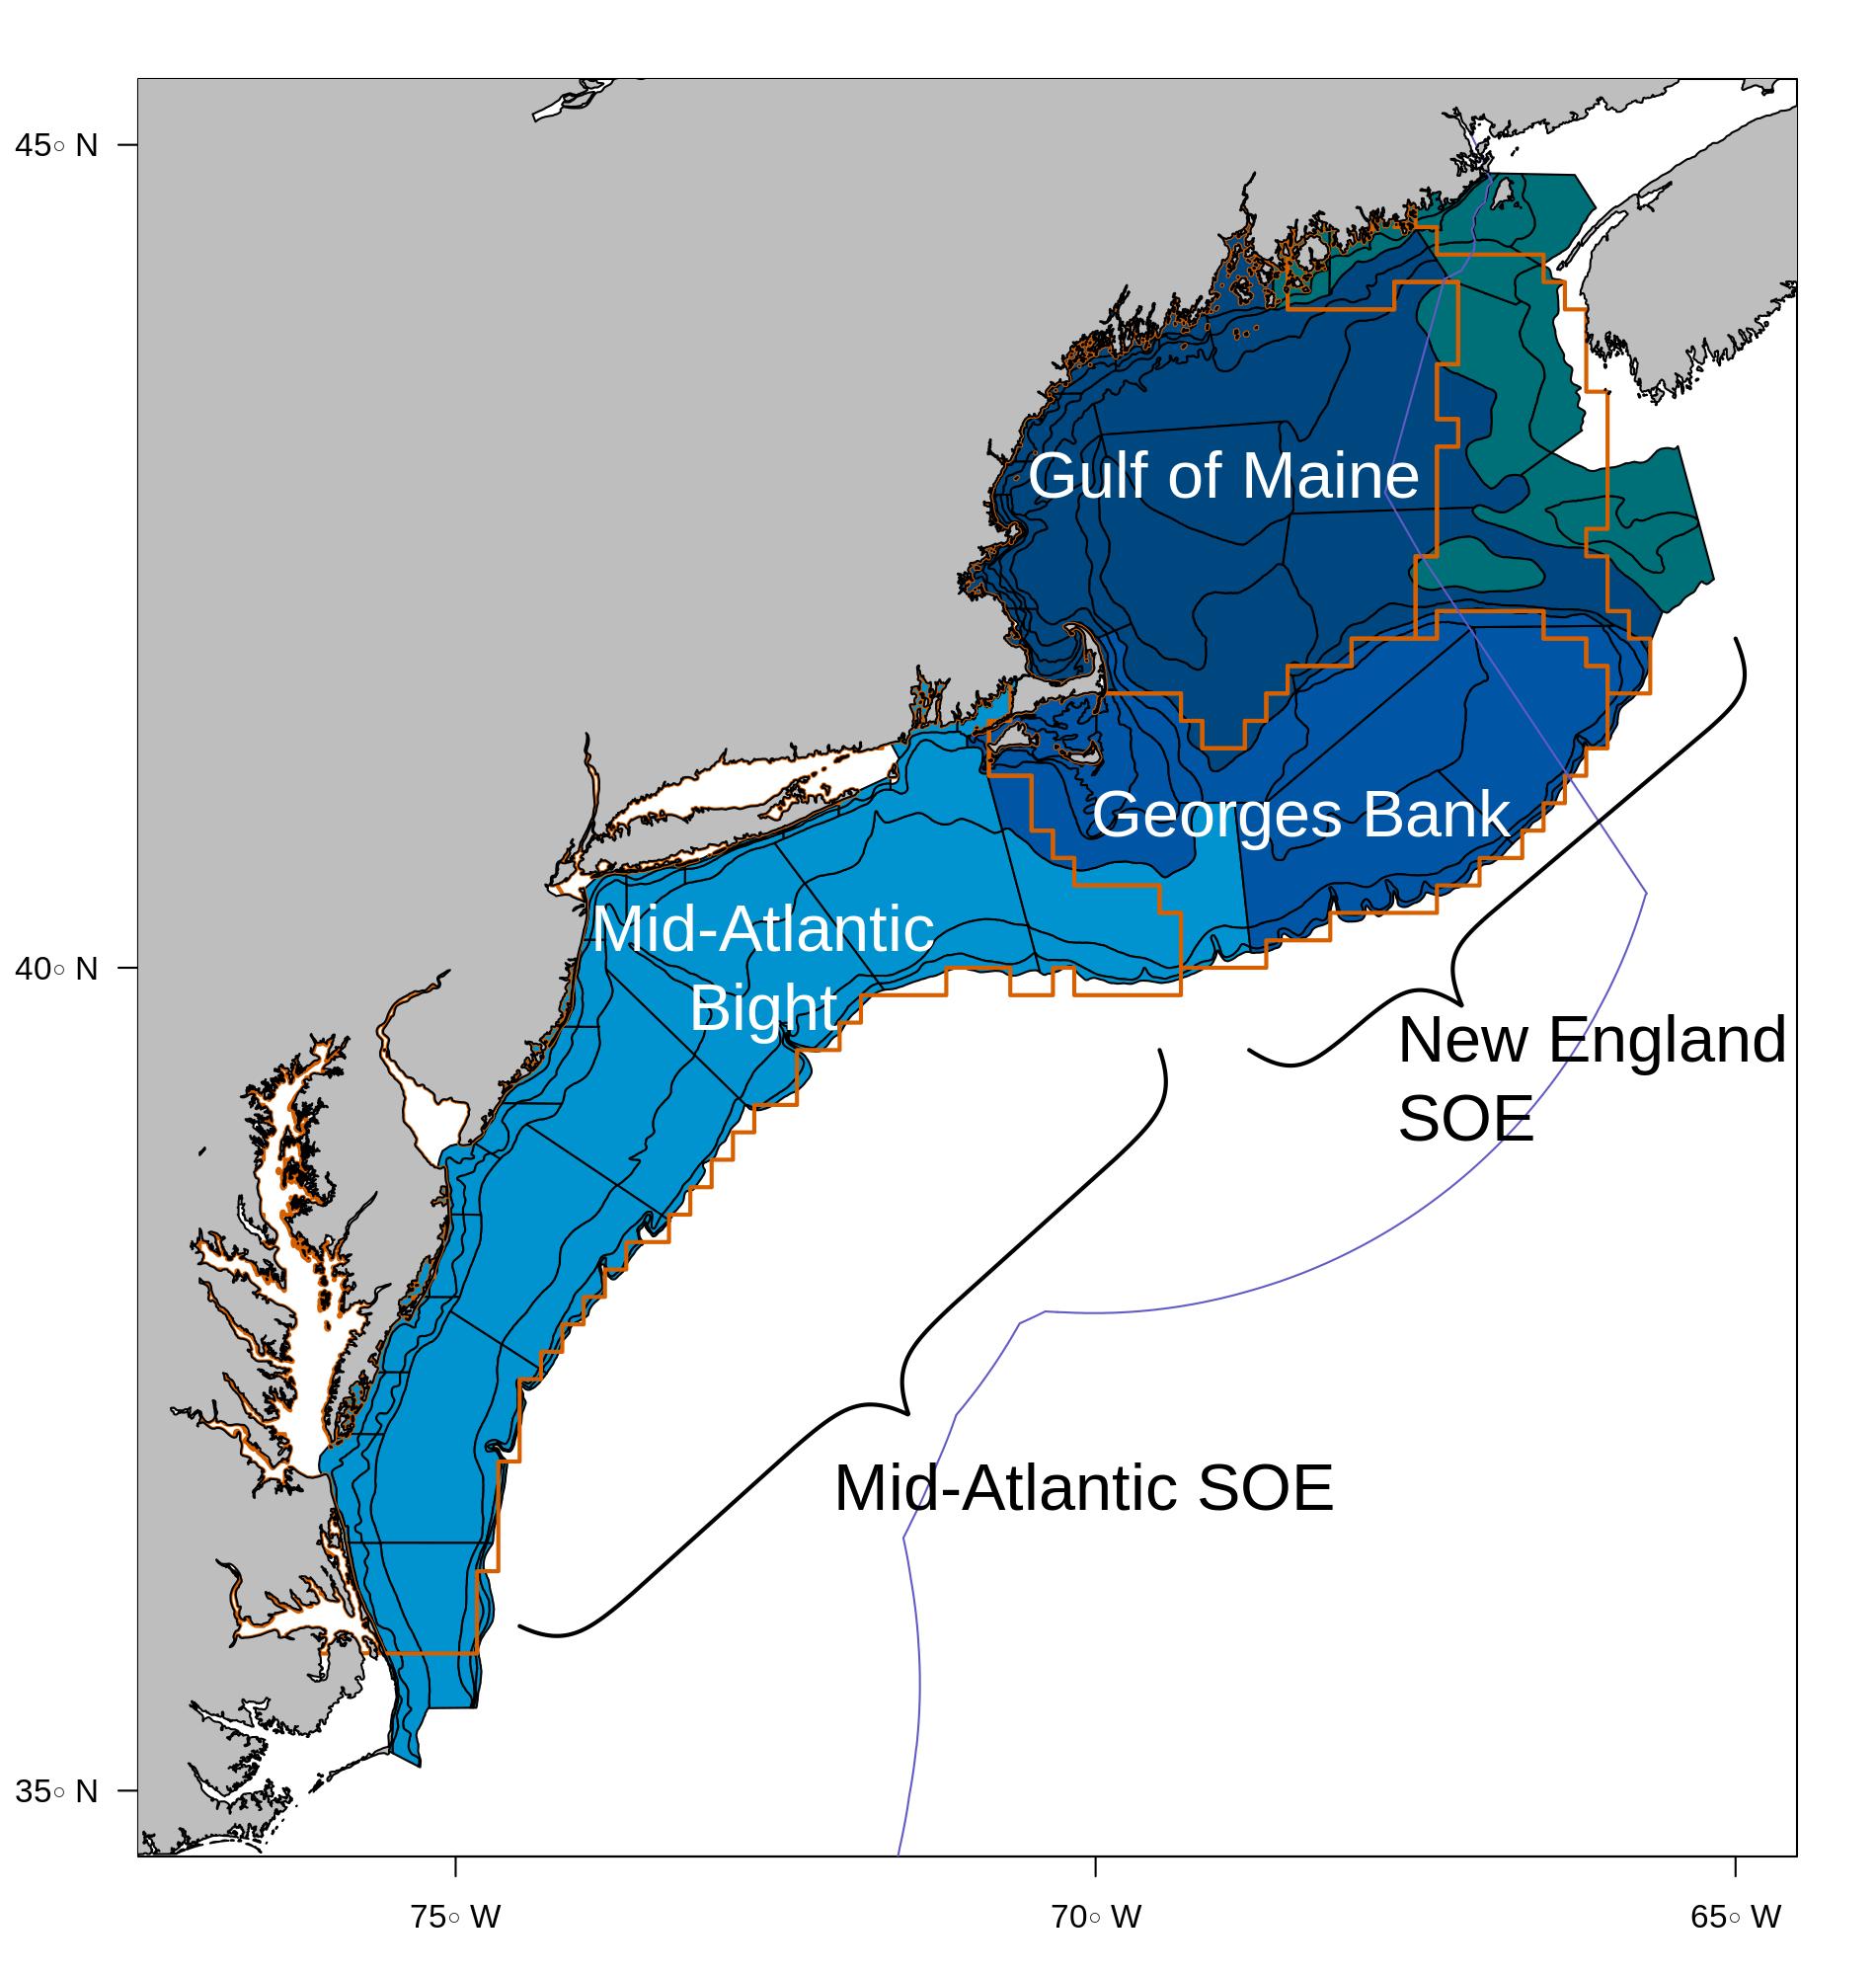 .contrib[ This year, we mapped trawl survey strata to Ecological Production Units (EPUs) [More information on EPUs](https://noaa-edab.github.io/tech-doc/epu.html) [More information on survey data](https://noaa-edab.github.io/tech-doc/survdat.html) ] ] .pull-right[ Key to figures 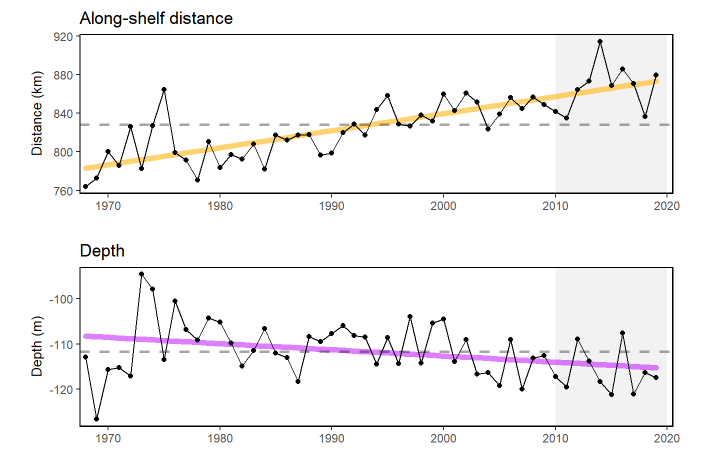 .contrib[ Trends assessed only for 30+ years: [more information](https://noaa-edab.github.io/tech-doc/trend-analysis.html) <p style="color:#FF8C00;">Orange line = significant increase</p> <p style="color:#9932CC;">Purple line = significant decrease</p> No color line = not significant or too short <p style="background-color:#D3D3D3;">Grey background = last 10 years</p> ] ] --- ## State of the Ecosystem Report Structure .pull-left[ ## 2021 Report 1. Summary pages + summary table + possible risks + synthesis themes 1. Performance relative to management objectives + ------------------------------------> 1. Risks to meeting fishery management objectives + Climate + Wind ] .pull-right[ *Ecosystem-scale objectives* <table class="table" style="font-size: 14px; margin-left: auto; margin-right: auto;"> <thead> <tr> <th style="text-align:left;font-weight: bold;"> Objective Categories </th> <th style="text-align:left;font-weight: bold;"> Indicators reported here </th> </tr> </thead> <tbody> <tr grouplength="4"><td colspan="2" style="border-bottom: 1px solid;"><strong>Provisioning/Cultural</strong></td></tr> <tr> <td style="text-align:left; padding-left: 2em;" indentlevel="1"> Seafood Production </td> <td style="text-align:left;"> Landings by feeding guild </td> </tr> <tr> <td style="text-align:left; padding-left: 2em;" indentlevel="1"> Commercial Profits </td> <td style="text-align:left;"> Revenue decomposed to price and volume </td> </tr> <tr> <td style="text-align:left; padding-left: 2em;" indentlevel="1"> Recreation </td> <td style="text-align:left;"> Days fished; recreational catch </td> </tr> <tr> <td style="text-align:left; padding-left: 2em;" indentlevel="1"> Social & Cultural </td> <td style="text-align:left;"> Engagement, Reliance and Social Vulnerability </td> </tr> <tr grouplength="5"><td colspan="2" style="border-bottom: 1px solid;"><strong>Supporting/Regulating</strong></td></tr> <tr> <td style="text-align:left; padding-left: 2em;" indentlevel="1"> Stability </td> <td style="text-align:left;"> Diversity indices (fishery and species) </td> </tr> <tr> <td style="text-align:left; padding-left: 2em;" indentlevel="1"> Biomass </td> <td style="text-align:left;"> Biomass or abundance by feeding guild from surveys </td> </tr> <tr> <td style="text-align:left; padding-left: 2em;" indentlevel="1"> Productivity </td> <td style="text-align:left;"> Condition and recruitment of managed species, Primary productivity </td> </tr> <tr> <td style="text-align:left; padding-left: 2em;" indentlevel="1"> Trophic structure </td> <td style="text-align:left;"> Relative biomass of feeding guilds, Zooplankton </td> </tr> <tr> <td style="text-align:left; padding-left: 2em;" indentlevel="1"> Habitat </td> <td style="text-align:left;"> Estuarine and offshore habitat conditions </td> </tr> </tbody> </table> ] --- ## Ecosystem synthesis themes for 2021 Characterizing ecosystem change for fishery management * **Multiple drivers** - Societal, biological, physical, and chemical factors that influence the marine ecosystems * **Regime shifts** - large, abrupt, and persistent changes in the structure and function of an ecosystem * **Ecosystem Reorganization** - New way humans and other species respond to regime shift e.g. Tropicalization .pull-left[ 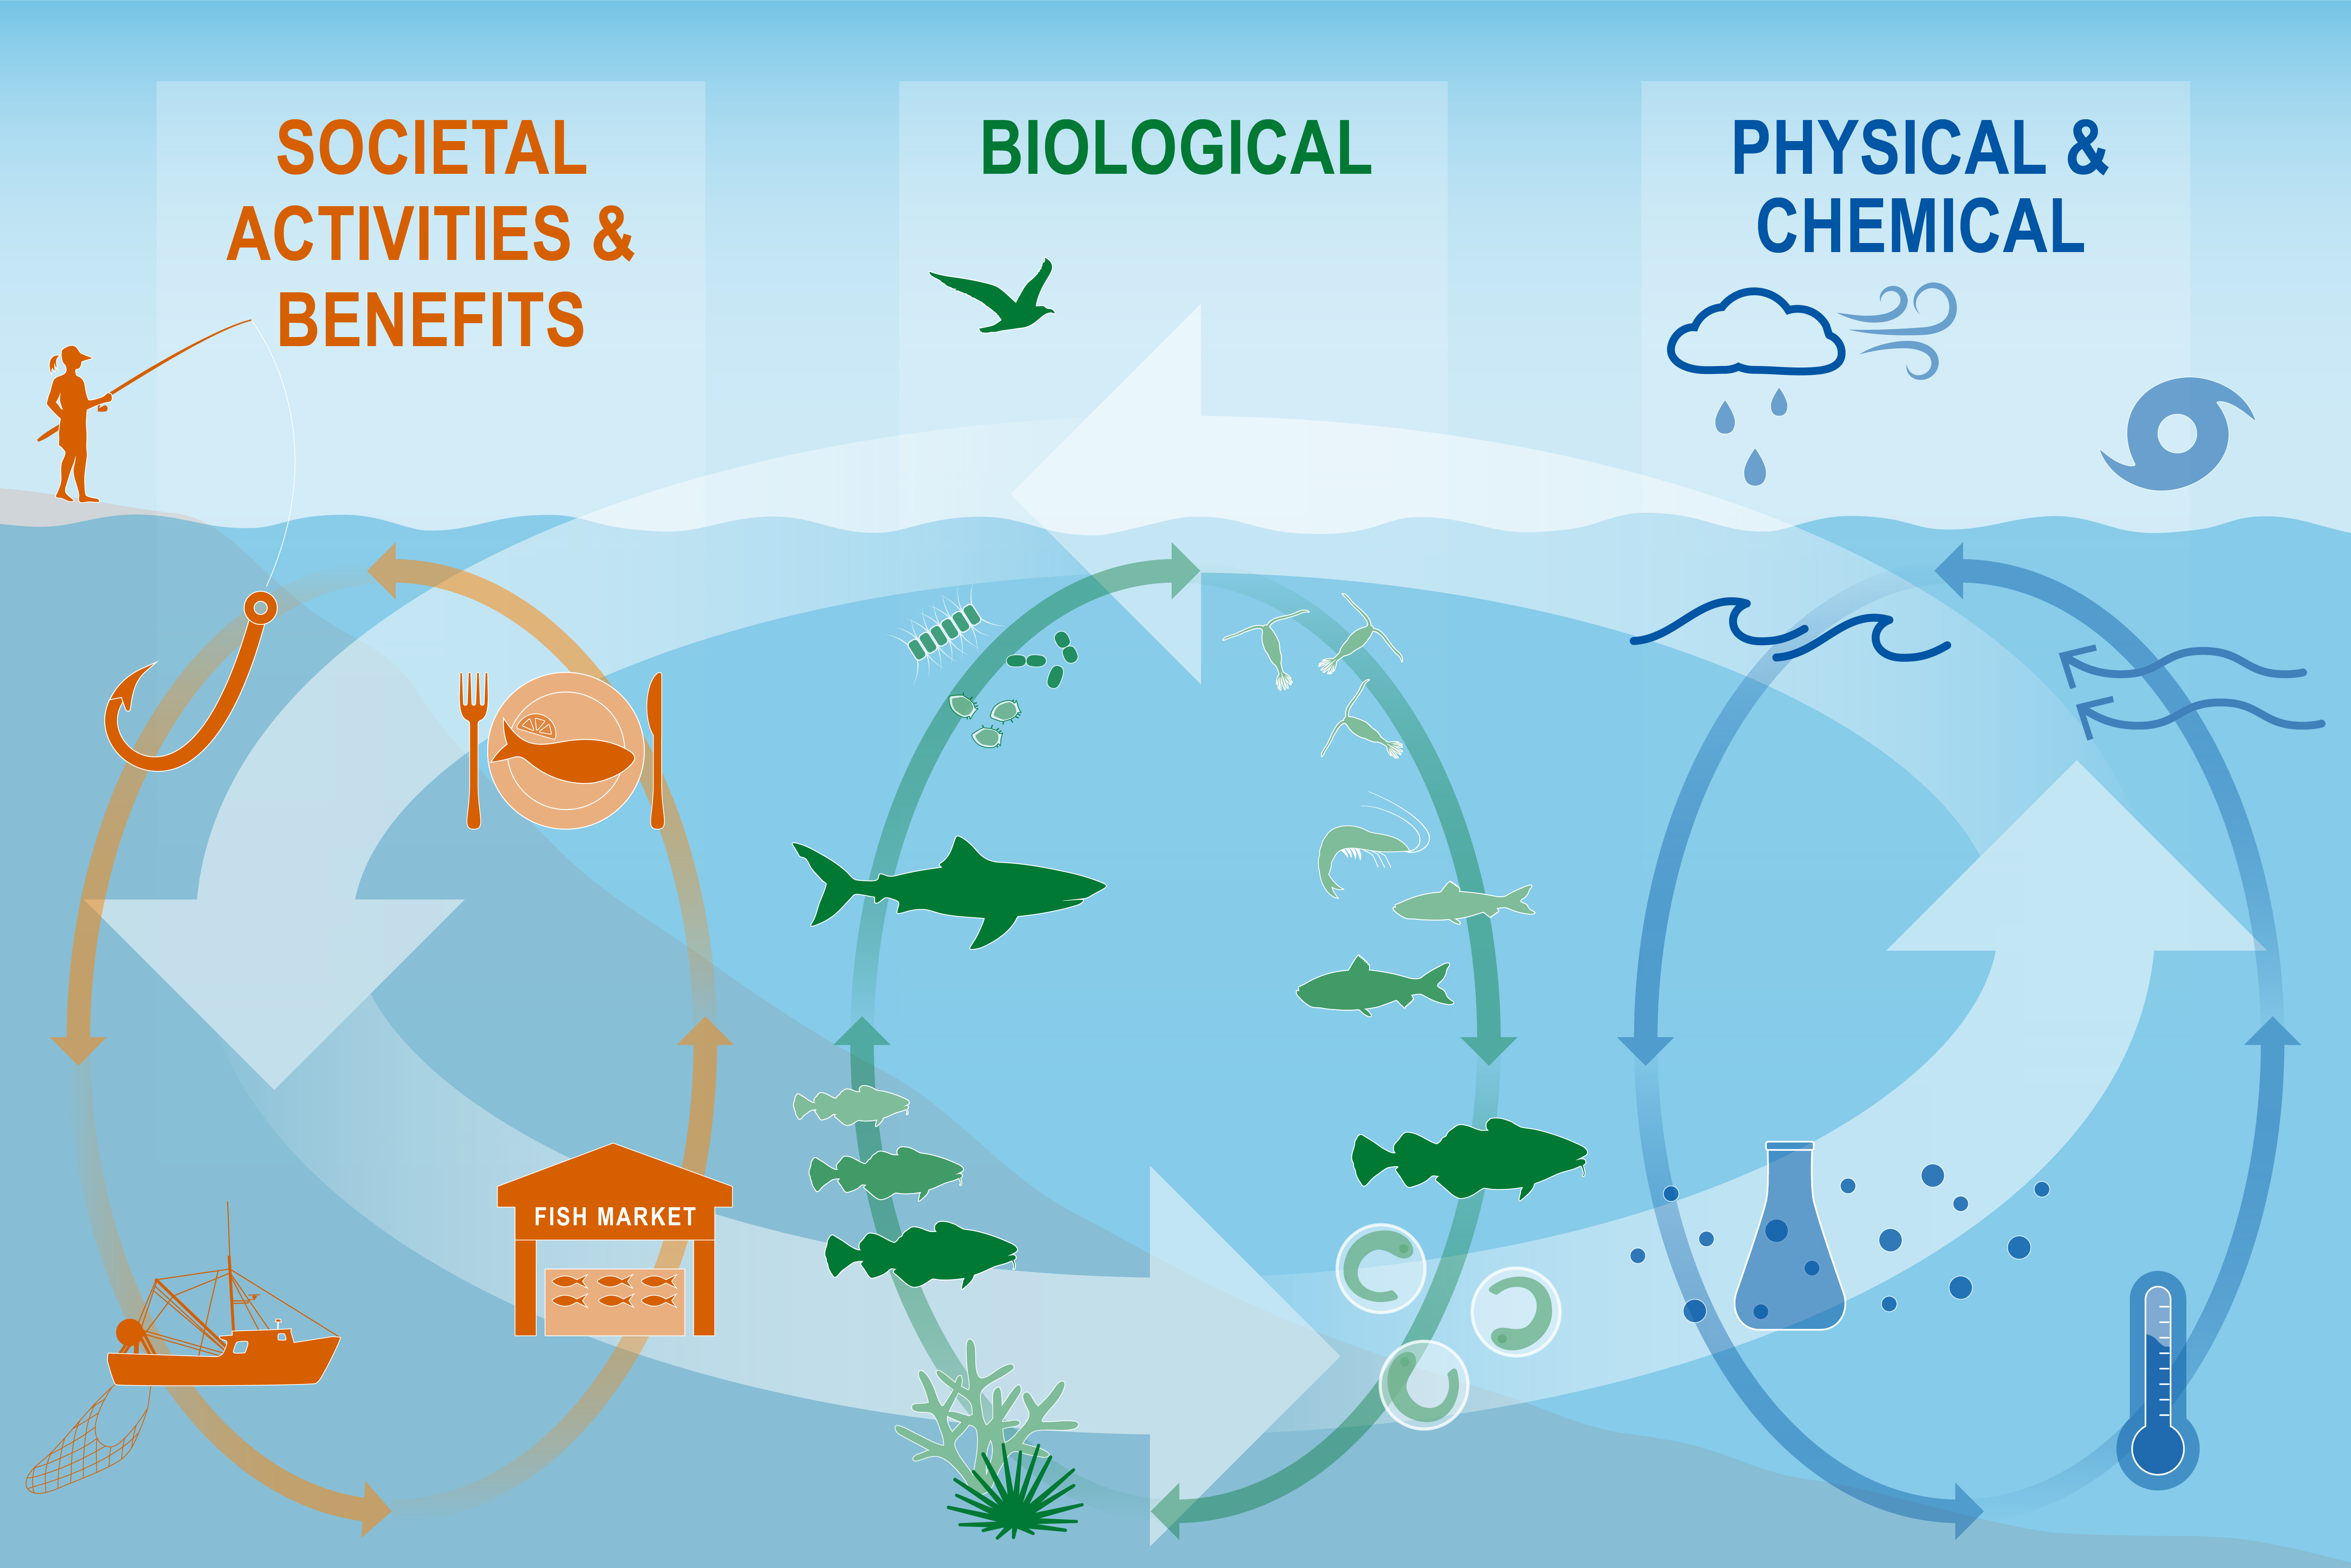 ] .pull-right[ 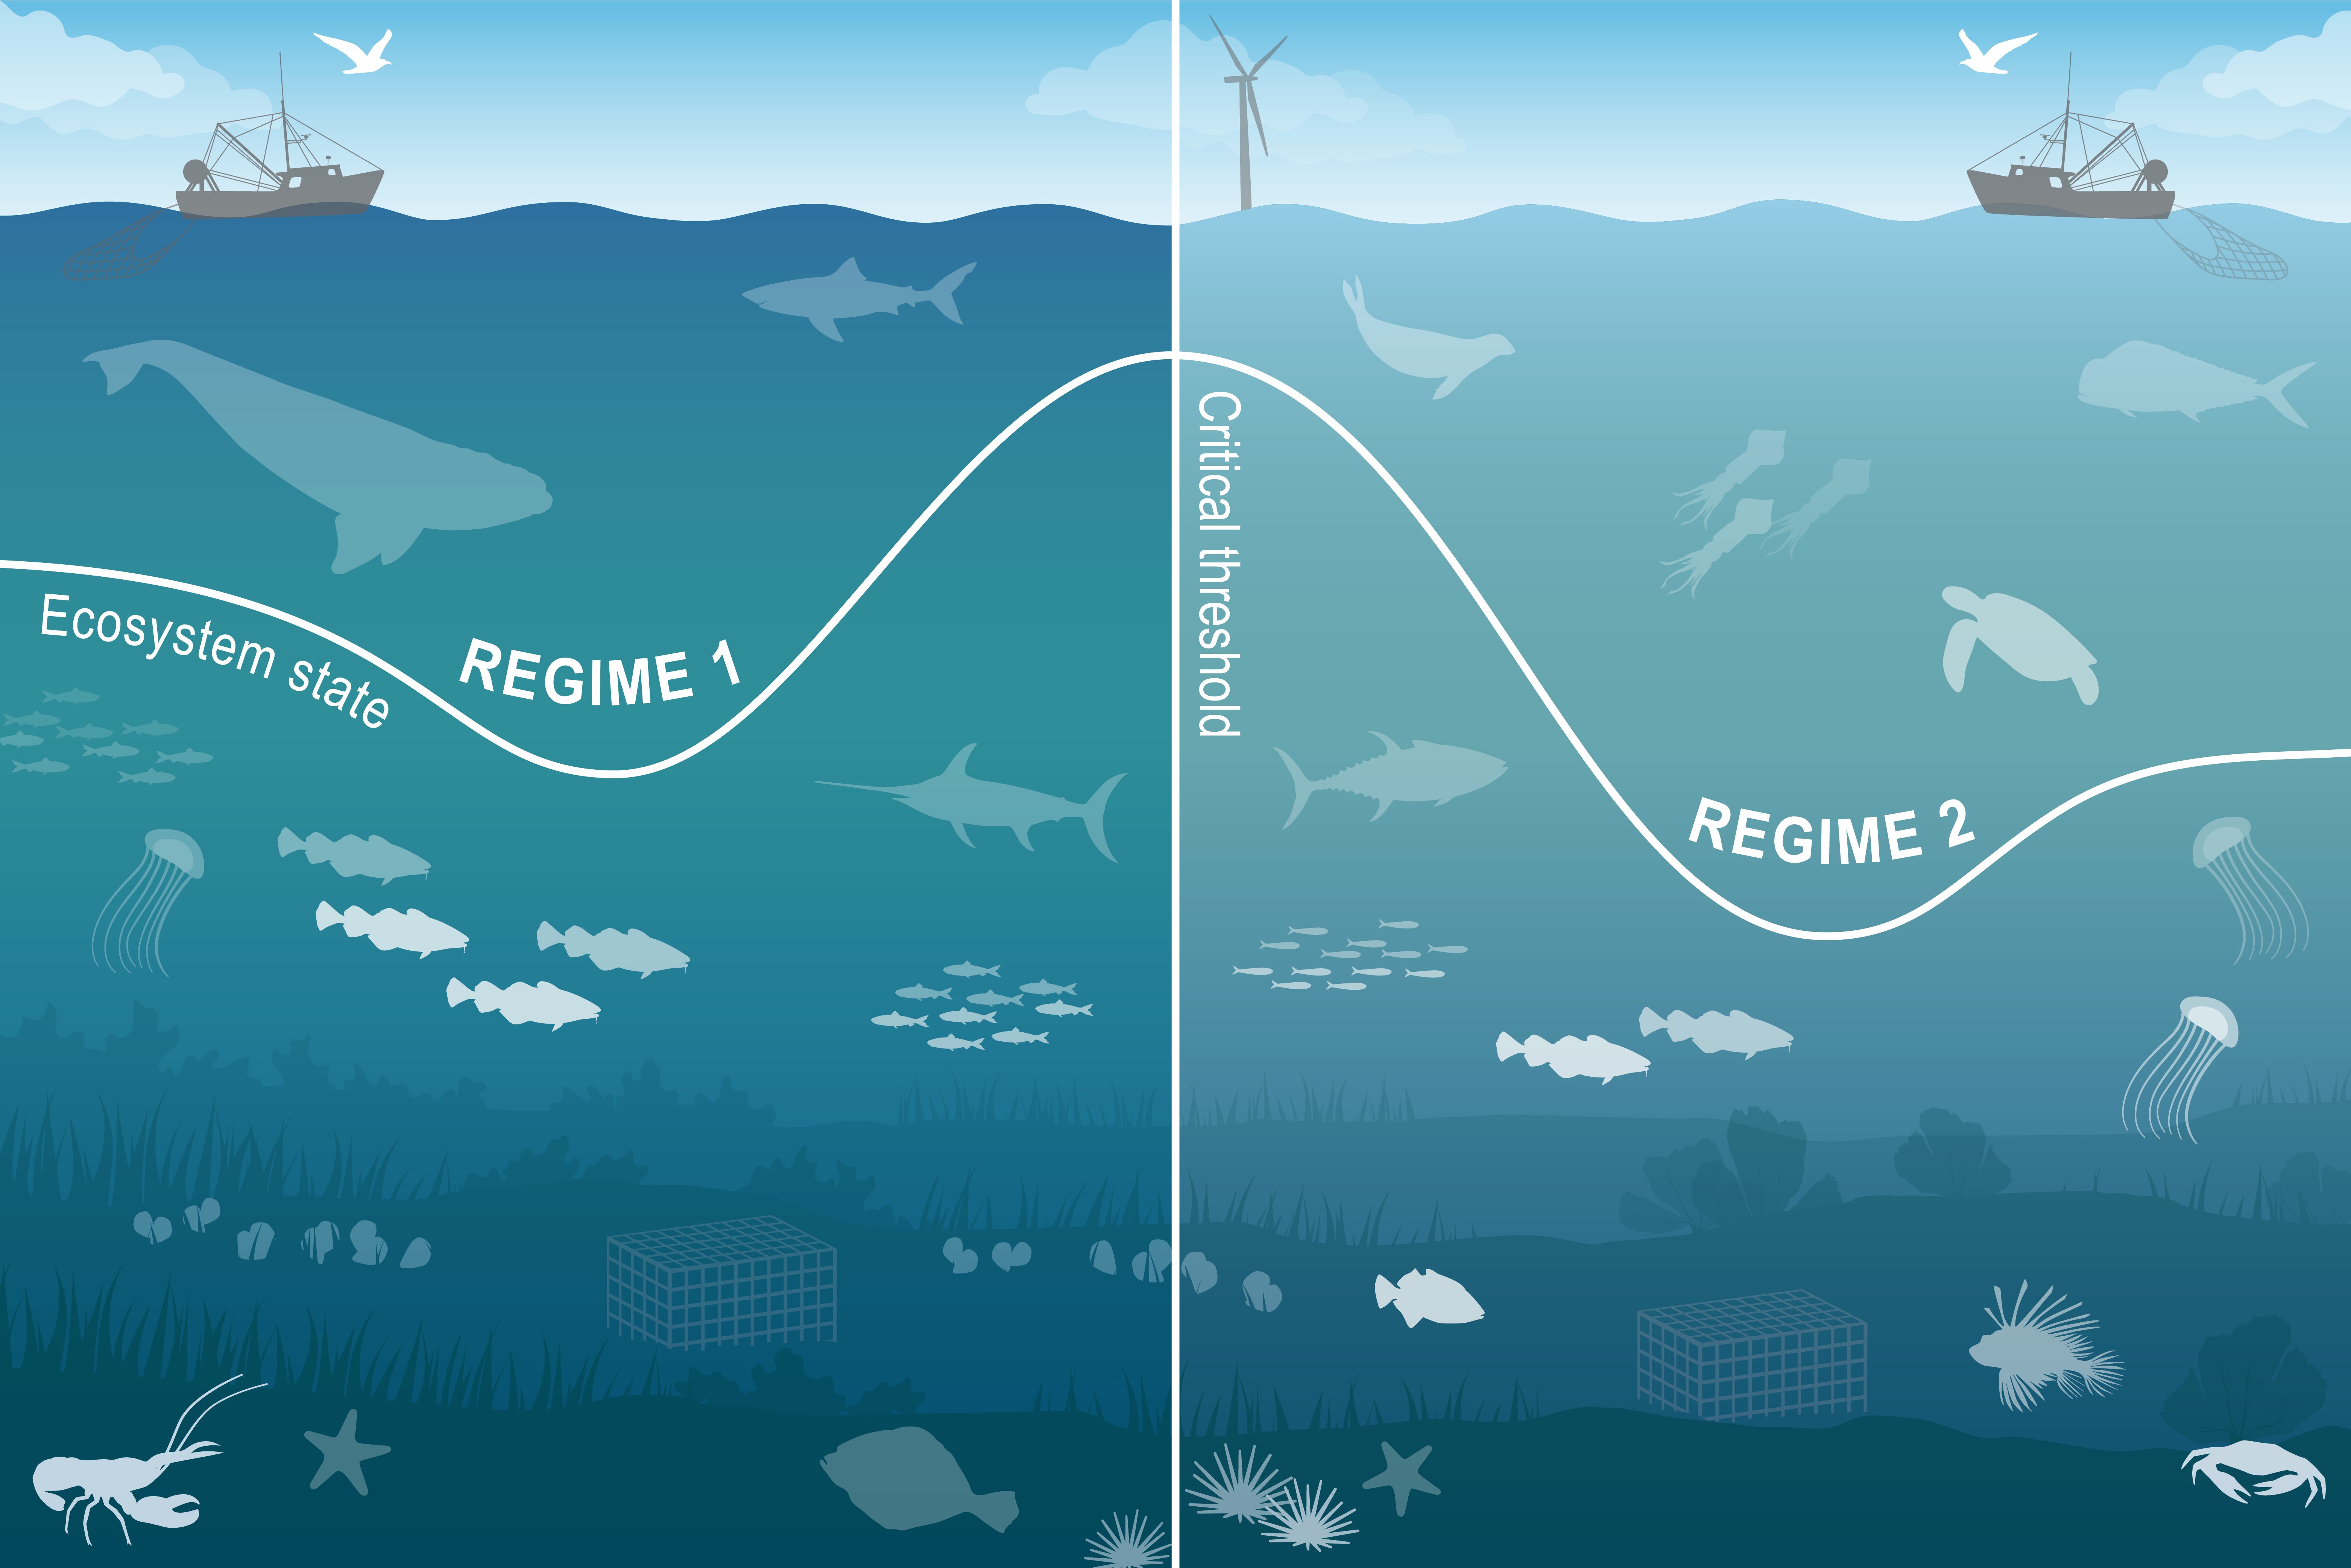 ] --- ## 2021 Report: Summary with visualizations (Draft) .pull-left[ 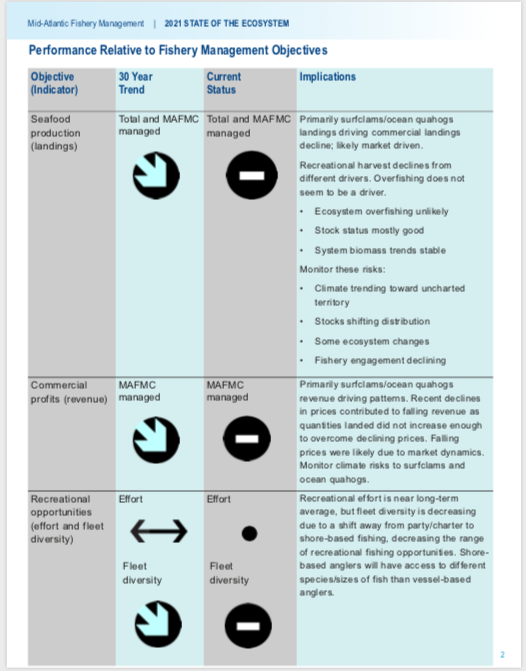 ] .pull-right[  ] --- ## Objective: Seafood production Mid-Atlantic - Landings .pull-left[ * Surfclams/Ocean quahogs driving decline * Likely market driven <img src="20210223_NEFSC_GARFO_Bastille_files/figure-html/unnamed-chunk-2-1.png" width="504" style="display: block; margin: auto;" /> .contrib[ Black line = total landings and red line = total landings from council-managed species ] ] .pull-right[ * Multiple Drivers of recreational decline <img src="20210223_NEFSC_GARFO_Bastille_files/figure-html/unnamed-chunk-3-1.png" width="504" style="display: block; margin: auto;" /> ] --- ## Objective: Commercial Profits New England - Revenue and Bennet .pull-left[ * Driven by single species. * GB: High revenue caused by high volume/price from scallops. * GB: Fluctuations associated with rotational management areas. * GOM: Total regional revenue high due to high lobster prices, despite lower volume. ] .pull-right[ <img src="20210223_NEFSC_GARFO_Bastille_files/figure-html/unnamed-chunk-5-1.png" width="504" style="display: block; margin: auto;" /> .contrib[ Black line = total revenue and red line = total revenue from council-managed species ] <img src="20210223_NEFSC_GARFO_Bastille_files/figure-html/unnamed-chunk-6-1.png" width="504" style="display: block; margin: auto;" /> ] --- ## Objective: Recreation Mid-Atlantic - Recreational effort and diversity .pull-left[ * Effort near long-term average. <img src="20210223_NEFSC_GARFO_Bastille_files/figure-html/unnamed-chunk-8-1.png" width="504" style="display: block; margin: auto;" /> ] .pull-right[ * Fleet diversity decreasing due to a shift away from party/charter to shore-based fishing. <img src="20210223_NEFSC_GARFO_Bastille_files/figure-html/unnamed-chunk-9-1.png" width="504" style="display: block; margin: auto;" /> ] --- ## Objective: Stability New England - Fisheries and Ecological Diversity .pull-left[ * Commercial fleet diversity indicates a shift toward reliance on fewer species, as noted under revenue. <img src="20210223_NEFSC_GARFO_Bastille_files/figure-html/unnamed-chunk-11-1.png" width="504" style="display: block; margin: auto;" /> ] .pull-right[ * Overall indicators suggest stability but several metrics are increasing and should be monitored as warning signs for potential regime shift or ecosystem restructuring. <img src="20210223_NEFSC_GARFO_Bastille_files/figure-html/unnamed-chunk-13-1.png" width="504" style="display: block; margin: auto;" /><img src="20210223_NEFSC_GARFO_Bastille_files/figure-html/unnamed-chunk-13-2.png" width="504" style="display: block; margin: auto;" /> ] --- ## Objective: Social & Cultural Mid-Atlantic - Recreational and Commercial engagement, reliance, and social vulnerability * Highlighted communities vulnerable to changes in fishing patterns. * May have lower ability to successfully respond to change. * May also be vulnerable to environmental justice issues. .pull-left[ <img src="20210223_NEFSC_GARFO_Bastille_files/figure-html/unnamed-chunk-15-1.png" width="504" style="display: block; margin: auto;" /> ] .pull-right[ <img src="20210223_NEFSC_GARFO_Bastille_files/figure-html/unnamed-chunk-17-1.png" width="504" style="display: block; margin: auto;" /> ] --- ## Objective: Protected Species Shelfwide - Species bycatch * Shifts in population distribution combined with fishery shifts * Population increase for seals .pull-left[ <img src="20210223_NEFSC_GARFO_Bastille_files/figure-html/unnamed-chunk-18-1.png" width="504" style="display: block; margin: auto;" /> ] .pull-right[ <img src="20210223_NEFSC_GARFO_Bastille_files/figure-html/unnamed-chunk-19-1.png" width="504" style="display: block; margin: auto;" /> ] --- ## Objective: Protected Species Shelfwide - Endangered species abundance * NARW combined fishery interactions/ship strikes, distribution shifts, and copepod availability * Unusual mortality events for 3 large whale species, harbor and gray seals .pull-left[ <img src="20210223_NEFSC_GARFO_Bastille_files/figure-html/unnamed-chunk-20-1.png" width="504" style="display: block; margin: auto;" /> ] .pull-right[ <img src="20210223_NEFSC_GARFO_Bastille_files/figure-html/unnamed-chunk-21-1.png" width="504" style="display: block; margin: auto;" /> ] --- ## Risks to meeting fishery management objectives - Climate .pull-left[ <img src="20210223_NEFSC_GARFO_Bastille_files/figure-html/unnamed-chunk-23-1.png" width="504" style="display: block; margin: auto;" /> <img src="20210223_NEFSC_GARFO_Bastille_files/figure-html/unnamed-chunk-25-1.png" width="504" style="display: block; margin: auto;" /> ] .pull-right[ * Gulf stream continues to push further north. * Little to no Labrador Slope Water entering the Gulf of Maine. * Bottom temp continues to increase in all regions. <img src="20210223_NEFSC_GARFO_Bastille_files/figure-html/unnamed-chunk-27-1.png" width="504" style="display: block; margin: auto;" /> .contrib[ Black line = in situ bottom temp and red line = GLORYS bottom temp ] ] --- ## Risks to meeting fishery management objectives - Climate * Surfclams and ocean quahogs sensitive to warming and ocean acidifcation * Acidification in surfclam summer habitat is approaching, but not yet at, levels affecting surf clam growth. .pull-left[  ] .pull-right[ <img src="20210223_NEFSC_GARFO_Bastille_files/figure-html/unnamed-chunk-29-1.png" width="504" style="display: block; margin: auto;" /> ] --- ## Risks to meeting fishery management objectives - Climate .pull-left[ * Frequent marine heatwaves occurred, with Georges Bank experiencing the warmest event on record at 4.3 degrees above average. <img src="20210223_NEFSC_GARFO_Bastille_files/figure-html/unnamed-chunk-31-1.png" width="504" style="display: block; margin: auto;" /> ] .pull-right[ <img src="20210223_NEFSC_GARFO_Bastille_files/figure-html/unnamed-chunk-33-1.png" width="504" style="display: block; margin: auto;" /> ] --- ## Risks to meeting fishery management objectives - Climate .pull-left[  ] .pull-right[ <img src="20210223_NEFSC_GARFO_Bastille_files/figure-html/unnamed-chunk-35-1.png" width="504" style="display: block; margin: auto;" /> * Blue Crabs - reduced overwintering mortality * Striped Bass - low recruitment success ] --- ## Risks to meeting fishery management objectives - Climate <img src="20210223_NEFSC_GARFO_Bastille_files/figure-html/unnamed-chunk-37-1.png" width="504" style="display: block; margin: auto;" /> <img src="20210223_NEFSC_GARFO_Bastille_files/figure-html/unnamed-chunk-38-1.png" width="504" style="display: block; margin: auto;" /> * Primary production continues to be high. Years with large fall phytoplankton blooms, such as 2020, have been linked to large haddock recruitment events on Georges Bank. --- ## Risks to Meeting fishery management objectives - Wind .pull-left[  ] .pull-right[ <img src="20210223_NEFSC_GARFO_Bastille_files/figure-html/unnamed-chunk-39-1.png" width="504" style="display: block; margin: auto;" /> * More than 20 offshore wind development projects proposed. * Offshore wind areas may cover more than 1.7 million acres by 2030. * Scientific surveys collecting data for ocean and ecosystem conditions, fish, and protected species will be altered, potentially increasing uncertainty for management decision-making. ] --- ## Risks to Meeting fishery management objectives - Wind .pull-left[ <img src="20210223_NEFSC_GARFO_Bastille_files/figure-html/unnamed-chunk-41-1.png" width="504" style="display: block; margin: auto;" /> ] .pull-right[ * If all sites are developed, 2-24% of total average revenue could be displaced for major Mid-Atlantic species in lease areas. * Displaced fishing effort can alter fishing methods, which can in turn change habitat, species (managed and protected), and fleet interactions. * Right whales may be displaced, and altered local oceanography could affect distribution of their zooplankton prey. ] --- ## SOE - Timeline <div id="htmlwidget-6a703ea6ce7c33399c19" style="width:100%;height:110%;" class="widgetframe html-widget"></div> <script type="application/json" data-for="htmlwidget-6a703ea6ce7c33399c19">{"x":{"url":"20210223_NEFSC_GARFO_Bastille_files/figure-html//widgets/widget_SOEtime.html","options":{"xdomain":"*","allowfullscreen":false,"lazyload":false}},"evals":[],"jsHooks":[]}</script> --- ## SOE Workflow - Focus on open science 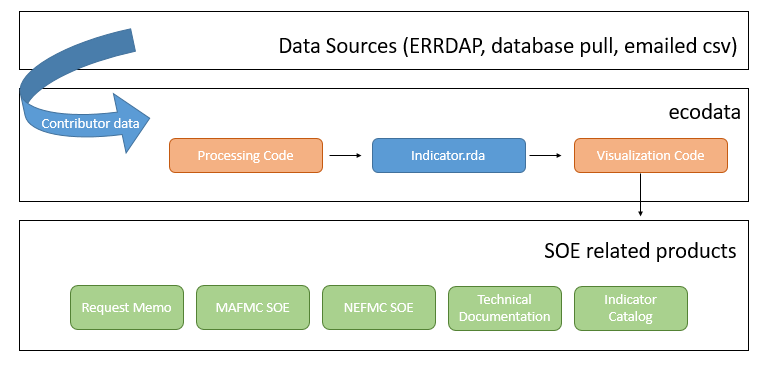 .pull-left[ .contrib[ * [ecodata R package](https://github.com/noaa-edab/ecodata) * [Technical Documentation](https://noaa-edab.github.io/tech-doc) * [Indicator catalog](https://noaa-edab.github.io/catalog/) ] ] .pull-right[ .contrib[ * [NEFMC SOE](https://github.com/NOAA-EDAB/SOE-NEFMC) * [MAFMC SOE](https://github.com/NOAA-EDAB/SOE-MAFMC) * [Request Memo](https://github.com/NOAA-EDAB/memos) ] ] --- ## Indicator Catalog .pull-left[ 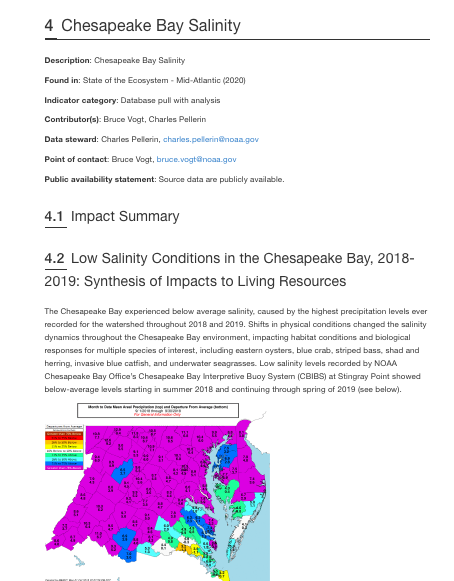 .contrib[ * [Chesapeake Bay Salinity Catalog Chapter](https://noaa-edab.github.io/catalog/chesapeake-bay-salinity.html) ] ] .pull-right[ * Example of open data science tools * Collate the indicator information * Provide place for further explanation and context * Starting point for other ecosystem reporting products * Link to [get involved](https://docs.google.com/forms/d/e/1FAIpQLSeJTAXRIxncwePR9lsVGtVY24SA_YOXGXPFL_IKV-n7hnRjJw/viewform?usp=sf_link) ] --- ## Contributors - THANK YOU! The New England and Mid-Atlantic SOEs made possible by (at least) 38 contributors from 8 institutions .pull-left[ .contrib[ Andy Beet<br> Kimberly Bastille<br> Ruth Boettcher (Virginia Department of Game and Inland Fisheries)<br> Zhuomin Chen (Woods Hole Oceanographic Institute)<br> Doug Christel (GARFO)<br> Patricia Clay<br> Lisa Colburn<br> Jennifer Cudney (NMFS Atlantic HMS Management Division)<br> Tobey Curtis (NMFS Atlantic HMS Management Division)<br> Geret DePiper<br> Michael Fogarty<br> Paula Fratantoni<br> Kevin Friedland<br> Sarah Gaichas<br> Avijit Ben Galuardi (GARFO)<br> Gangopadhyay (School for Marine Science and Technology, University of Massachusetts Dartmouth)<br> James Gartland (Virginia Institute of Marine Science)<br> Glen Gawarkiewicz (Woods Hole Oceanographic Institution)<br> Sean Hardison<br> Kimberly Hyde<br> John Kosik<br> Steve Kress (National Audubon Society’s Seabird Restoration Program)<br> Young-Oh Kwon (Woods Hole Oceanographic Institute)<br> Scott Large<br> Andrew Lipsky<br> Sean Lucey ] ] .pull-right[ .contrib[ Don Lyons (National Audubon Society’s Seabird Restoration Program)<br> Chris Melrose<br> Shannon Meseck<br> Ryan Morse<br> Kimberly Murray<br> Chris Orphanides<br> Richard Pace<br> Charles Perretti<br> Grace Saba (Rutgers)<br> Vincent Saba<br> Chris Schillaci (GARFO)<br> Angela Silva<br> Emily Slesinger (Rutgers University)<br> Laurel Smith<br> Talya tenBrink (GARFO)<br> John Walden<br> Harvey Walsh<br> Changhua Weng<br> Mark Wuenschel. ] ] .center[  ] --- ## Additional resources .pull-left[ * [2020 State of the Ecosystem Reports](https://www.fisheries.noaa.gov/new-england-mid-atlantic/ecosystems/state-ecosystem-reports-northeast-us-shelf) * [ecodata R package](https://github.com/noaa-edab/ecodata) * Visualizations: * [Mid-Atlantic Human Dimensions indicators](http://noaa-edab.github.io/ecodata/human_dimensions_MAB) * [Mid-Atlantic Macrofauna indicators](http://noaa-edab.github.io/ecodata/macrofauna_MAB) * [Mid-Atlantic Lower trophic level indicators](https://noaa-edab.github.io/ecodata/LTL_MAB) * [New England Human Dimensions indicators](http://noaa-edab.github.io/ecodata/human_dimensions_NE) * [New England Macrofauna indicators](http://noaa-edab.github.io/ecodata/macrofauna_NE) * [New England Lower trophic level indicators](https://noaa-edab.github.io/ecodata/LTL_NE) * [SOE Technical Documentation](https://noaa-edab.github.io/tech-doc) * [Draft indicator catalog](https://noaa-edab.github.io/catalog/) .contrib[ * Slides available at https://noaa-edab.github.io/presentations * Contact: <Kimberly.bastille@noaa.gov>, <Sarah.gaichas@noaa.gov>, <Sean.Lucey@noaa.gov> ] ] .pull-right[  ]