class: right, middle, my-title, title-slide # State of the Ecosystem: ## 2020 Overview ### Kimberly Bastille<sup>1,2</sup>, Sean Lucey<sup>1</sup>, Sarah Gaichas<sup>1</sup>, <br /> Geret DePiper<sup>1</sup>, Kimberly Hyde<sup>1</sup>, and Scott Large<sup>1</sup> <br /> Northeast Fisheries Science Center<sup>1</sup> <br /> Integrated Statistics<sup>2</sup> --- class: top, left # Integrated Ecosystem Assessment .pull-left[ <br> IEA Approach - Supports shift to ecosystem based management - Iterative - Collaborative ] .pull-right[ *The IEA Loop<sup>1</sup>* 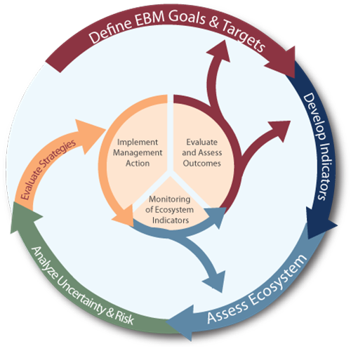 ] .footnote[ [1] https://www.integratedecosystemassessment.noaa.gov/national/IEA-approach ] ??? --- ## State of the Ecosystem (SOE) Reporting 1. Clear linkage of ecosystem indicators with management objectives 1. Synthesis across indicators for big picture 1. Objectives related to human-well being placed first in report 1. Short (< 30 pages), non-technical (but rigorous) text 1. Emphasis on reproducibility .center[  ] ??? --- ## Two page summary with visualizations .pull-left[ 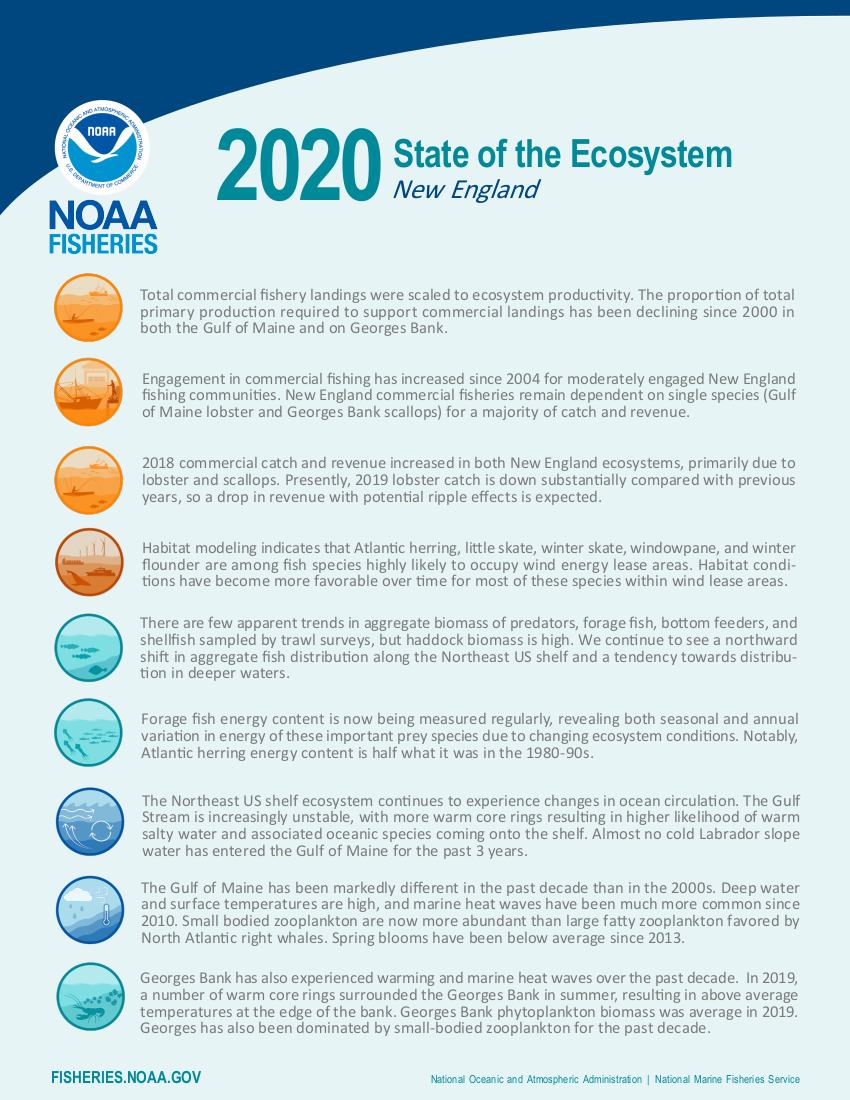 ] .pull-right[ 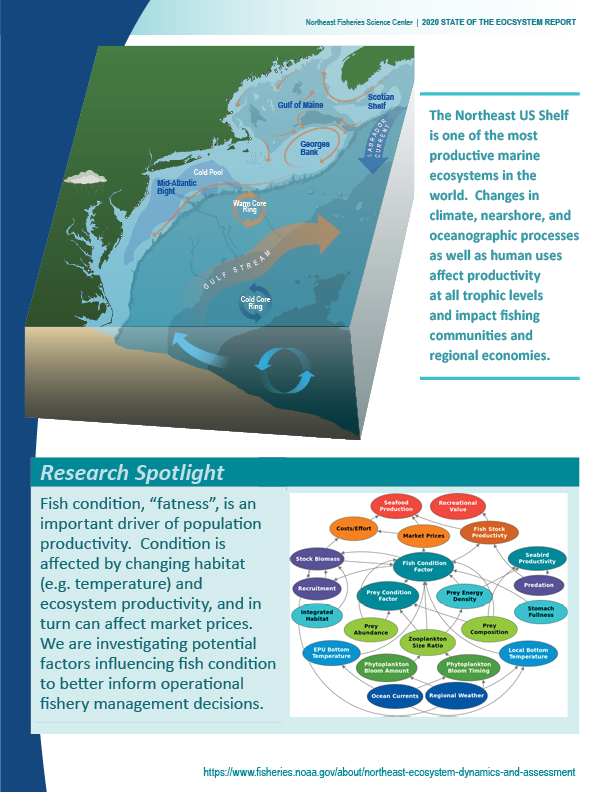 ] --- ## Document orientation .pull-left[ <br>  ] .pull-right[ <br> | Acronym | Definition | |:-------------------|:--------------------------------------------------------------------| | SOE | State of the Ecosystem | | FMC | Fisheries Management Council | | MA | Mid-Atlantic | | NE | New England | | GOM | Gulf of Maine | | GB | Georges Bank | | MAB | Mid-Atlantic Bight | ] Mapping trawl survey strata to Ecological Production Units (EPUs) .contrib[ [More information on EPUs](https://noaa-edab.github.io/tech-doc/epu.html) [More information on survey data](https://noaa-edab.github.io/tech-doc/survdat.html) ] --- ## Commercial fisheries and ecosystem productivity *Primary Production Required to support landings - Fraction of primary production used by fisheries* .pull-left[ - Both MA and NE declining since 2000 <img src="20200520_SOE-seminar_Bastille_files/figure-html/ppr-mab-1.png" width="360" /> <img src="20200520_SOE-seminar_Bastille_files/figure-html/ppr-gb-1.png" width="360" /> *Many assumptions to explore* ] .pull-right[ MAB Species Compositon  ] --- ## Commercial fisheries engagement, landings, revenue .center[ <img src="20200520_SOE-seminar_Bastille_files/figure-html/MAB-comm-engagement-trend-1.png" width="720" /> ] Fewer highly engaged Mid-Atlantic communities; engagement scores for medium-highly engaged communities decreasing .pull-left[ <img src="20200520_SOE-seminar_Bastille_files/figure-html/total-landings-1.png" width="360" /> ] .pull-right[ <img src="20200520_SOE-seminar_Bastille_files/figure-html/comm-revenue-1.png" width="360" /> ] --- ## Recreational fishing in the Mid-Atlantic .pull-left[ Lowest recreational landings recorded in 2018--why? <img src="20200520_SOE-seminar_Bastille_files/figure-html/rec-landings-1.png" width="360" /> Effort trend similar to previous reports <img src="20200520_SOE-seminar_Bastille_files/figure-html/rec-op-1.png" width="360" /> ] .pull-right[ Significant decrease in recreational fleet diversity <img src="20200520_SOE-seminar_Bastille_files/figure-html/rec-div-1.png" width="360" /> Splitting out SAFMC, ASFMC removed downward catch diversity trend <img src="20200520_SOE-seminar_Bastille_files/figure-html/rec-div2-1.png" width="360" /> ] --- ## Commercial fisheries: Revenue * Total Revenue in both NE regions is up * Largely dependent on single species * Fluctuations on Georges Bank associated with rotational management (Scallops) .pull-left[ **Georges Bank** <img src="20200520_SOE-seminar_Bastille_files/figure-html/comm-revenue-gb-1.png" width="360" /> <img src="20200520_SOE-seminar_Bastille_files/figure-html/bennet-gb-1.png" width="360" /> ] .pull-right[ **Gulf of Maine** <img src="20200520_SOE-seminar_Bastille_files/figure-html/comm-revenue-gom-1.png" width="360" /> <img src="20200520_SOE-seminar_Bastille_files/figure-html/bennet-gom-1.png" width="360" /> ] --- ## Fish stock status - Mid-Atlantic Change from 2019: bluefish biomass below threshold <img src="20200520_SOE-seminar_Bastille_files/figure-html/stock-status-1.png" width="720" /> --- ## Fish stock status - New England Very high Gulf of Maine haddock biomass <img src="20200520_SOE-seminar_Bastille_files/figure-html/stock-status-ne-1.png" width="720" /> --- ## Other ocean uses: wind energy fish habitat overlap <table class="risktable table" style="font-size: 11px; margin-left: auto; margin-right: auto;"> <thead> <tr> <th style="border-bottom:hidden" colspan="1"></th> <th style="border-bottom:hidden; padding-bottom:0; padding-left:3px;padding-right:3px;text-align: center; " colspan="2"><div style="border-bottom: 1px solid #ddd; padding-bottom: 5px; ">Existing - North</div></th> <th style="border-bottom:hidden; padding-bottom:0; padding-left:3px;padding-right:3px;text-align: center; " colspan="2"><div style="border-bottom: 1px solid #ddd; padding-bottom: 5px; ">Proposed - North</div></th> <th style="border-bottom:hidden; padding-bottom:0; padding-left:3px;padding-right:3px;text-align: center; " colspan="2"><div style="border-bottom: 1px solid #ddd; padding-bottom: 5px; ">Existing - Mid</div></th> <th style="border-bottom:hidden; padding-bottom:0; padding-left:3px;padding-right:3px;text-align: center; " colspan="2"><div style="border-bottom: 1px solid #ddd; padding-bottom: 5px; ">Proposed - Mid</div></th> <th style="border-bottom:hidden; padding-bottom:0; padding-left:3px;padding-right:3px;text-align: center; " colspan="2"><div style="border-bottom: 1px solid #ddd; padding-bottom: 5px; ">Existing - South</div></th> </tr> <tr> <th style="text-align:left;font-weight: bold;"> Season </th> <th style="text-align:left;font-weight: bold;"> Species </th> <th style="text-align:left;font-weight: bold;"> Trend </th> <th style="text-align:left;font-weight: bold;"> Species </th> <th style="text-align:left;font-weight: bold;"> Trend </th> <th style="text-align:left;font-weight: bold;"> Species </th> <th style="text-align:left;font-weight: bold;"> Trend </th> <th style="text-align:left;font-weight: bold;"> Species </th> <th style="text-align:left;font-weight: bold;"> Trend </th> <th style="text-align:left;font-weight: bold;"> Species </th> <th style="text-align:left;font-weight: bold;"> Trend </th> </tr> </thead> <tbody> <tr> <td style="text-align:left;"> Spring </td> <td style="text-align:left;"> Little Skate </td> <td style="text-align:left;"> `\(\nearrow\)` </td> <td style="text-align:left;"> Atlantic Herring </td> <td style="text-align:left;"> </td> <td style="text-align:left;"> Little Skate </td> <td style="text-align:left;"> `\(\nearrow\)` </td> <td style="text-align:left;"> Spiny Dogfish </td> <td style="text-align:left;"> `\(\nearrow\)` </td> <td style="text-align:left;"> Spiny Dogfish </td> <td style="text-align:left;"> `\(\nearrow\)` </td> </tr> <tr> <td style="text-align:left;"> Spring </td> <td style="text-align:left;"> Atlantic Herring </td> <td style="text-align:left;"> `\(\searrow\)` </td> <td style="text-align:left;"> Little Skate </td> <td style="text-align:left;"> `\(\nearrow\)` </td> <td style="text-align:left;"> Atlantic Herring </td> <td style="text-align:left;"> `\(\searrow\)` </td> <td style="text-align:left;"> Atlantic Herring </td> <td style="text-align:left;"> `\(\searrow\)` </td> <td style="text-align:left;"> Longfin Squid </td> <td style="text-align:left;"> `\(\nearrow\)` </td> </tr> <tr> <td style="text-align:left;"> Spring </td> <td style="text-align:left;"> Windowpane </td> <td style="text-align:left;"> `\(\nearrow\)` </td> <td style="text-align:left;"> Longhorn Sculpin </td> <td style="text-align:left;"> `\(\nearrow\)` </td> <td style="text-align:left;"> Spiny Dogfish </td> <td style="text-align:left;"> `\(\nearrow\)` </td> <td style="text-align:left;"> Little Skate </td> <td style="text-align:left;"> `\(\nearrow\)` </td> <td style="text-align:left;"> Summer Flounder </td> <td style="text-align:left;"> `\(\nearrow\)` </td> </tr> <tr> <td style="text-align:left;"> Spring </td> <td style="text-align:left;"> Winter Skate </td> <td style="text-align:left;"> `\(\nearrow\)` </td> <td style="text-align:left;"> Windowpane </td> <td style="text-align:left;"> `\(\nearrow\)` </td> <td style="text-align:left;"> Windowpane </td> <td style="text-align:left;"> `\(\nearrow\)` </td> <td style="text-align:left;"> Alewife </td> <td style="text-align:left;"> `\(\searrow\)` </td> <td style="text-align:left;"> Clearnose Skate </td> <td style="text-align:left;"> `\(\nearrow\)` </td> </tr> <tr> <td style="text-align:left;"> Spring </td> <td style="text-align:left;"> Longhorn Sculpin </td> <td style="text-align:left;"> `\(\nearrow\)` </td> <td style="text-align:left;"> Alewife </td> <td style="text-align:left;"> `\(\searrow\)` </td> <td style="text-align:left;"> Winter Skate </td> <td style="text-align:left;"> `\(\nearrow\)` </td> <td style="text-align:left;"> Silver Hake </td> <td style="text-align:left;"> `\(\nearrow\)` </td> <td style="text-align:left;"> Spotted Hake </td> <td style="text-align:left;"> `\(\nearrow\)` </td> </tr> <tr> <td style="text-align:left;"> Fall </td> <td style="text-align:left;"> Butterfish </td> <td style="text-align:left;"> `\(\nearrow\)` </td> <td style="text-align:left;"> Butterfish </td> <td style="text-align:left;"> `\(\nearrow\)` </td> <td style="text-align:left;"> Summer Flounder </td> <td style="text-align:left;"> `\(\nearrow\)` </td> <td style="text-align:left;"> Longhorn Sculpin </td> <td style="text-align:left;"> `\(\nearrow\)` </td> <td style="text-align:left;"> Longfin Squid </td> <td style="text-align:left;"> `\(\searrow\)` </td> </tr> <tr> <td style="text-align:left;"> Fall </td> <td style="text-align:left;"> Longfin Squid </td> <td style="text-align:left;"> `\(\nearrow\)` </td> <td style="text-align:left;"> Fourspot Flounder </td> <td style="text-align:left;"> </td> <td style="text-align:left;"> Longfin Squid </td> <td style="text-align:left;"> `\(\nearrow\)` </td> <td style="text-align:left;"> Little Skate </td> <td style="text-align:left;"> `\(\nearrow\)` </td> <td style="text-align:left;"> Northern Searobin </td> <td style="text-align:left;"> `\(\nearrow\)` </td> </tr> <tr> <td style="text-align:left;"> Fall </td> <td style="text-align:left;"> Summer Flounder </td> <td style="text-align:left;"> `\(\nearrow\)` </td> <td style="text-align:left;"> Longhorn Sculpin </td> <td style="text-align:left;"> `\(\searrow\)` </td> <td style="text-align:left;"> Butterfish </td> <td style="text-align:left;"> `\(\nearrow\)` </td> <td style="text-align:left;"> Butterfish </td> <td style="text-align:left;"> `\(\nearrow\)` </td> <td style="text-align:left;"> Clearnose Skate </td> <td style="text-align:left;"> `\(\nearrow\)` </td> </tr> <tr> <td style="text-align:left;"> Fall </td> <td style="text-align:left;"> Winter Flounder </td> <td style="text-align:left;"> `\(\searrow\)` </td> <td style="text-align:left;"> Summer Flounder </td> <td style="text-align:left;"> `\(\nearrow\)` </td> <td style="text-align:left;"> Smooth Dogfish </td> <td style="text-align:left;"> `\(\nearrow\)` </td> <td style="text-align:left;"> Sea Scallop </td> <td style="text-align:left;"> `\(\nearrow\)` </td> <td style="text-align:left;"> Butterfish </td> <td style="text-align:left;"> `\(\nearrow\)` </td> </tr> <tr> <td style="text-align:left;"> Fall </td> <td style="text-align:left;"> Spiny Dogfish </td> <td style="text-align:left;"> `\(\searrow\)` </td> <td style="text-align:left;"> Spiny Dogfish </td> <td style="text-align:left;"> `\(\searrow\)` </td> <td style="text-align:left;"> Windowpane </td> <td style="text-align:left;"> `\(\nearrow\)` </td> <td style="text-align:left;"> Fourspot Flounder </td> <td style="text-align:left;"> `\(\nearrow\)` </td> <td style="text-align:left;"> Spiny Dogfish/Spotted Hake </td> <td style="text-align:left;"> `\(\nearrow\)` </td> </tr> </tbody> </table> .pull-left[  ] .pull-right[ ## Fishery overlap to be added ] --- ## New information on forage fish energy density (ED) Forage fish energy content varies seasonally and annually Atlantic herring energy content may be half what it was in the 1980s-90s <table class="table" style="font-size: 11px; margin-left: auto; margin-right: auto;"> <thead> <tr> <th style="border-bottom:hidden" colspan="1"></th> <th style="border-bottom:hidden; padding-bottom:0; padding-left:3px;padding-right:3px;text-align: center; " colspan="2"><div style="border-bottom: 1px solid #ddd; padding-bottom: 5px; ">Spring 2017</div></th> <th style="border-bottom:hidden; padding-bottom:0; padding-left:3px;padding-right:3px;text-align: center; " colspan="2"><div style="border-bottom: 1px solid #ddd; padding-bottom: 5px; ">Fall 2017</div></th> <th style="border-bottom:hidden; padding-bottom:0; padding-left:3px;padding-right:3px;text-align: center; " colspan="2"><div style="border-bottom: 1px solid #ddd; padding-bottom: 5px; ">Spring 2018</div></th> <th style="border-bottom:hidden; padding-bottom:0; padding-left:3px;padding-right:3px;text-align: center; " colspan="2"><div style="border-bottom: 1px solid #ddd; padding-bottom: 5px; ">Fall 2018</div></th> <th style="border-bottom:hidden; padding-bottom:0; padding-left:3px;padding-right:3px;text-align: center; " colspan="2"><div style="border-bottom: 1px solid #ddd; padding-bottom: 5px; ">Total</div></th> <th style="border-bottom:hidden; padding-bottom:0; padding-left:3px;padding-right:3px;text-align: center; " colspan="1"><div style="border-bottom: 1px solid #ddd; padding-bottom: 5px; ">1980s</div></th> <th style="border-bottom:hidden; padding-bottom:0; padding-left:3px;padding-right:3px;text-align: center; " colspan="1"><div style="border-bottom: 1px solid #ddd; padding-bottom: 5px; ">1990s</div></th> </tr> <tr> <th style="text-align:left;font-weight: bold;"> Species </th> <th style="text-align:left;font-weight: bold;"> ED (SD) </th> <th style="text-align:right;font-weight: bold;"> N </th> <th style="text-align:left;font-weight: bold;"> ED (SD) </th> <th style="text-align:right;font-weight: bold;"> N </th> <th style="text-align:left;font-weight: bold;"> ED (SD) </th> <th style="text-align:right;font-weight: bold;"> N </th> <th style="text-align:left;font-weight: bold;"> ED (SD) </th> <th style="text-align:right;font-weight: bold;"> N </th> <th style="text-align:left;font-weight: bold;"> ED (SD) </th> <th style="text-align:right;font-weight: bold;"> N </th> <th style="text-align:right;font-weight: bold;"> ED </th> <th style="text-align:left;font-weight: bold;"> ED (SD) </th> </tr> </thead> <tbody> <tr> <td style="text-align:left;"> Alewife </td> <td style="text-align:left;"> 6.84 (1.62) </td> <td style="text-align:right;"> 128 </td> <td style="text-align:left;"> 8.12 (1.46) </td> <td style="text-align:right;"> 50 </td> <td style="text-align:left;"> 6.45 (1.21) </td> <td style="text-align:right;"> 47 </td> <td style="text-align:left;"> 7.41 (1.6) </td> <td style="text-align:right;"> 42 </td> <td style="text-align:left;"> 7.1 (1.62) </td> <td style="text-align:right;"> 267 </td> <td style="text-align:right;"> 6.4 </td> <td style="text-align:left;"> </td> </tr> <tr> <td style="text-align:left;"> Atl. Herring </td> <td style="text-align:left;"> 5.34 (0.94) </td> <td style="text-align:right;"> 122 </td> <td style="text-align:left;"> 5.77 (1.31) </td> <td style="text-align:right;"> 52 </td> <td style="text-align:left;"> 6.69 (0.85) </td> <td style="text-align:right;"> 51 </td> <td style="text-align:left;"> 5.41 (1.34) </td> <td style="text-align:right;"> 50 </td> <td style="text-align:left;"> 5.69 (1.19) </td> <td style="text-align:right;"> 275 </td> <td style="text-align:right;"> 10.6 </td> <td style="text-align:left;"> 9.4 (1.4) </td> </tr> <tr> <td style="text-align:left;"> Atl. Mackerel </td> <td style="text-align:left;"> </td> <td style="text-align:right;"> NA </td> <td style="text-align:left;"> 7.24 (1.13) </td> <td style="text-align:right;"> 50 </td> <td style="text-align:left;"> 5.33 (0.86) </td> <td style="text-align:right;"> 51 </td> <td style="text-align:left;"> 6.89 (1.07) </td> <td style="text-align:right;"> 50 </td> <td style="text-align:left;"> 6.48 (1.32) </td> <td style="text-align:right;"> 151 </td> <td style="text-align:right;"> 6.0 </td> <td style="text-align:left;"> </td> </tr> <tr> <td style="text-align:left;"> Butterfish </td> <td style="text-align:left;"> 7.13 (1.59) </td> <td style="text-align:right;"> 65 </td> <td style="text-align:left;"> 7.31 (1.45) </td> <td style="text-align:right;"> 89 </td> <td style="text-align:left;"> 4.91 (1.12) </td> <td style="text-align:right;"> 53 </td> <td style="text-align:left;"> 8.1 (2.7) </td> <td style="text-align:right;"> 50 </td> <td style="text-align:left;"> 6.92 (2.04) </td> <td style="text-align:right;"> 257 </td> <td style="text-align:right;"> 6.2 </td> <td style="text-align:left;"> </td> </tr> <tr> <td style="text-align:left;"> Illex </td> <td style="text-align:left;"> 5.54 (0.4) </td> <td style="text-align:right;"> 77 </td> <td style="text-align:left;"> 5.43 (0.51) </td> <td style="text-align:right;"> 52 </td> <td style="text-align:left;"> 5.5 (0.52) </td> <td style="text-align:right;"> 50 </td> <td style="text-align:left;"> 4.76 (0.79) </td> <td style="text-align:right;"> 50 </td> <td style="text-align:left;"> 5.33 (0.63) </td> <td style="text-align:right;"> 229 </td> <td style="text-align:right;"> 7.1 </td> <td style="text-align:left;"> 5.9 (0.56) </td> </tr> <tr> <td style="text-align:left;"> Loligo </td> <td style="text-align:left;"> 5.22 (0.36) </td> <td style="text-align:right;"> 83 </td> <td style="text-align:left;"> 5.24 (0.26) </td> <td style="text-align:right;"> 60 </td> <td style="text-align:left;"> 4.84 (0.63) </td> <td style="text-align:right;"> 52 </td> <td style="text-align:left;"> 4.6 (0.72) </td> <td style="text-align:right;"> 50 </td> <td style="text-align:left;"> 5.02 (0.56) </td> <td style="text-align:right;"> 245 </td> <td style="text-align:right;"> 5.6 </td> <td style="text-align:left;"> </td> </tr> <tr> <td style="text-align:left;"> Sand lance </td> <td style="text-align:left;"> 6.66 (0.54) </td> <td style="text-align:right;"> 18 </td> <td style="text-align:left;"> </td> <td style="text-align:right;"> NA </td> <td style="text-align:left;"> 5.78 (0.34) </td> <td style="text-align:right;"> 60 </td> <td style="text-align:left;"> 7.99 (0.74) </td> <td style="text-align:right;"> 8 </td> <td style="text-align:left;"> 6.17 (0.81) </td> <td style="text-align:right;"> 86 </td> <td style="text-align:right;"> 6.8 </td> <td style="text-align:left;"> 4.4 (0.82) </td> </tr> <tr> <td style="text-align:left;"> Silver hake </td> <td style="text-align:left;"> 4.25 (0.39) </td> <td style="text-align:right;"> 189 </td> <td style="text-align:left;"> 4.42 (0.45) </td> <td style="text-align:right;"> 50 </td> <td style="text-align:left;"> 4.19 (0.39) </td> <td style="text-align:right;"> 50 </td> <td style="text-align:left;"> 4.55 (0.63) </td> <td style="text-align:right;"> 50 </td> <td style="text-align:left;"> 4.31 (0.46) </td> <td style="text-align:right;"> 339 </td> <td style="text-align:right;"> 4.6 </td> <td style="text-align:left;"> </td> </tr> </tbody> </table> --- ## Fish condition Female fish "fatness" from fall surveys .pull-left-60[ **Georges Bank**  ] .pull-right-40[ **Research Spotlight** <br>  ] Linking condtition factor to changing habitat, ecosystem productivity and economics. --- ## Protected species .pull-left[ North Atlantic right whale abundance <img src="20200520_SOE-seminar_Bastille_files/figure-html/NARW-abundance-1.png" width="360" /> **New indicator** North Atlantic right whale calf births <img src="20200520_SOE-seminar_Bastille_files/figure-html/NARW-calf-abundance-1.png" width="360" /> ] .pull-right[ Seal population snapshots + ~75,000 harbor seals, trend analysis in progress + 30,000 - 40,000 grey seals in US; 425,000 in Canada and ↗ Seal diet studies in progress Unusual Mortality Events + [North Atlantic right whales](https://www.fisheries.noaa.gov/national/marine-life-distress/2017-2020-north-atlantic-right-whale-unusual-mortality-event) + [Humpback whales](https://www.fisheries.noaa.gov/national/marine-life-distress/2016-2020-humpback-whale-unusual-mortality-event-along-atlantic-coast) + [Minke whales](https://www.fisheries.noaa.gov/national/marine-life-distress/2017-2020-minke-whale-unusual-mortality-event-along-atlantic-coast) + [Grey, harbor, hooded, and harp seals](https://www.fisheries.noaa.gov/new-england-mid-atlantic/marine-life-distress/2018-2019-pinniped-unusual-mortality-event-along) ] --- ## Aggregate fish distribution and southern species .pull-left[ Overall fish biomass tracking northeast and deeper <img src="20200520_SOE-seminar_Bastille_files/figure-html/spec-dist1-1.png" width="360" /> ] .pull-right[ Southern species not increasing in surveys, but further north? <img src="20200520_SOE-seminar_Bastille_files/figure-html/blue-runner-1.png" width="504" /> ] --- ## Habitat condition: nearshore environments .pull-left[ Chesapeake Bay water quality update <img src="20200520_SOE-seminar_Bastille_files/figure-html/cb-salinity-1.png" width="360" /> Record high precipitation led to extreme low salinity event in spring 2019 Increased oyster mortality and further spread invasive catfish ] .pull-right[ Virginia nesting waterbird populations declining <img src="20200520_SOE-seminar_Bastille_files/figure-html/VA-cote-1.png" width="360" /> Declines attributed to habitat loss ] --- ## Habitat condition: large ocean current changes .pull-left[  * Bottom temp increasing on shelf * Cold Pool is warming * Almost no Labrador slope water entering the Gulf of Maine 2017-2019 ] .pull-right[ <img src="20200520_SOE-seminar_Bastille_files/figure-html/bot-temp-1.png" width="504" /> <img src="20200520_SOE-seminar_Bastille_files/figure-html/cold_pool-1.png" width="504" /> <img src="20200520_SOE-seminar_Bastille_files/figure-html/wsw-prop-1.png" width="504" /> ] --- ## Habitat condition: large ocean current changes .pull-left[  * More northerly Gulf Stream * More Gulf Stream warm core rings ] .pull-right[ <img src="20200520_SOE-seminar_Bastille_files/figure-html/GSI-1.png" width="360" /> <img src="20200520_SOE-seminar_Bastille_files/figure-html/warm-core-rings-1.png" width="432" /> ] --- ## Marine heatwaves: Georges Bank .pull-left[ <img src="20200520_SOE-seminar_Bastille_files/figure-html/seasonal-sst-1.png" width="504" /> ] .pull-right[  ] .center[ <img src="20200520_SOE-seminar_Bastille_files/figure-html/gb-heatwave-1.png" width="720" /> ] --- ## SOE Take Home Messages .center[    ] * Proportion of total primary production required to support commercial landings declining in both New England and Mid-Atlantic -- * Engagement in commercial fisheries since 2004 * Mid-Atlantic - descrease in medium-high engaged communities * New England - increase in moderately engaged communities -- * New England commercial fisheries remain dependent on single species * Gulf of Maine - lobster * Georges Bank - scallops -- * Habitat modeling indicates several species that are highly likely to occupy wind energy lease areas * Habitat conditions have become more favorable over time for most --- ## SOE Take Home Messages .center[    ] * Forage fish energy content shows seasonal and annual variation -- * Atlantic herring energy content half what it was in the 1980-90s -- * Continued northward shift in aggregate fish distribution and a tendency towards deeper waters --- ## SOE Take Home Messages .center[    ] * Heavy rains in 2018-2019 degraded Chesepeake Bay water quality * Increased oyster mortality and further spread invasive catfish -- * Cold pool is getting warmer -- * Almost no cold Labrador slope water has entered the Gulf of Maine for the past 3 years -- * Gulf Stream increasingly unstable -- * 2000 Regime shift in warm core rings -- * Increased number and severity in marine heat waves in all regions --- # SOE in action .pull-left[ <br> <br> <br> <br> * Feedback from FMCs * Improvements for next year * MAFMC risk assessment ] .pull-right[  ] --- ## Risk assessent indicators and ranking criteria: Commercial revenue This element is applied at the ecosystem level. Revenue serves as a proxy for commercial profits. .table[ .pull-left[ <br> | Risk Level | Definition | |:-------------------|:--------------------------------------------------------------------| | Low | No trend and low variability in revenue | | Low-Moderate | Increasing or high variability in revenue | | Moderate-High | Significant long term revenue decrease | | High | Significant recent decrease in revenue | ] ] .pull-right[ <img src="20200520_SOE-seminar_Bastille_files/figure-html/total-rev-1.png" width="360" /> <img src="20200520_SOE-seminar_Bastille_files/figure-html/bennet-1.png" width="360" /> ] Ranked moderate-high risk due to the significant long term revenue decrease for Mid-Atlantic managed species --- ## Contributors - THANK YOU! The New England and Mid-Atlantic SOEs made possible by (at least) 38 contributors from 8 institutions .pull-left[ .contrib[ Donald Anderson (Woods Hole Oceanographic Institute) <br> Andy Beet<br> Patricia Clay<br> Lisa Colburn<br> Geret DePiper<br> Michael Fogarty<br> Paula Fratantoni <br> Kevin Friedland<br> Sarah Gaichas<br> Avijit Gangopadhyay (School for Marine Science and Technology, University of Massachusetts Dartmouth)<br> James Gartland (Virginia Institute of Marine Science)<br> Glen Gawarkiewicz (Woods Hole Oceanographic Institution)<br> Sean Hardison<br> Kimberly Hyde<br> Terry Joyce (Woods Hole Oceanographic Institute)<br> John Kocik<br> Steve Kress (National Audubon Society)<br> Scott Large<br> Amanda Dillon (IBSS) ] ] .pull-right[ .contrib[ Don Lyons (National Audubon Society)<br> Ruth Boettcher (Virginia Department of Game and Inland Fisheries)<br> Young-Oh Kwon (Woods Hole Oceanographic Institution)<br> Zhuomin Chen (Woods Hole Oceanographic Institution)<br> Sean Lucey<br> Chris Melrose<br> Ryan Morse<br> Kimberly Murray<br> Chris Orphanides<br> Richard Pace<br> Charles Perretti<br> Vincent Saba<br> Laurel Smith<br> Mark Terceiro<br> John Walden<br> Harvey Walsh<br> Mark Wuenschel<br> Gail Wynne ] ] .center[  ] --- ## External Resources .pull-left[ * [MAFMC SOE 2020](https://static1.squarespace.com/static/511cdc7fe4b00307a2628ac6/t/5e9612485470883fc71477d6/1586893404414/2_SOE-MAFMC-2020-plus2pager.pdf) * [NEFMC SOE 2020](https://s3.amazonaws.com/nefmc.org/5b_SOE-NEFMC-2020-plus2pager-REVISED.pdf) * [SOE Technical Documentation](https://noaa-edab.github.io/tech-doc) * [ecodata R package](https://noaa-edab.github.io/ecodata/) * [Macrofauna indicators](http://noaa-edab.github.io/ecodata/macrofauna) * [Human Dimensions indicators](http://noaa-edab.github.io/ecodata/human_dimensions) * [Lower trophic level indicators](http://noaa-edab.github.io/ecodata/LTL) * [NOAA SOE summary webpage](https://www.fisheries.noaa.gov/new-england-mid-atlantic/ecosystems/state-ecosystem-reports-northeast-us-shelf) * [MAFMC Risk Assessment](https://static1.squarespace.com/static/511cdc7fe4b00307a2628ac6/t/5e96179e94960c020eaf42a2/1586894753110/4_MAB_RiskAssess_2020update.pdf) * Slides available at https://noaa-edab.github.io/presentations/ ] .pull-right[  Contacts: <kimberly.bastille@noaa.gov>, <sarah.gaichas@noaa.gov>, <sean.lucey@noaa.gov>, <scott.large@noaa.gov> <br> <br> Questions? ]