class: right, middle, my-title, title-slide # State of the Ecosystem: ## Mid-Atlantic and New England 2020<br />Update for ICES WGNARS ### Sarah Gaichas and Kim Bastille <br /> Ecosystem Dynamics and Assessment <br /> Northeast Fisheries Science Center --- class: top, left # Today's Talk .pull-left[ - Process overview - New! Response memo - 2020 Report summaries - Online resources + Tech documentation + ecodata R package + News story/webpage - Appendix with slides presented to Mid-Atlantic Council ] .pull-right[ *The IEA Loop<sup>1</sup>* 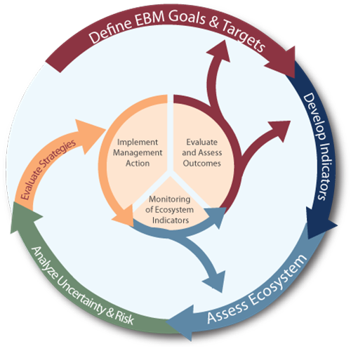 ] .footnote[ [1] https://www.integratedecosystemassessment.noaa.gov/national/IEA-approach ] ??? --- ## State of the Ecosystem (SOE) Reporting: Context for busy people *"So what?" --John Boreman, September 2016* 1. Clear linkage of ecosystem indicators with management objectives 1. Synthesis across indicators for big picture 1. Objectives related to human-well being placed first in report 1. Short (< 30 pages), non-technical (but rigorous) text 1. Emphasis on reproducibility .center[ 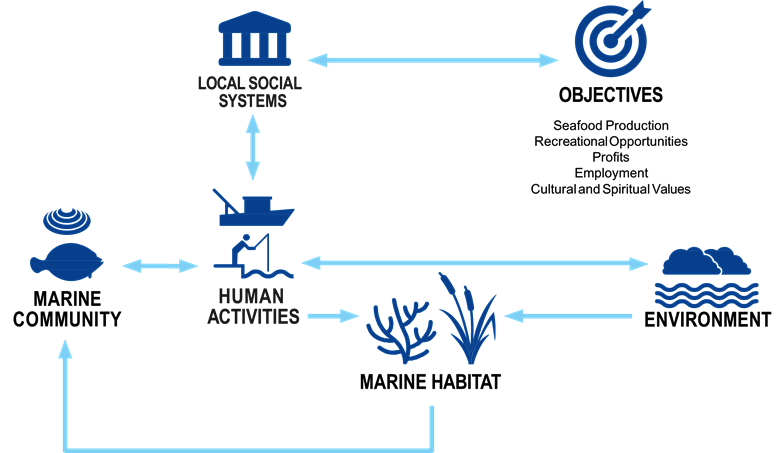 ] ??? In 2016, we began taking steps to address these common critiques of the ESR model --- ## Process and timeline for 2020 reports <div id="htmlwidget-cec8d730309d57311ceb" style="width:100%;height:504px;" class="widgetframe html-widget"></div> <script type="application/json" data-for="htmlwidget-cec8d730309d57311ceb">{"x":{"url":"20200508_US_SOEUpdate_Gaichas_files/figure-html//widgets/widget_SOEtime.html","options":{"xdomain":"*","allowfullscreen":false,"lazyload":false}},"evals":[],"jsHooks":[]}</script> ??? April 2019 + 2019 SOE Council presentations + Debrief meeting. Summarize Council comments, proritize 2020 objectives August 2019 + Workshop with current and new contributors, Council staff + Develop general outline and workplan for 2020 indicators September - November 2019 + Monthly subgroup check-ins + Graphics development: icons, map figure, 2 page summary format December 2019 + Indicator submission deadline mid-December + Data wrangling and visualization by Kim Bastille, superhero + 18 December initial synthesis January 2020 + Pre-synthesis workshop strawman developed + Synthesis workshop with all contributors, develop 2 page summary bullets + Collaborative text production in google doc February 2020 + Google doc to .Rmd with figures + Internal review Feb 14-27+ + Write response memo, Mid-Atlantic risk assessment March 2020 + SSC presentations + Final editing and submission to Councils April 2020: SOE Council presentations --- ## State of the Ecosystem 2020: Response Memo Our response to the need for more formal response to comments! * 30 comments or requests from 2019 * One addressed by having the response memo * 21 addressed within the SOE at SSC/Council request * New summary section with synthetic overview addresses 3 requests * 5 new indicators added * 3 existing indicators modified * 5 editorial updates * 5 partially addressed requests * 8 not currently addressed within SOE * 2 have information summaries in the response memo * 2 may be addressed by student projects * 1 needs feedback on how to deal with known data issue * 1 seeking data * 1 relevant to 2019 visualization that was replaced in 2020 * 1 beyond capacity to address at present SSC/Council feedback requested on the approach and all details, memo has specific questions --- ## State of the Ecosystem 2020: Structure .pull-left[ ### Report Structure 1. Summary 2 pager 1. Human dimensions 1. Protected species 1. Fish and invertebrates (managed and otherwise) 1. Habitat quality and ecosystem productivity ] .pull-right[ *Established ecosystem-scale objectives in the Mid-Atlantic* <table class="risktable table" style="font-size: 14px; margin-left: auto; margin-right: auto;"> <thead> <tr> <th style="text-align:left;font-weight: bold;"> Objective Categories </th> <th style="text-align:left;font-weight: bold;"> Indicators reported here </th> </tr> </thead> <tbody> <tr> <td style="text-align:left;"> Seafood Production </td> <td style="text-align:left;"> Landings by feeding group </td> </tr> <tr> <td style="text-align:left;"> Profits </td> <td style="text-align:left;"> Revenue decomposed to price and volume </td> </tr> <tr> <td style="text-align:left;"> Recreation </td> <td style="text-align:left;"> Days fished; recreational catch </td> </tr> <tr> <td style="text-align:left;"> Stability </td> <td style="text-align:left;"> Diversity indices (fishery and species) </td> </tr> <tr> <td style="text-align:left;"> Social & Cultural </td> <td style="text-align:left;"> Commercial engagement trends </td> </tr> <tr> <td style="text-align:left;"> Biomass </td> <td style="text-align:left;"> Biomass or abundance by feeding group from surveys </td> </tr> <tr> <td style="text-align:left;"> Productivity </td> <td style="text-align:left;"> Condition and recruitment of managed species, Primary productivity </td> </tr> <tr> <td style="text-align:left;"> Trophic structure </td> <td style="text-align:left;"> Relative biomass of feeding groups, Zooplankton </td> </tr> <tr> <td style="text-align:left;"> Habitat </td> <td style="text-align:left;"> Estuarine and offshore habitat conditions </td> </tr> </tbody> </table> ] --- ## New 2 page summary with visualizations .pull-left[ 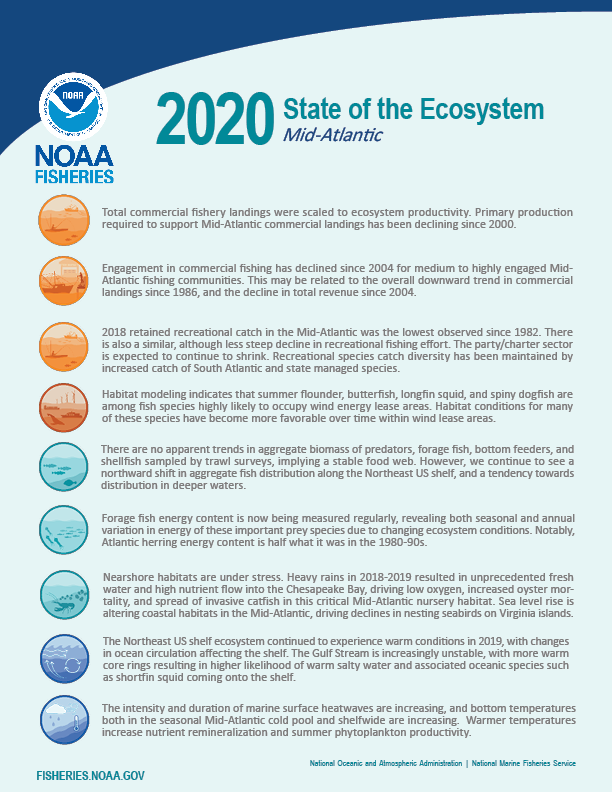 ] .pull-right[ 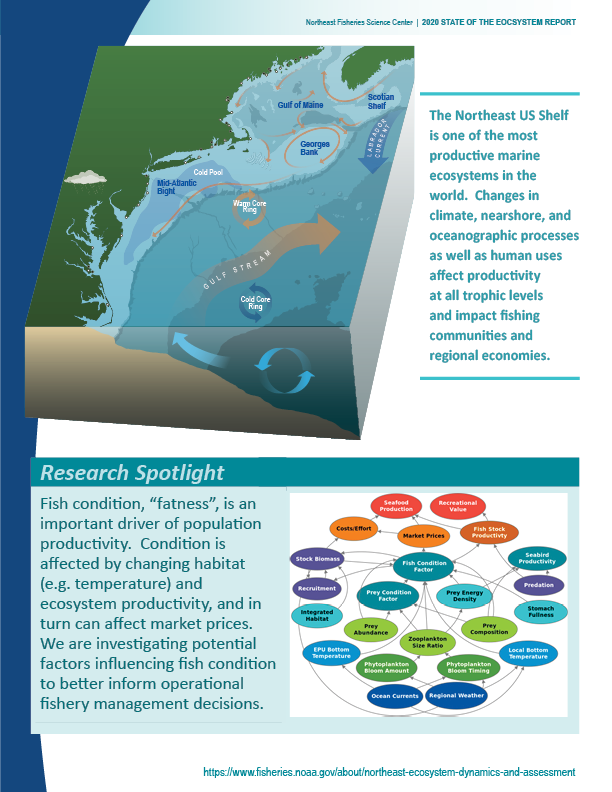 ] --- ## Research: linking report indicators for management use .pull-left[ 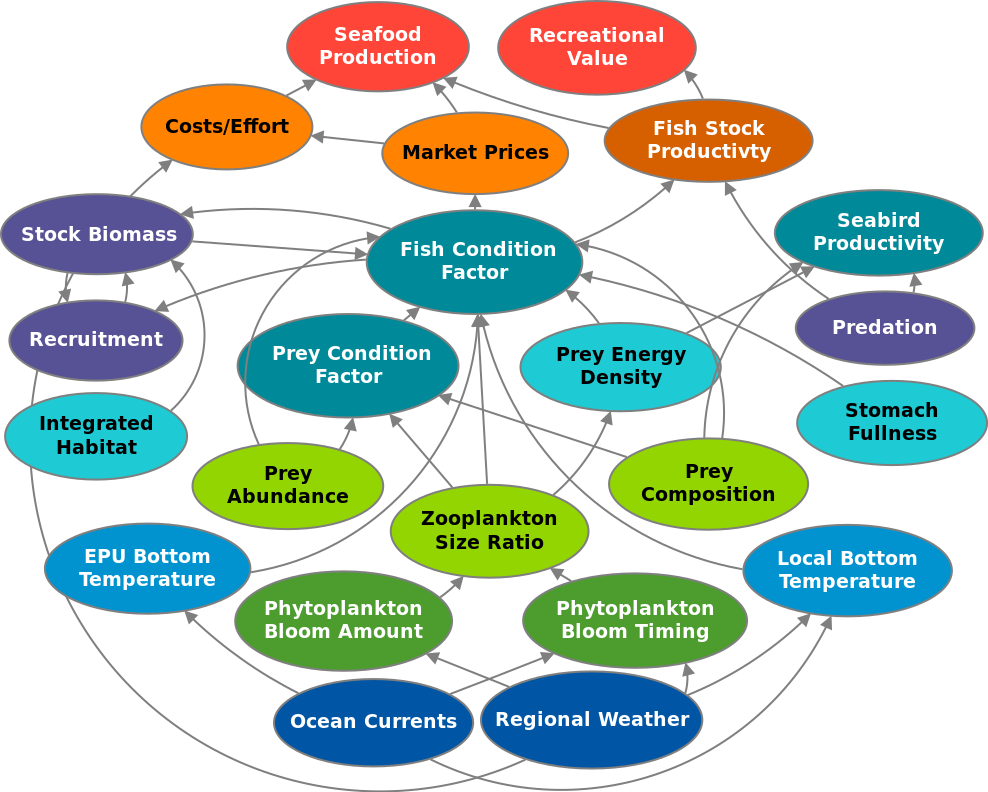 ] .pull-right[ 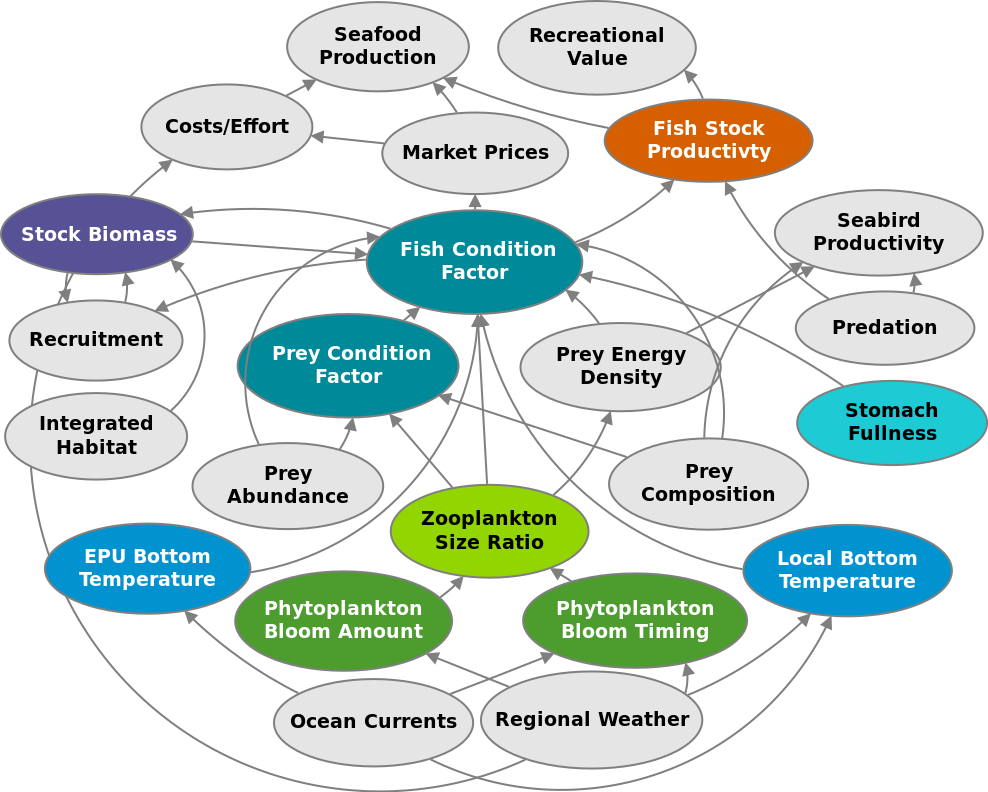 ] Conceptual model links indicators in the report with management objectives. A subset of objectives are currently under investigation. We plan to extend this work in 2020. --- ## Document orientation .pull-left[ Spatial scale 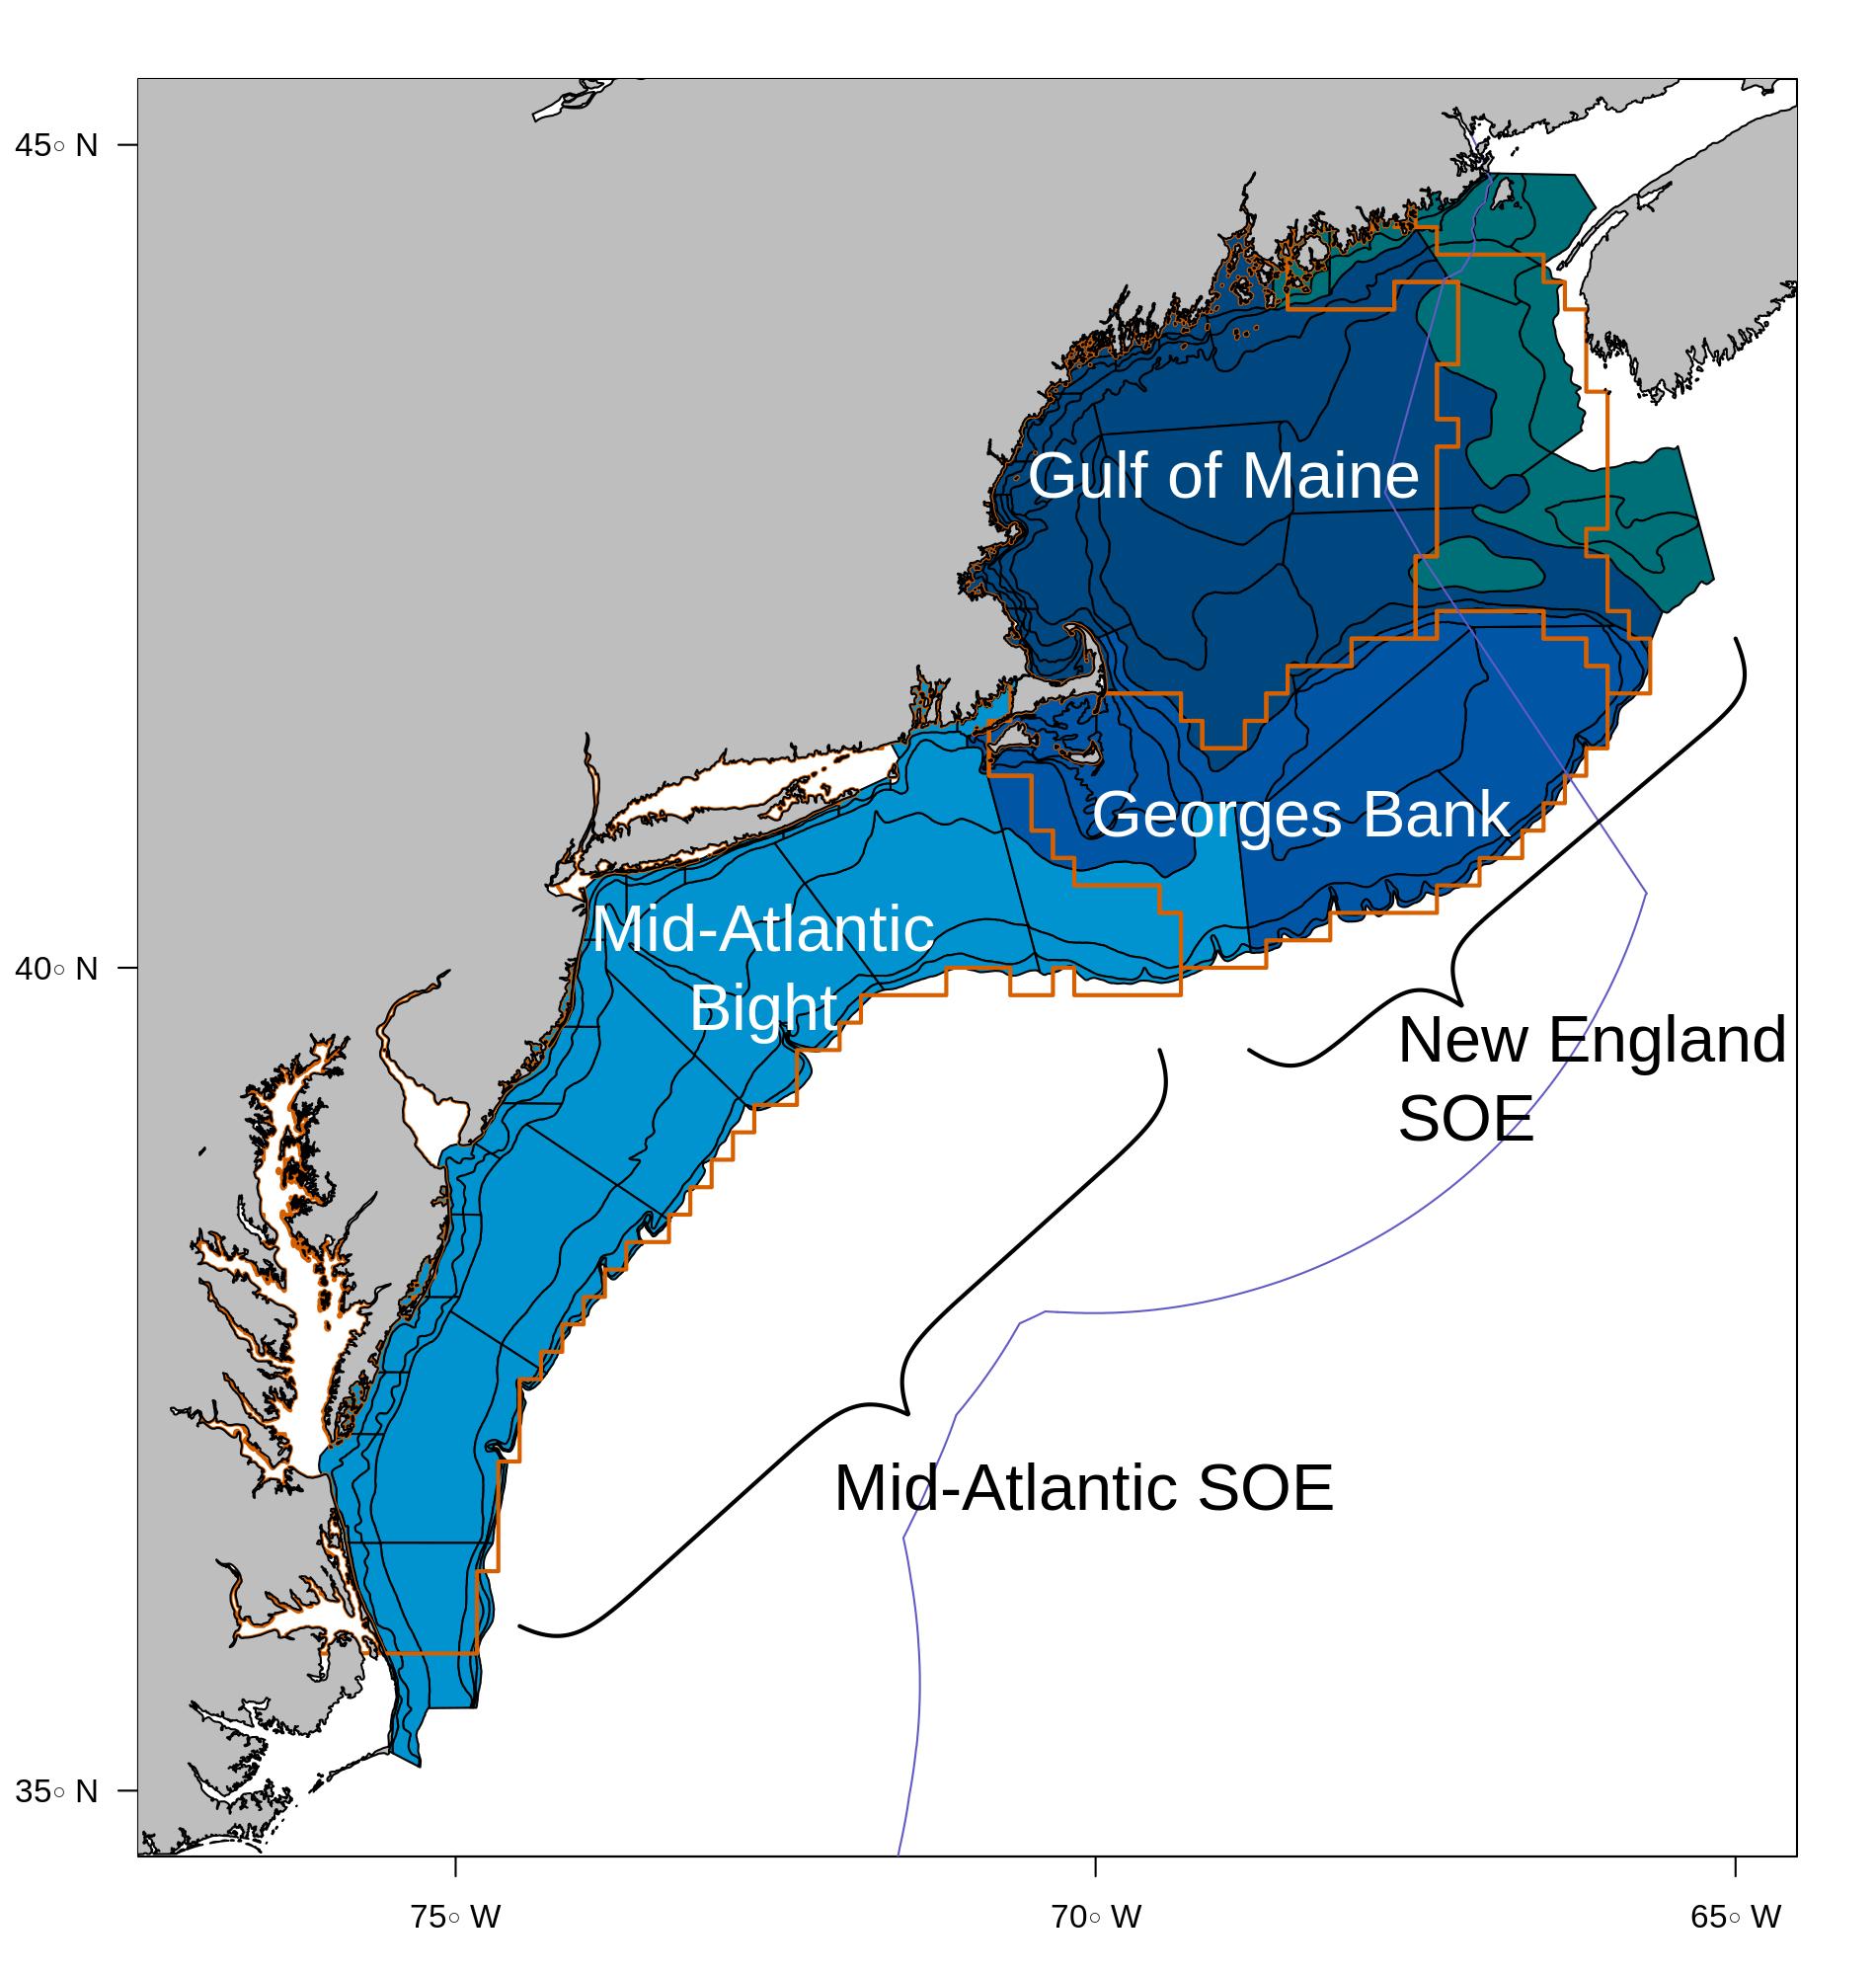 .contrib[ This year, we mapped trawl survey strata to Ecological Production Units (EPUs) [More information on EPUs](https://noaa-edab.github.io/tech-doc/epu.html) [More information on survey data](https://noaa-edab.github.io/tech-doc/survdat.html) ] ] .pull-right[ Key to figures 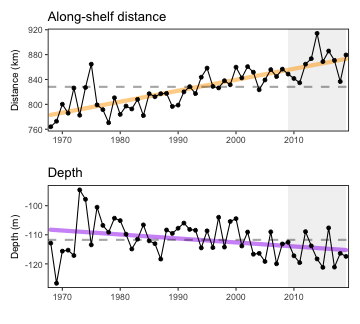 .contrib[ Trends assessed only for 30+ years: [more information](https://noaa-edab.github.io/tech-doc/trend-analysis.html) <p style="color:#FF8C00;">Orange line = significant increase</p> <p style="color:#9932CC;">Purple line = significant decrease</p> No color line = not significant or too short <p style="background-color:#D3D3D3;">Grey background = last 10 years</p> ] ] --- ## SOE Take Home Messages (Mid-Atlantic) * The fraction of ecosystem energy removed by fisheries is declining (commercial landings declined while primary production remained steady) -- * Commercial fishing engagement has declined for medium-highly engaged communities, possibly linked to continued declines in revenue -- * Recreational retained catch was lowest observed in 2018, and effort has been declining along with fleet effort diversity -- * Recreational catch diversity has been maintained by SAFMC/ASMFC species -- * Habitat models identified species most likely to occur in wind lease areas; habitat has improved in wind lease areas for these MAFMC species -- * While aggregate fish biomass is stable over time, shifts to the northeast and into deeper water continue -- * Forage fish energy content varies by season and year; herring energy content may be half what it was in the 1980s-90s -- * Heavy rains put unprecedented fresh water and nutrients into Chesapeake Bay in 2018-2019 -- * Gulf stream instability produces more warm core rings with higher likelihood of warm salty water and associated species on the shelf -- * Marine surface water heatwaves are increasing in duration and intensity, bottom temperatures and the cold pool are warming -- * Warmer waters increase nutrient recycling and summer primary production --- ## SOE Take Home Messages (New England) * Primary production required to support commercial fisheries has declined since 2000 -- * Commercial fishing engagement has increased in some communities, and New England commercial fisheries catch and revenue remain dependent on single species (lobster and scallops) -- * Commercial catch and revenue increased in 2018 (due to lobster and scallops) -- * Habitat models identified species most likely to occur in wind lease areas; habitat has improved in wind lease areas for NEFMC species except for Atlantic herring -- * While aggregate fish biomass is mainly stable over time (aside from high haddock), shifts to the northeast and into deeper water continue -- * Forage fish energy content varies by season and year; herring energy content may be half what it was in the 1980s-90s -- * Gulf stream instability produces more warm core rings with higher likelihood of warm salty water and associated species on the shelf -- * Almost no cold Labrador slope water has entered the Gulf of Maine for the last 3 years --- ## SOE Take Home Messages (New England, continued) * The Gulf of Maine has changed over the past decade * Marine surface water heatwaves are increasing in duration and intensity, bottom temperatures and surface water is warming * Small zooplankton are more abundant than large fatty zooplankton favored by right whales * Spring blooms below average since 2013 -- * Georges Bank has also experienced warming and heat waves over the past decade * Surrounded by warm core rings in summer 2019 * Small zooplankton also dominant here * Average phytoplankton biomass in 2019 --- ## External Resources * [SOE Technical Documentation](https://noaa-edab.github.io/tech-doc) * [ecodata R package](https://github.com/noaa-edab/ecodata) * [Macrofauna indicators](http://noaa-edab.github.io/ecodata/macrofauna) * [Human Dimensions indicators](http://noaa-edab.github.io/ecodata/human_dimensions) * [Lower trophic level indicators](http://noaa-edab.github.io/ecodata/LTL) * [ERDDAP server](https://comet.nefsc.noaa.gov/erddap/index.html) * [NOAA SOE feature story, 7 April 2020](https://www.fisheries.noaa.gov/feature-story/new-state-ecosystem-reports-document-big-picture-around-fishing) * [NOAA SOE summary webpage](https://www.fisheries.noaa.gov/new-england-mid-atlantic/ecosystems/state-ecosystem-reports-northeast-us-shelf) * Slides available at https://noaa-edab.github.io/presentations/ Scroll down to WGNARS 2020 Contacts: <sarah.gaichas@noaa.gov>, <sean.lucey@noaa.gov>, <scott.large@noaa.gov> --- ## Contributors - THANK YOU! The New England and Mid-Atlantic SOEs made possible by (at least) 38 contributors from 8 intstitutions .pull-left[ .contrib[ Donald Anderson (Woods Hole Oceanographic Institute) <br> Andy Beet<br> Patricia Clay<br> Lisa Colburn<br> Geret DePiper<br> Michael Fogarty<br> Paula Fratantoni <br> Kevin Friedland<br> Sarah Gaichas<br> Avijit Gangopadhyay (School for Marine Science and Technology, University of Massachusetts Dartmouth)<br> James Gartland (Virginia Institute of Marine Science)<br> Glen Gawarkiewicz (Woods Hole Oceanographic Institution)<br> Sean Hardison<br> Kimberly Hyde<br> Terry Joyce (Woods Hole Oceanographic Institute)<br> John Kocik<br> Steve Kress (National Audubon Society)<br> Scott Large ] ] .pull-right[ .contrib[ Don Lyons (National Audubon Society)<br> Ruth Boettcher (Virginia Department of Game and Inland Fisheries)<br> Young-Oh Kwon (Woods Hole Oceanographic Institution)<br> Zhuomin Chen (Woods Hole Oceanographic Institution)<br> Sean Lucey<br> Chris Melrose<br> Ryan Morse<br> Kimberly Murray<br> Chris Orphanides<br> Richard Pace<br> Charles Perretti<br> Vincent Saba<br> Laurel Smith<br> Mark Terceiro<br> John Walden<br> Harvey Walsh<br> Mark Wuenschel ] ] .center[  ] --- background-image: url("EDAB_images/SOE_feature_image.png") background-size: contain .footnote[Questions? Thank you!] --- # Appendix ## Example: full results shown to the Mid-Atlantic Council, 7 April 2020 --- ## Commercial fisheries and ecosystem productivity *Primary Production Required to support landings* .pull-left[ 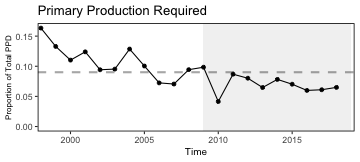 ## Fraction of primary production used by fisheries ## Declining since 2000 Combined decrease in landings and stable primary production Many assumptions to explore ] .pull-right[ 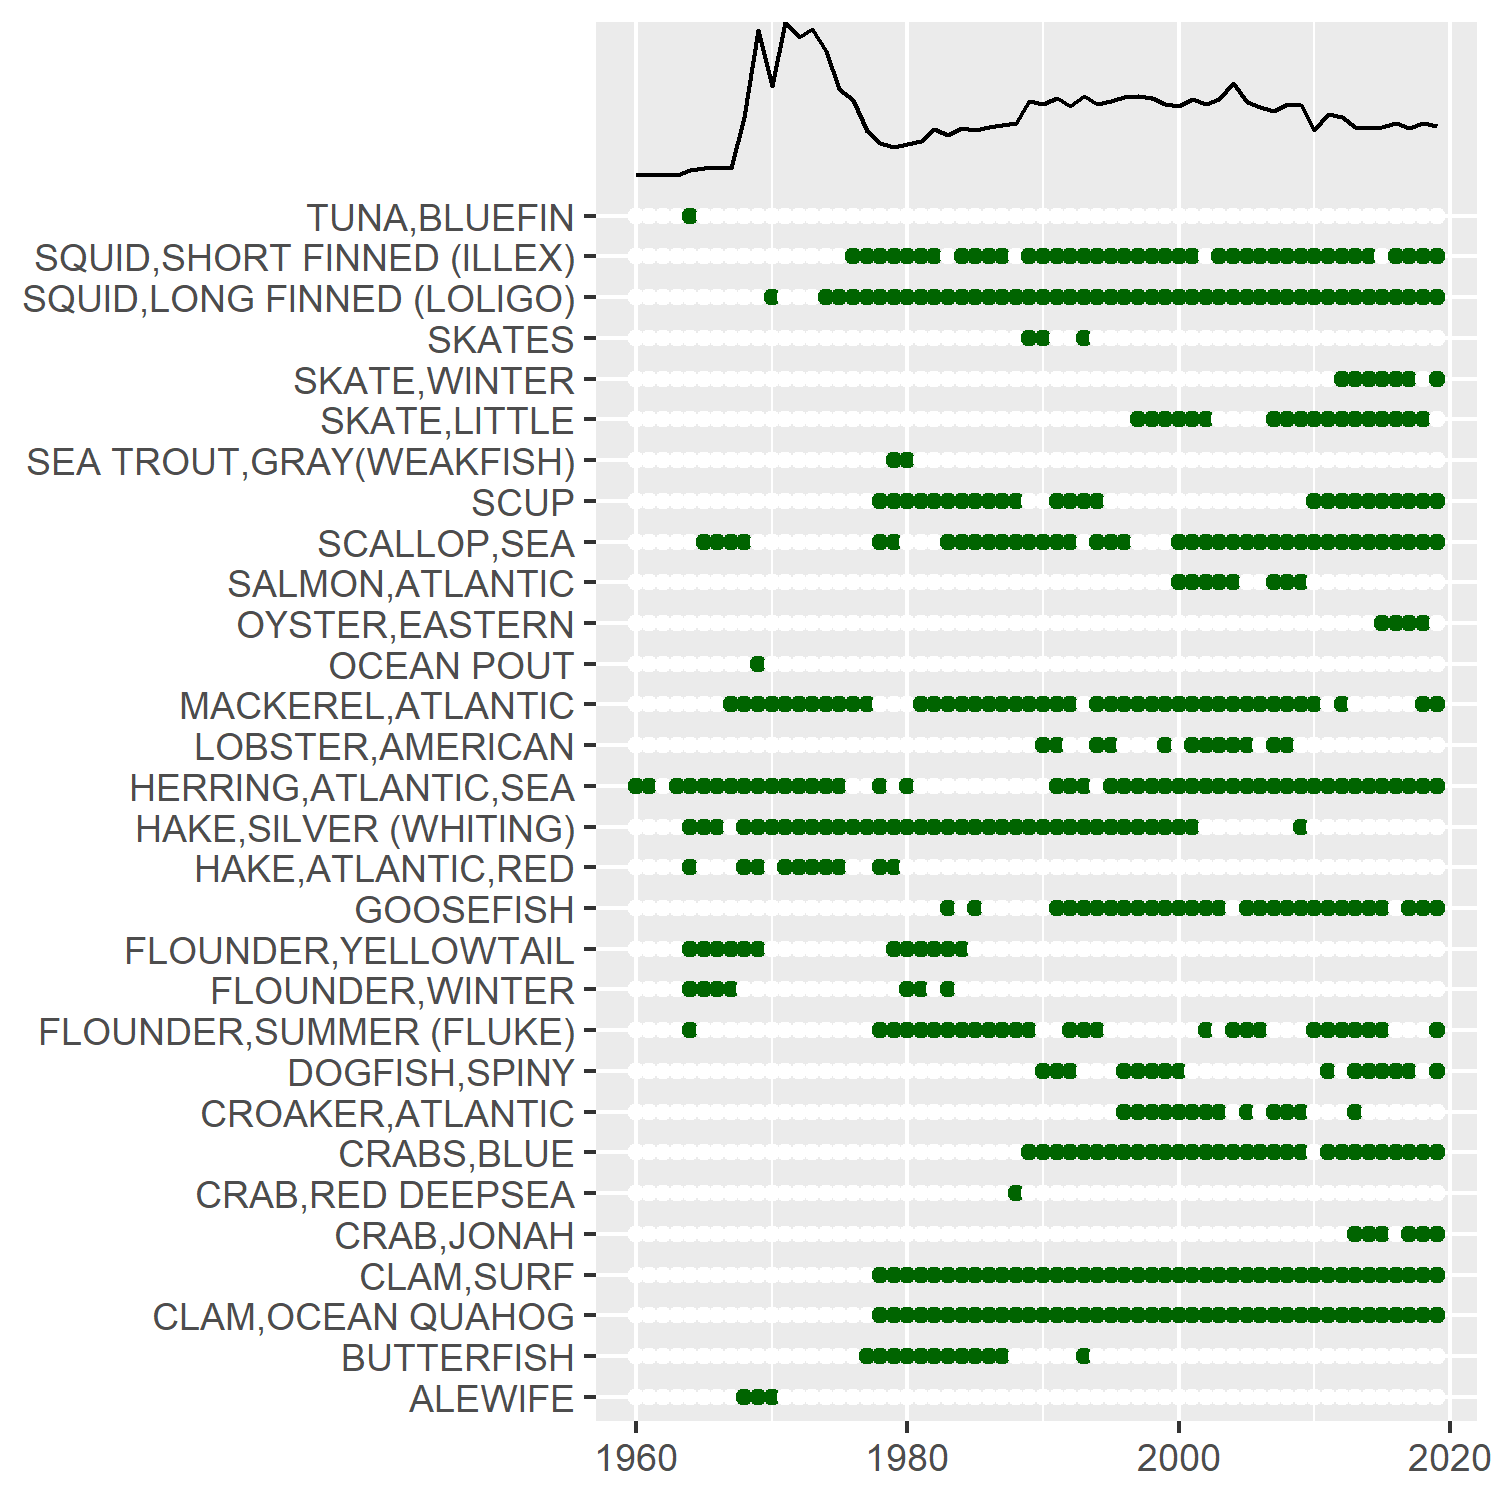 ] --- ## Commercial fisheries engagement, landings, revenue .center[ 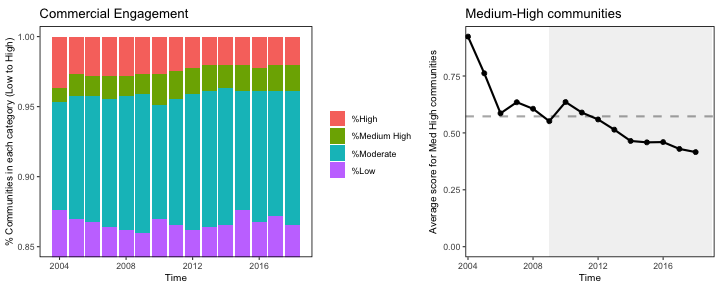 ] Fewer highly engaged Mid-Atlantic communities; engagement scores for medium-highly engaged communities decreasing, linked to landings/revenue? .pull-left[ 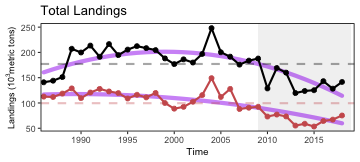 ] .pull-right[ 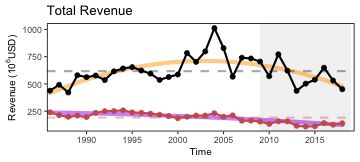 ] --- ## Recreational fishing .pull-left[ Lowest recreational landings recorded in 2018--why? 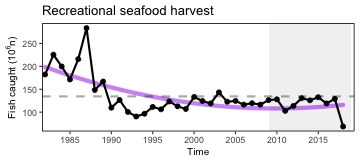 Effort trend similar to previous reports 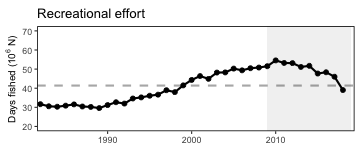 ] .pull-right[ Significant decrease in recreational fleet diversity 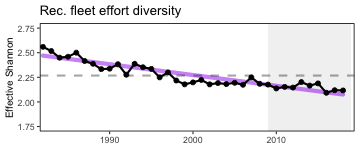 Splitting out SAFMC, ASMFC removed downward catch diversity trend 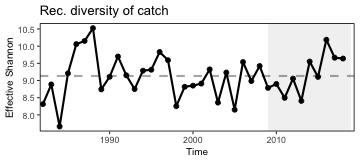 ] --- ## Other ocean uses: wind energy fish habitat overlap <table class="risktable table" style="font-size: 11px; margin-left: auto; margin-right: auto;"> <thead> <tr> <th style="border-bottom:hidden" colspan="1"></th> <th style="border-bottom:hidden; padding-bottom:0; padding-left:3px;padding-right:3px;text-align: center; " colspan="2"><div style="border-bottom: 1px solid #ddd; padding-bottom: 5px; ">Existing - North</div></th> <th style="border-bottom:hidden; padding-bottom:0; padding-left:3px;padding-right:3px;text-align: center; " colspan="2"><div style="border-bottom: 1px solid #ddd; padding-bottom: 5px; ">Proposed - North</div></th> <th style="border-bottom:hidden; padding-bottom:0; padding-left:3px;padding-right:3px;text-align: center; " colspan="2"><div style="border-bottom: 1px solid #ddd; padding-bottom: 5px; ">Existing - Mid</div></th> <th style="border-bottom:hidden; padding-bottom:0; padding-left:3px;padding-right:3px;text-align: center; " colspan="2"><div style="border-bottom: 1px solid #ddd; padding-bottom: 5px; ">Proposed - Mid</div></th> <th style="border-bottom:hidden; padding-bottom:0; padding-left:3px;padding-right:3px;text-align: center; " colspan="2"><div style="border-bottom: 1px solid #ddd; padding-bottom: 5px; ">Existing - South</div></th> </tr> <tr> <th style="text-align:left;font-weight: bold;"> Season </th> <th style="text-align:left;font-weight: bold;"> Species </th> <th style="text-align:left;font-weight: bold;"> Trend </th> <th style="text-align:left;font-weight: bold;"> Species </th> <th style="text-align:left;font-weight: bold;"> Trend </th> <th style="text-align:left;font-weight: bold;"> Species </th> <th style="text-align:left;font-weight: bold;"> Trend </th> <th style="text-align:left;font-weight: bold;"> Species </th> <th style="text-align:left;font-weight: bold;"> Trend </th> <th style="text-align:left;font-weight: bold;"> Species </th> <th style="text-align:left;font-weight: bold;"> Trend </th> </tr> </thead> <tbody> <tr> <td style="text-align:left;"> Spring </td> <td style="text-align:left;"> Little Skate </td> <td style="text-align:left;"> `\(\nearrow\)` </td> <td style="text-align:left;"> Atlantic Herring </td> <td style="text-align:left;"> </td> <td style="text-align:left;"> Little Skate </td> <td style="text-align:left;"> `\(\nearrow\)` </td> <td style="text-align:left;"> Spiny Dogfish </td> <td style="text-align:left;"> `\(\nearrow\)` </td> <td style="text-align:left;"> Spiny Dogfish </td> <td style="text-align:left;"> `\(\nearrow\)` </td> </tr> <tr> <td style="text-align:left;"> Spring </td> <td style="text-align:left;"> Atlantic Herring </td> <td style="text-align:left;"> `\(\searrow\)` </td> <td style="text-align:left;"> Little Skate </td> <td style="text-align:left;"> `\(\nearrow\)` </td> <td style="text-align:left;"> Atlantic Herring </td> <td style="text-align:left;"> `\(\searrow\)` </td> <td style="text-align:left;"> Atlantic Herring </td> <td style="text-align:left;"> `\(\searrow\)` </td> <td style="text-align:left;"> Longfin Squid </td> <td style="text-align:left;"> `\(\nearrow\)` </td> </tr> <tr> <td style="text-align:left;"> Spring </td> <td style="text-align:left;"> Windowpane </td> <td style="text-align:left;"> `\(\nearrow\)` </td> <td style="text-align:left;"> Longhorn Sculpin </td> <td style="text-align:left;"> `\(\nearrow\)` </td> <td style="text-align:left;"> Spiny Dogfish </td> <td style="text-align:left;"> `\(\nearrow\)` </td> <td style="text-align:left;"> Little Skate </td> <td style="text-align:left;"> `\(\nearrow\)` </td> <td style="text-align:left;"> Summer Flounder </td> <td style="text-align:left;"> `\(\nearrow\)` </td> </tr> <tr> <td style="text-align:left;"> Spring </td> <td style="text-align:left;"> Winter Skate </td> <td style="text-align:left;"> `\(\nearrow\)` </td> <td style="text-align:left;"> Windowpane </td> <td style="text-align:left;"> `\(\nearrow\)` </td> <td style="text-align:left;"> Windowpane </td> <td style="text-align:left;"> `\(\nearrow\)` </td> <td style="text-align:left;"> Alewife </td> <td style="text-align:left;"> `\(\searrow\)` </td> <td style="text-align:left;"> Clearnose Skate </td> <td style="text-align:left;"> `\(\nearrow\)` </td> </tr> <tr> <td style="text-align:left;"> Spring </td> <td style="text-align:left;"> Longhorn Sculpin </td> <td style="text-align:left;"> `\(\nearrow\)` </td> <td style="text-align:left;"> Alewife </td> <td style="text-align:left;"> `\(\searrow\)` </td> <td style="text-align:left;"> Winter Skate </td> <td style="text-align:left;"> `\(\nearrow\)` </td> <td style="text-align:left;"> Silver Hake </td> <td style="text-align:left;"> `\(\nearrow\)` </td> <td style="text-align:left;"> Spotted Hake </td> <td style="text-align:left;"> `\(\nearrow\)` </td> </tr> <tr> <td style="text-align:left;"> Fall </td> <td style="text-align:left;"> Butterfish </td> <td style="text-align:left;"> `\(\nearrow\)` </td> <td style="text-align:left;"> Butterfish </td> <td style="text-align:left;"> `\(\nearrow\)` </td> <td style="text-align:left;"> Summer Flounder </td> <td style="text-align:left;"> `\(\nearrow\)` </td> <td style="text-align:left;"> Longhorn Sculpin </td> <td style="text-align:left;"> `\(\nearrow\)` </td> <td style="text-align:left;"> Longfin Squid </td> <td style="text-align:left;"> `\(\searrow\)` </td> </tr> <tr> <td style="text-align:left;"> Fall </td> <td style="text-align:left;"> Longfin Squid </td> <td style="text-align:left;"> `\(\nearrow\)` </td> <td style="text-align:left;"> Fourspot Flounder </td> <td style="text-align:left;"> </td> <td style="text-align:left;"> Longfin Squid </td> <td style="text-align:left;"> `\(\nearrow\)` </td> <td style="text-align:left;"> Little Skate </td> <td style="text-align:left;"> `\(\nearrow\)` </td> <td style="text-align:left;"> Northern Searobin </td> <td style="text-align:left;"> `\(\nearrow\)` </td> </tr> <tr> <td style="text-align:left;"> Fall </td> <td style="text-align:left;"> Summer Flounder </td> <td style="text-align:left;"> `\(\nearrow\)` </td> <td style="text-align:left;"> Longhorn Sculpin </td> <td style="text-align:left;"> `\(\searrow\)` </td> <td style="text-align:left;"> Butterfish </td> <td style="text-align:left;"> `\(\nearrow\)` </td> <td style="text-align:left;"> Butterfish </td> <td style="text-align:left;"> `\(\nearrow\)` </td> <td style="text-align:left;"> Clearnose Skate </td> <td style="text-align:left;"> `\(\nearrow\)` </td> </tr> <tr> <td style="text-align:left;"> Fall </td> <td style="text-align:left;"> Winter Flounder </td> <td style="text-align:left;"> `\(\searrow\)` </td> <td style="text-align:left;"> Summer Flounder </td> <td style="text-align:left;"> `\(\nearrow\)` </td> <td style="text-align:left;"> Smooth Dogfish </td> <td style="text-align:left;"> `\(\nearrow\)` </td> <td style="text-align:left;"> Sea Scallop </td> <td style="text-align:left;"> `\(\nearrow\)` </td> <td style="text-align:left;"> Butterfish </td> <td style="text-align:left;"> `\(\nearrow\)` </td> </tr> <tr> <td style="text-align:left;"> Fall </td> <td style="text-align:left;"> Spiny Dogfish </td> <td style="text-align:left;"> `\(\searrow\)` </td> <td style="text-align:left;"> Spiny Dogfish </td> <td style="text-align:left;"> `\(\searrow\)` </td> <td style="text-align:left;"> Windowpane </td> <td style="text-align:left;"> `\(\nearrow\)` </td> <td style="text-align:left;"> Fourspot Flounder </td> <td style="text-align:left;"> `\(\nearrow\)` </td> <td style="text-align:left;"> Spiny Dogfish/Spotted Hake </td> <td style="text-align:left;"> `\(\nearrow\)` </td> </tr> </tbody> </table> .pull-left[ 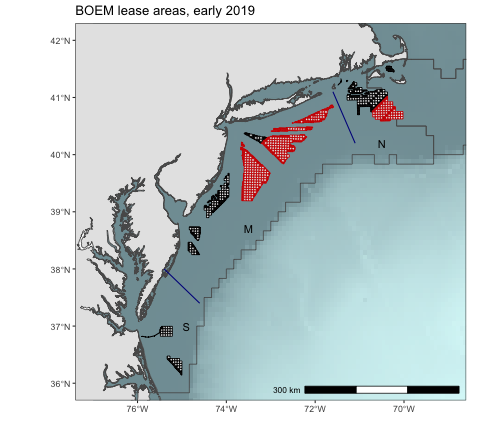 ] .pull-right[ ## Fishery overlap to be added ## What habitat model outputs most useful? ] --- ## Protected species .pull-left[ North Atlantic right whale abundance 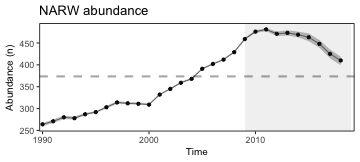 **New indicator** North Atlantic right whale calf births 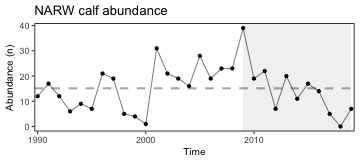 ] .pull-right[ Seal population snapshots + ~75,000 harbor seals, trend analysis in progress + 30,000 - 40,000 grey seals in US; 425,000 in Canada and ↗ Seal diet studies in progress Unusual Mortality Events + [North Atlantic right whales](https://www.fisheries.noaa.gov/national/marine-life-distress/2017-2020-north-atlantic-right-whale-unusual-mortality-event) + [Humpback whales](https://www.fisheries.noaa.gov/national/marine-life-distress/2016-2020-humpback-whale-unusual-mortality-event-along-atlantic-coast) + [Minke whales](https://www.fisheries.noaa.gov/national/marine-life-distress/2017-2020-minke-whale-unusual-mortality-event-along-atlantic-coast) + [Grey, harbor, hooded, and harp seals](https://www.fisheries.noaa.gov/new-england-mid-atlantic/marine-life-distress/2018-2019-pinniped-unusual-mortality-event-along) ] --- ## Fish stock status Change from 2019: bluefish biomass below threshold 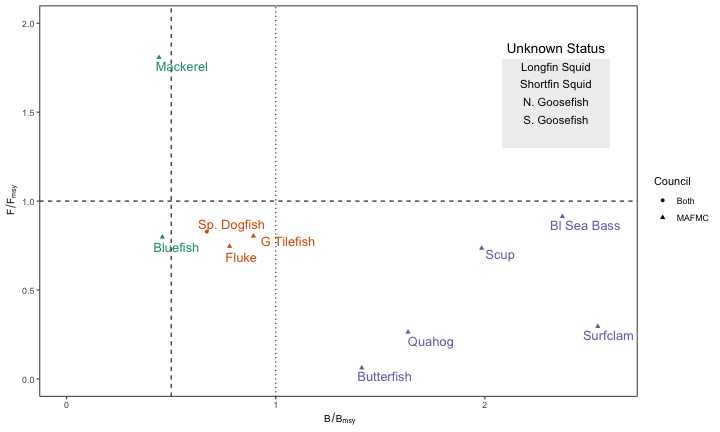 --- ## Updated fish feeding groups to look at aggregate biomass <table class="table" style="font-size: 12px; margin-left: auto; margin-right: auto;"> <caption style="font-size: initial !important;">Feeding groups and management bodies.</caption> <thead> <tr> <th style="text-align:left;font-weight: bold;"> Feeding Group </th> <th style="text-align:left;font-weight: bold;"> MAFMC </th> <th style="text-align:left;font-weight: bold;"> Joint </th> <th style="text-align:left;font-weight: bold;"> NEFMC </th> <th style="text-align:left;font-weight: bold;"> State or Other </th> </tr> </thead> <tbody> <tr> <td style="text-align:left;width: 2cm; "> Apex Predator </td> <td style="text-align:left;width: 4cm; "> NA </td> <td style="text-align:left;width: 2cm; "> NA </td> <td style="text-align:left;width: 5cm; "> NA </td> <td style="text-align:left;width: 6cm; "> bluefin tuna, shark uncl, swordfish, yellowfin tuna </td> </tr> <tr> <td style="text-align:left;width: 2cm; "> Piscivore </td> <td style="text-align:left;width: 4cm; "> bluefish, longfin squid, northern shortfin squid, summer flounder </td> <td style="text-align:left;width: 2cm; "> goosefish, spiny dogfish </td> <td style="text-align:left;width: 5cm; "> acadian redfish, atlantic cod, atlantic halibut, clearnose skate, little skate, offshore hake, pollock, red hake, silver hake, smooth skate, thorny skate, white hake, winter skate </td> <td style="text-align:left;width: 6cm; "> fourspot flounder, john dory, sea raven, striped bass, weakfish, windowpane </td> </tr> <tr> <td style="text-align:left;width: 2cm; "> Planktivore </td> <td style="text-align:left;width: 4cm; "> atlantic mackerel, butterfish </td> <td style="text-align:left;width: 2cm; "> NA </td> <td style="text-align:left;width: 5cm; "> atlantic herring </td> <td style="text-align:left;width: 6cm; "> alewife, american shad, blackbelly rosefish, blueback herring, cusk, longhorn sculpin, lumpfish, menhaden, northern sand lance, northern searobin, sculpin uncl </td> </tr> <tr> <td style="text-align:left;width: 2cm; "> Benthivore </td> <td style="text-align:left;width: 4cm; "> black sea bass, scup, tilefish </td> <td style="text-align:left;width: 2cm; "> NA </td> <td style="text-align:left;width: 5cm; "> american plaice, barndoor skate, crab,red deepsea, haddock, ocean pout, rosette skate, winter flounder, witch flounder, yellowtail flounder </td> <td style="text-align:left;width: 6cm; "> american lobster, atlantic wolffish, blue crab, cancer crab uncl, chain dogfish, cunner, jonah crab, lady crab, smooth dogfish, spider crab uncl, squid cuttlefish and octopod uncl, striped searobin, tautog </td> </tr> <tr> <td style="text-align:left;width: 2cm; "> Benthos </td> <td style="text-align:left;width: 4cm; "> atlantic surfclam, ocean quahog </td> <td style="text-align:left;width: 2cm; "> NA </td> <td style="text-align:left;width: 5cm; "> sea scallop </td> <td style="text-align:left;width: 6cm; "> blue mussel, channeled whelk, sea cucumber, sea urchin and sand dollar uncl, sea urchins, snails(conchs) </td> </tr> </tbody> </table> --- ## Aggregate fish biomass generally stable 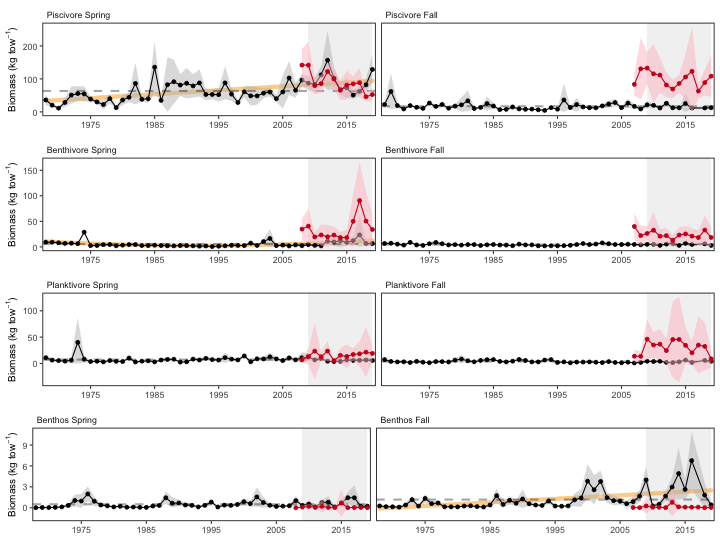 --- ## Aggregate fish distribution and southern species .pull-left[ Overall fish biomass tracking northeast and deeper 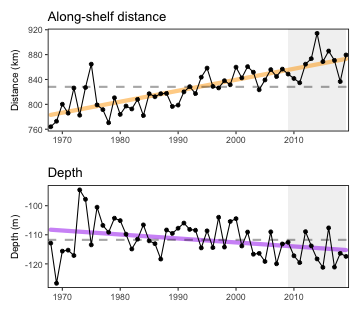 ] .pull-right[ Southern species not increasing in surveys, but further north? 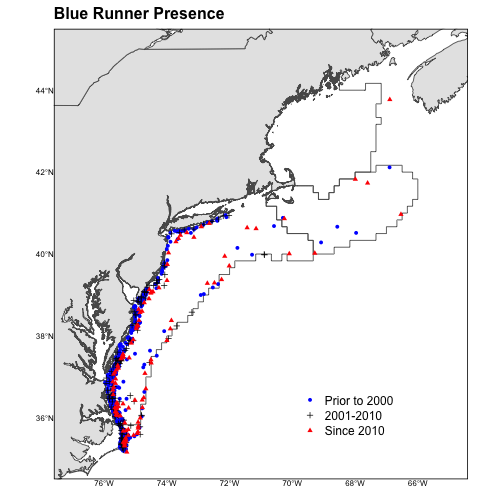 ] --- ## Fish condition and productivity .pull-left-30[ Female fish "fatness" from fall surveys in the MAB Small fish per large fish biomass anomaly, MAB ] .pull-right-70[ 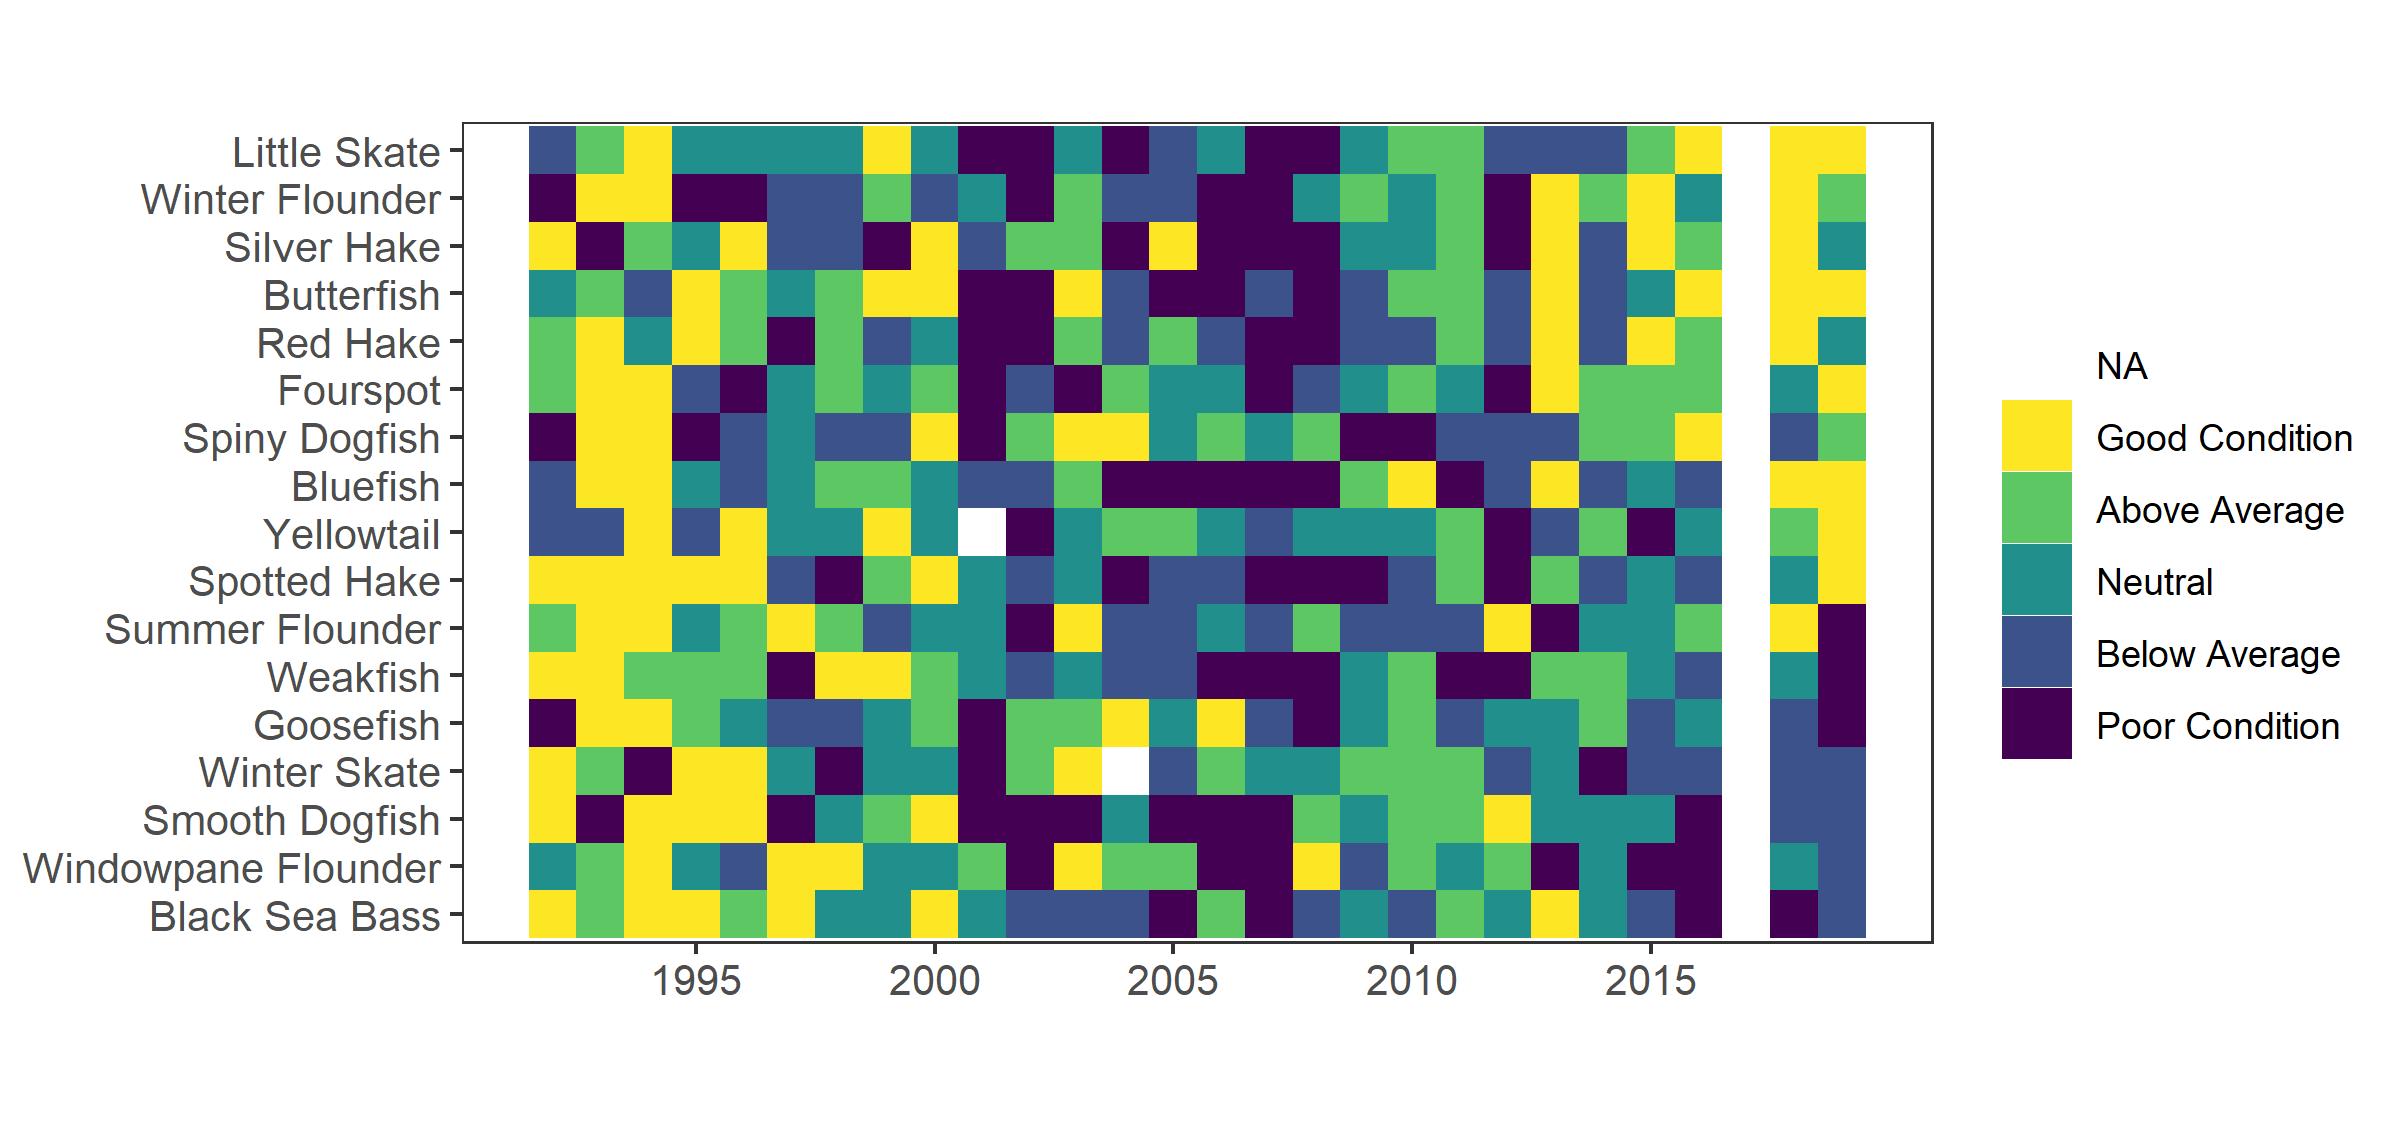 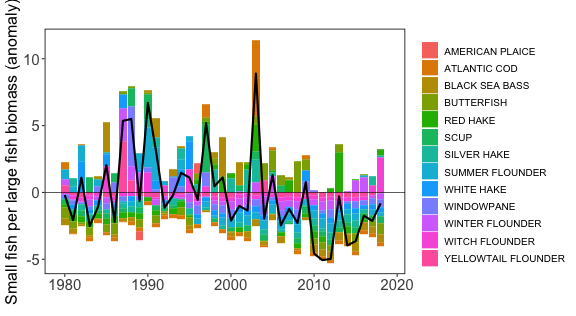 ] --- ## New information on forage fish energy density Forage fish energy content varies seasonally and annually Atlantic herring energy content may be half what it was in the 1980s-90s <table class="table" style="font-size: 11px; margin-left: auto; margin-right: auto;"> <thead> <tr> <th style="border-bottom:hidden" colspan="1"></th> <th style="border-bottom:hidden; padding-bottom:0; padding-left:3px;padding-right:3px;text-align: center; " colspan="2"><div style="border-bottom: 1px solid #ddd; padding-bottom: 5px; ">Spring 2017</div></th> <th style="border-bottom:hidden; padding-bottom:0; padding-left:3px;padding-right:3px;text-align: center; " colspan="2"><div style="border-bottom: 1px solid #ddd; padding-bottom: 5px; ">Fall 2017</div></th> <th style="border-bottom:hidden; padding-bottom:0; padding-left:3px;padding-right:3px;text-align: center; " colspan="2"><div style="border-bottom: 1px solid #ddd; padding-bottom: 5px; ">Spring 2018</div></th> <th style="border-bottom:hidden; padding-bottom:0; padding-left:3px;padding-right:3px;text-align: center; " colspan="2"><div style="border-bottom: 1px solid #ddd; padding-bottom: 5px; ">Fall 2018</div></th> <th style="border-bottom:hidden; padding-bottom:0; padding-left:3px;padding-right:3px;text-align: center; " colspan="2"><div style="border-bottom: 1px solid #ddd; padding-bottom: 5px; ">Total</div></th> <th style="border-bottom:hidden; padding-bottom:0; padding-left:3px;padding-right:3px;text-align: center; " colspan="1"><div style="border-bottom: 1px solid #ddd; padding-bottom: 5px; ">1980s</div></th> <th style="border-bottom:hidden; padding-bottom:0; padding-left:3px;padding-right:3px;text-align: center; " colspan="1"><div style="border-bottom: 1px solid #ddd; padding-bottom: 5px; ">1990s</div></th> </tr> <tr> <th style="text-align:left;font-weight: bold;"> Species </th> <th style="text-align:left;font-weight: bold;"> ED (SD) </th> <th style="text-align:right;font-weight: bold;"> N </th> <th style="text-align:left;font-weight: bold;"> ED (SD) </th> <th style="text-align:right;font-weight: bold;"> N </th> <th style="text-align:left;font-weight: bold;"> ED (SD) </th> <th style="text-align:right;font-weight: bold;"> N </th> <th style="text-align:left;font-weight: bold;"> ED (SD) </th> <th style="text-align:right;font-weight: bold;"> N </th> <th style="text-align:left;font-weight: bold;"> ED (SD) </th> <th style="text-align:right;font-weight: bold;"> N </th> <th style="text-align:right;font-weight: bold;"> ED </th> <th style="text-align:left;font-weight: bold;"> ED (SD) </th> </tr> </thead> <tbody> <tr> <td style="text-align:left;"> Alewife </td> <td style="text-align:left;"> 6.84 (1.62) </td> <td style="text-align:right;"> 128 </td> <td style="text-align:left;"> 8.12 (1.46) </td> <td style="text-align:right;"> 50 </td> <td style="text-align:left;"> 6.45 (1.21) </td> <td style="text-align:right;"> 47 </td> <td style="text-align:left;"> 7.41 (1.6) </td> <td style="text-align:right;"> 42 </td> <td style="text-align:left;"> 7.1 (1.62) </td> <td style="text-align:right;"> 267 </td> <td style="text-align:right;"> 6.4 </td> <td style="text-align:left;"> </td> </tr> <tr> <td style="text-align:left;"> Atl. Herring </td> <td style="text-align:left;"> 5.34 (0.94) </td> <td style="text-align:right;"> 122 </td> <td style="text-align:left;"> 5.77 (1.31) </td> <td style="text-align:right;"> 52 </td> <td style="text-align:left;"> 6.69 (0.85) </td> <td style="text-align:right;"> 51 </td> <td style="text-align:left;"> 5.41 (1.34) </td> <td style="text-align:right;"> 50 </td> <td style="text-align:left;"> 5.69 (1.19) </td> <td style="text-align:right;"> 275 </td> <td style="text-align:right;"> 10.6 </td> <td style="text-align:left;"> 9.4 (1.4) </td> </tr> <tr> <td style="text-align:left;"> Atl. Mackerel </td> <td style="text-align:left;"> </td> <td style="text-align:right;"> NA </td> <td style="text-align:left;"> 7.24 (1.13) </td> <td style="text-align:right;"> 50 </td> <td style="text-align:left;"> 5.33 (0.86) </td> <td style="text-align:right;"> 51 </td> <td style="text-align:left;"> 6.89 (1.07) </td> <td style="text-align:right;"> 50 </td> <td style="text-align:left;"> 6.48 (1.32) </td> <td style="text-align:right;"> 151 </td> <td style="text-align:right;"> 6.0 </td> <td style="text-align:left;"> </td> </tr> <tr> <td style="text-align:left;"> Butterfish </td> <td style="text-align:left;"> 7.13 (1.59) </td> <td style="text-align:right;"> 65 </td> <td style="text-align:left;"> 7.31 (1.45) </td> <td style="text-align:right;"> 89 </td> <td style="text-align:left;"> 4.91 (1.12) </td> <td style="text-align:right;"> 53 </td> <td style="text-align:left;"> 8.1 (2.7) </td> <td style="text-align:right;"> 50 </td> <td style="text-align:left;"> 6.92 (2.04) </td> <td style="text-align:right;"> 257 </td> <td style="text-align:right;"> 6.2 </td> <td style="text-align:left;"> </td> </tr> <tr> <td style="text-align:left;"> Illex </td> <td style="text-align:left;"> 5.54 (0.4) </td> <td style="text-align:right;"> 77 </td> <td style="text-align:left;"> 5.43 (0.51) </td> <td style="text-align:right;"> 52 </td> <td style="text-align:left;"> 5.5 (0.52) </td> <td style="text-align:right;"> 50 </td> <td style="text-align:left;"> 4.76 (0.79) </td> <td style="text-align:right;"> 50 </td> <td style="text-align:left;"> 5.33 (0.63) </td> <td style="text-align:right;"> 229 </td> <td style="text-align:right;"> 7.1 </td> <td style="text-align:left;"> 5.9 (0.56) </td> </tr> <tr> <td style="text-align:left;"> Loligo </td> <td style="text-align:left;"> 5.22 (0.36) </td> <td style="text-align:right;"> 83 </td> <td style="text-align:left;"> 5.24 (0.26) </td> <td style="text-align:right;"> 60 </td> <td style="text-align:left;"> 4.84 (0.63) </td> <td style="text-align:right;"> 52 </td> <td style="text-align:left;"> 4.6 (0.72) </td> <td style="text-align:right;"> 50 </td> <td style="text-align:left;"> 5.02 (0.56) </td> <td style="text-align:right;"> 245 </td> <td style="text-align:right;"> 5.6 </td> <td style="text-align:left;"> </td> </tr> <tr> <td style="text-align:left;"> Sand lance </td> <td style="text-align:left;"> 6.66 (0.54) </td> <td style="text-align:right;"> 18 </td> <td style="text-align:left;"> </td> <td style="text-align:right;"> NA </td> <td style="text-align:left;"> 5.78 (0.34) </td> <td style="text-align:right;"> 60 </td> <td style="text-align:left;"> 7.99 (0.74) </td> <td style="text-align:right;"> 8 </td> <td style="text-align:left;"> 6.17 (0.81) </td> <td style="text-align:right;"> 86 </td> <td style="text-align:right;"> 6.8 </td> <td style="text-align:left;"> 4.4 (0.82) </td> </tr> <tr> <td style="text-align:left;"> Silver hake </td> <td style="text-align:left;"> 4.25 (0.39) </td> <td style="text-align:right;"> 189 </td> <td style="text-align:left;"> 4.42 (0.45) </td> <td style="text-align:right;"> 50 </td> <td style="text-align:left;"> 4.19 (0.39) </td> <td style="text-align:right;"> 50 </td> <td style="text-align:left;"> 4.55 (0.63) </td> <td style="text-align:right;"> 50 </td> <td style="text-align:left;"> 4.31 (0.46) </td> <td style="text-align:right;"> 339 </td> <td style="text-align:right;"> 4.6 </td> <td style="text-align:left;"> </td> </tr> </tbody> </table> --- ## Habitat condition: nearshore environments .pull-left[ Chesapeake Bay water quality update 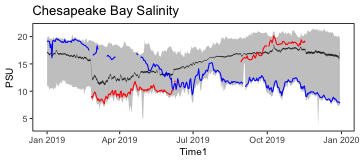 Record high precipitation led to extreme low salinity event in spring 2019 High flows and nutrient loads led to 3rd lowest summer dissolved-oxygen levels recorded in Maryland Bay waters ] .pull-right[ Virginia nesting waterbird populations declining 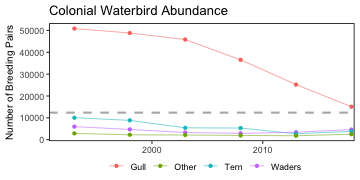 Declines attributed to habitat loss linked to sea level rise ] --- ## Habitat condition: large ocean current changes .pull-left[ More northerly Gulf Stream 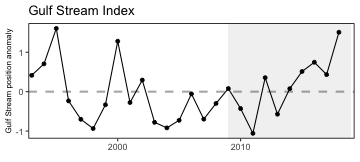 ] .pull-right[ More Gulf Stream warm core rings 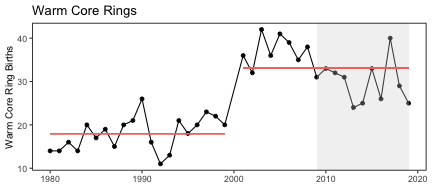 ] .center[ Almost no Labrador slope water entering the Gulf of Maine 2017-2019 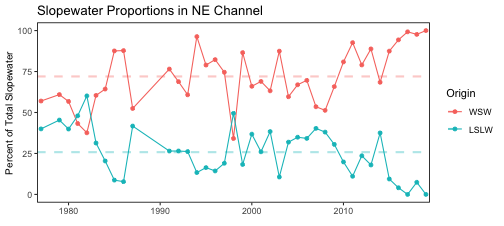 ] ??? MAFMC requested that this indicator be included (in past years it was in the New England report only). --- ## Mid-Atlantic regional habitat conditions .pull-left[ Mid-Atlatic cold pool is warming 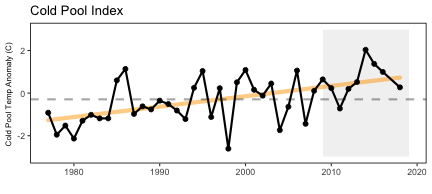 Bottom temperature is increasing 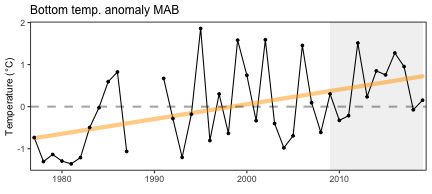 ] .pull-right[ 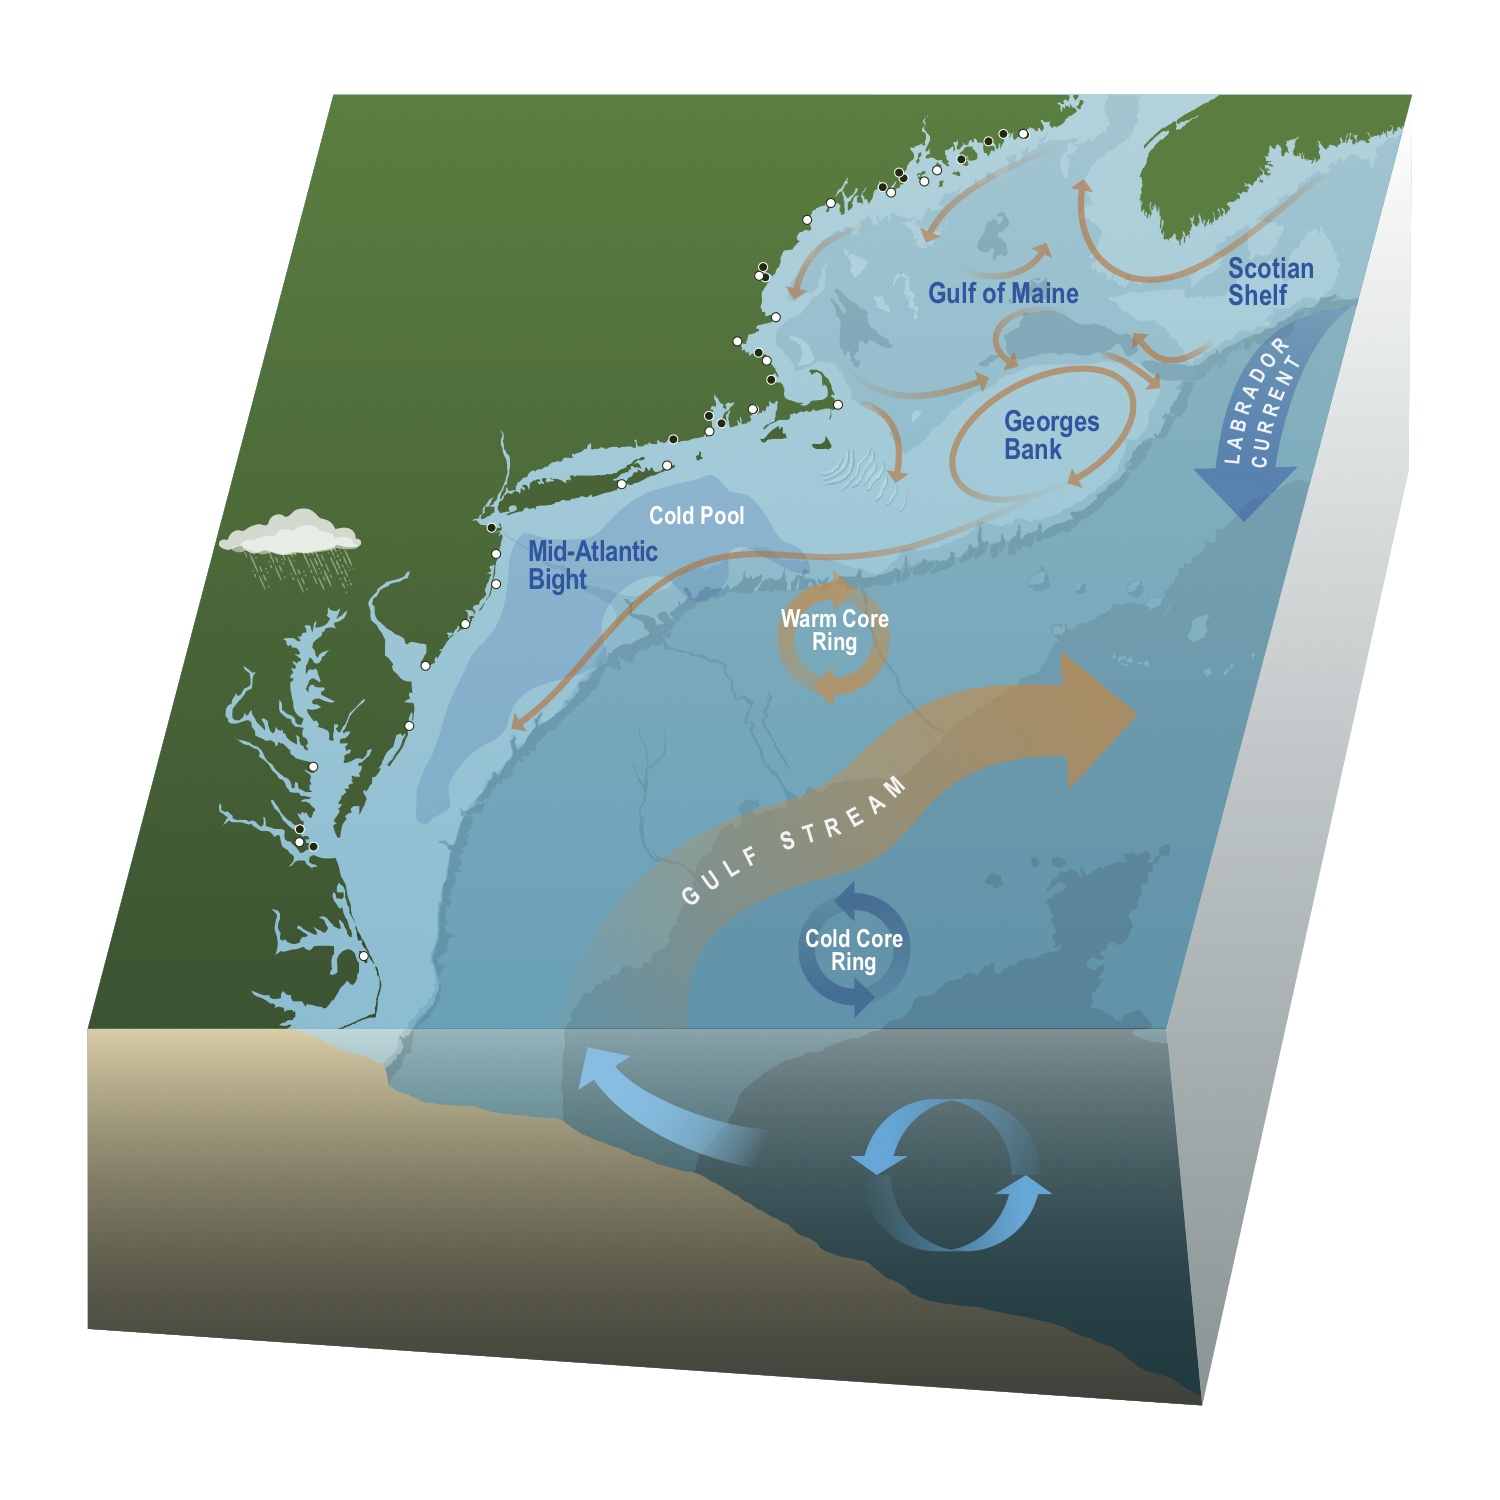 ] --- ## Seasonal temperature and phytoplankton in 2019 .pull-left-60[ Sea surface temperature anomaly and trends 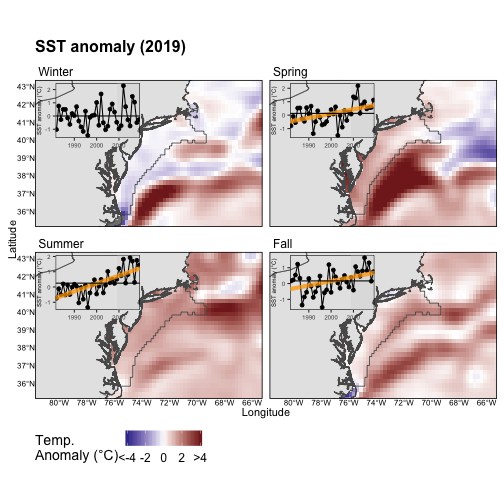 ] .pull-right-40[ Satellite chlorophyll a anomaly 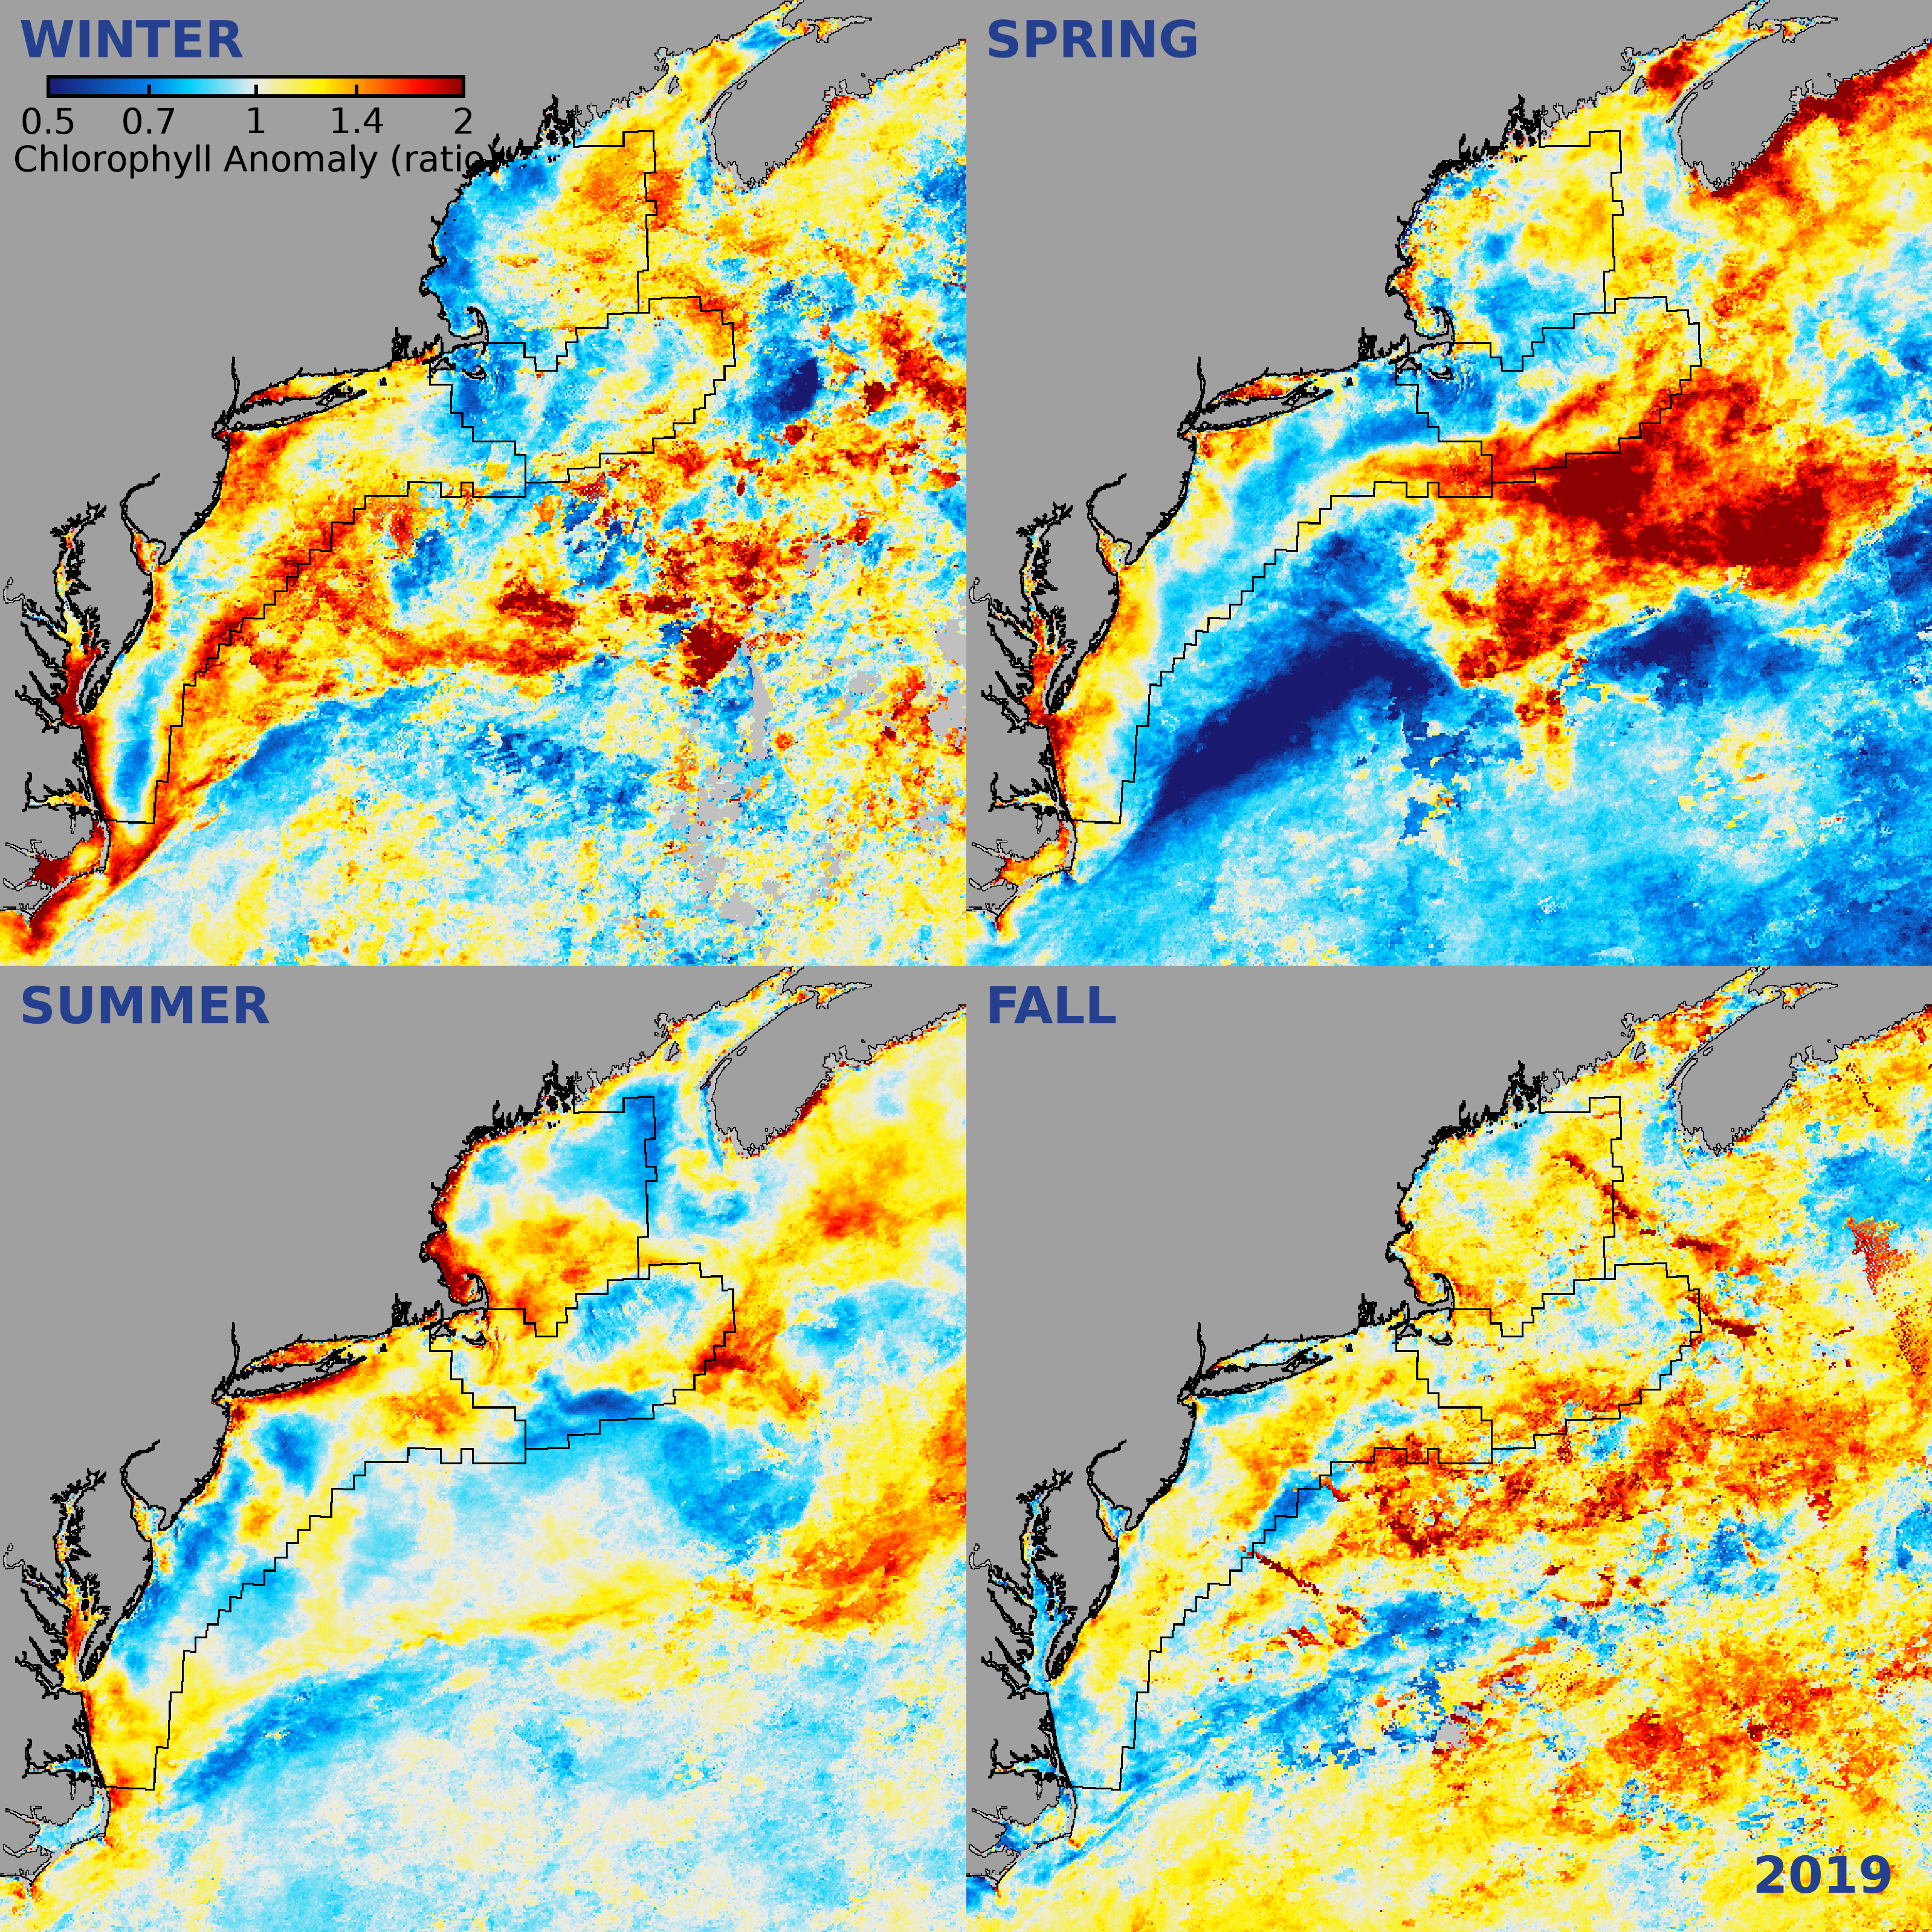 ] --- ## Marine heatwaves in the Mid-Atlantic **New Indicator** .center[ 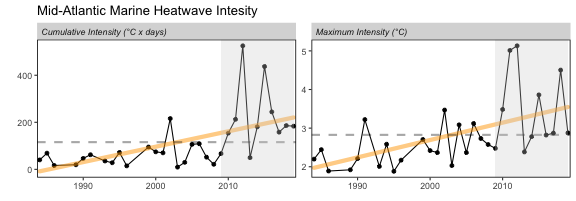 ] .pull-left[ 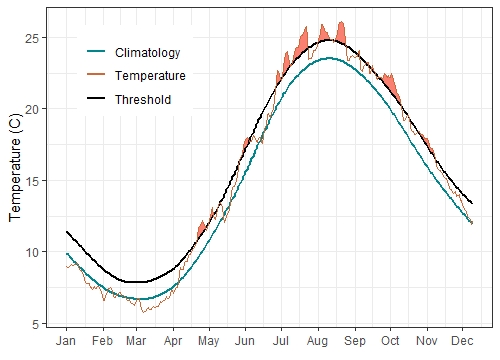 ] .pull-right[ 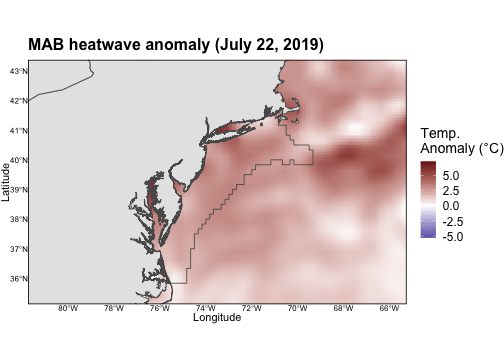 ] --- ## Changing patterns in primary production 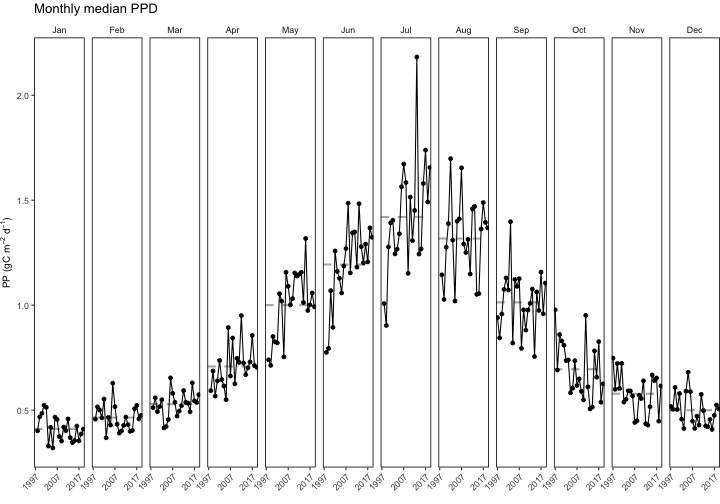 More summer production (warmer, nutrient recycling), but likely smaller-celled species that contribute less to fish production