R/theme_ts.R
theme_ts.Rd
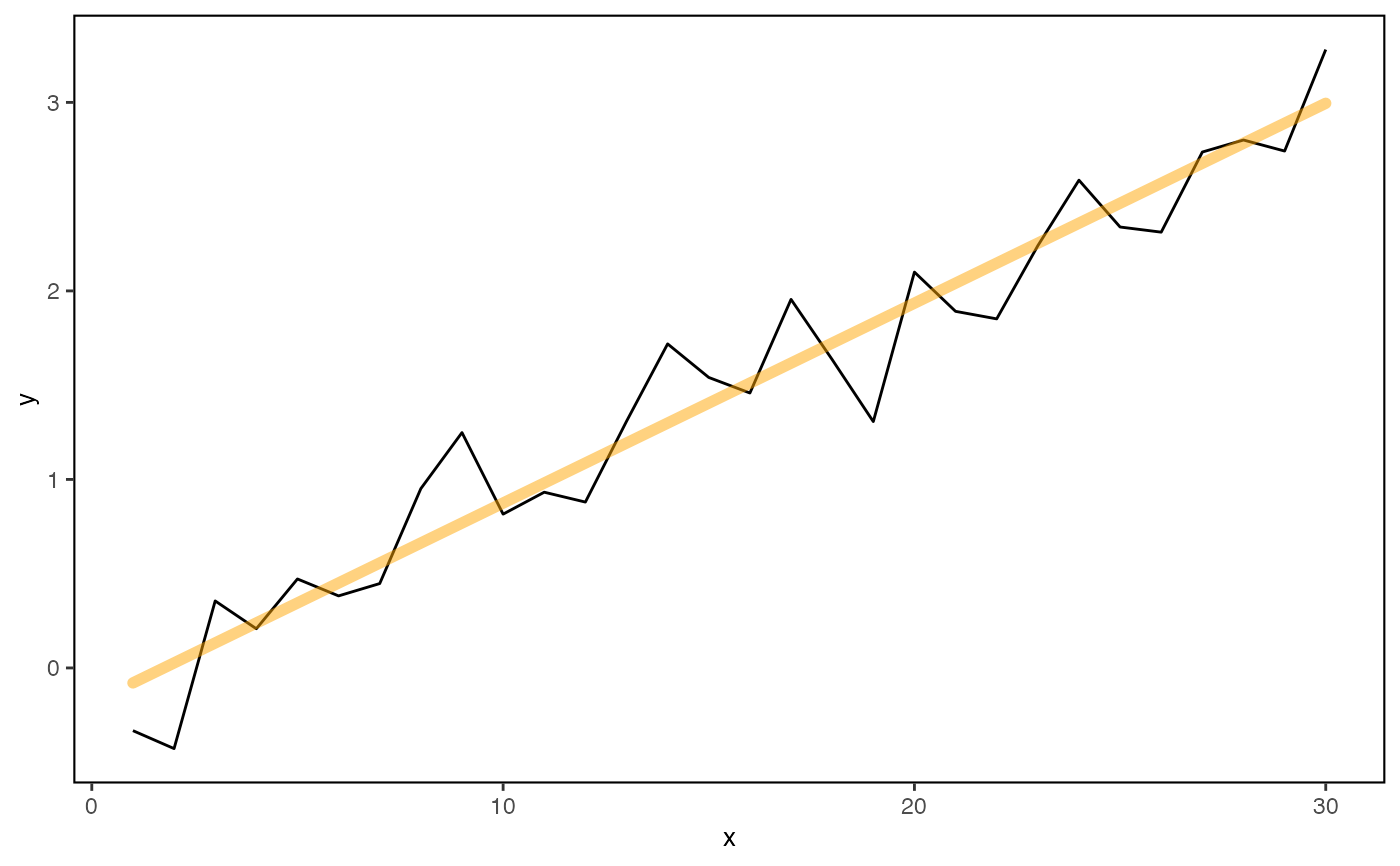
A ggplot2 theme for SOE time series figures
theme_ts(...)
library(ggplot2)
m <- 0.1
x <- 1:30
y <-  m*x + rnorm(30, sd = 0.35)

data <- data.frame(x = x,
                  y = y)

#Plot series with trend and SOE plot theme
ggplot(data = data) +
  geom_line(aes(x = x, y = y)) +
  geom_gls(aes(x = x, y = y))+
  theme_ts()