Each data set in the ecodata package is documented in
the reference
section. Many of the data sets have a similar structure. They are in
long format and ggplot2 can be used to quickly view
them.
For figures as seen in the SOE reports please visit the indicator catalog
Cold pool index data
ggplot(data = ecodata::cold_pool) +
  geom_line(aes(x=Time,y=Value,color=as.factor(EPU))) +
  facet_wrap(vars(Var),scales = "free_y")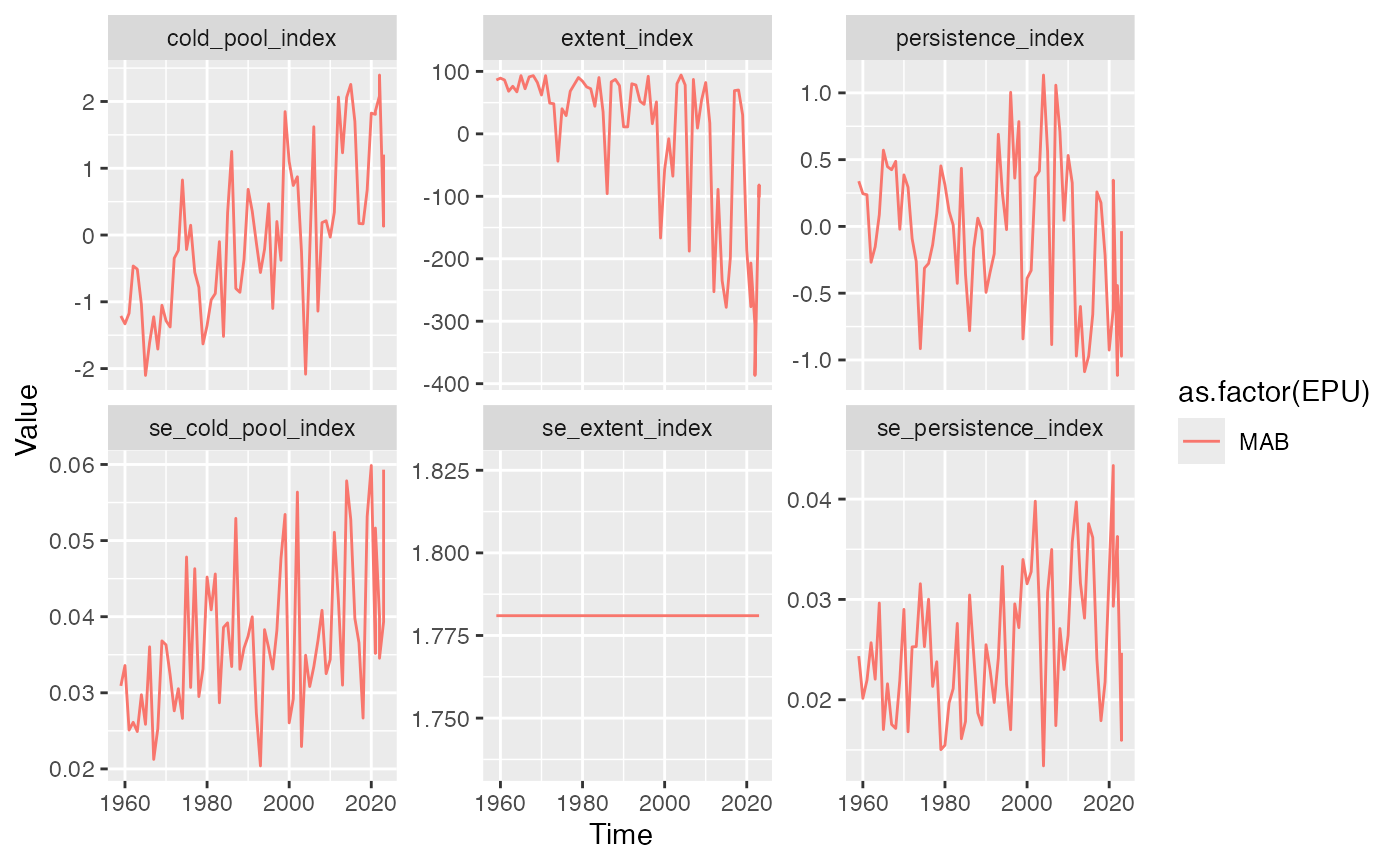
Acuaculture data
ggplot(data = ecodata::aquaculture) +
  geom_line(aes(x=Time,y=Value,color=as.factor(Region))) +
  facet_wrap(vars(Var),scales = "free_y")
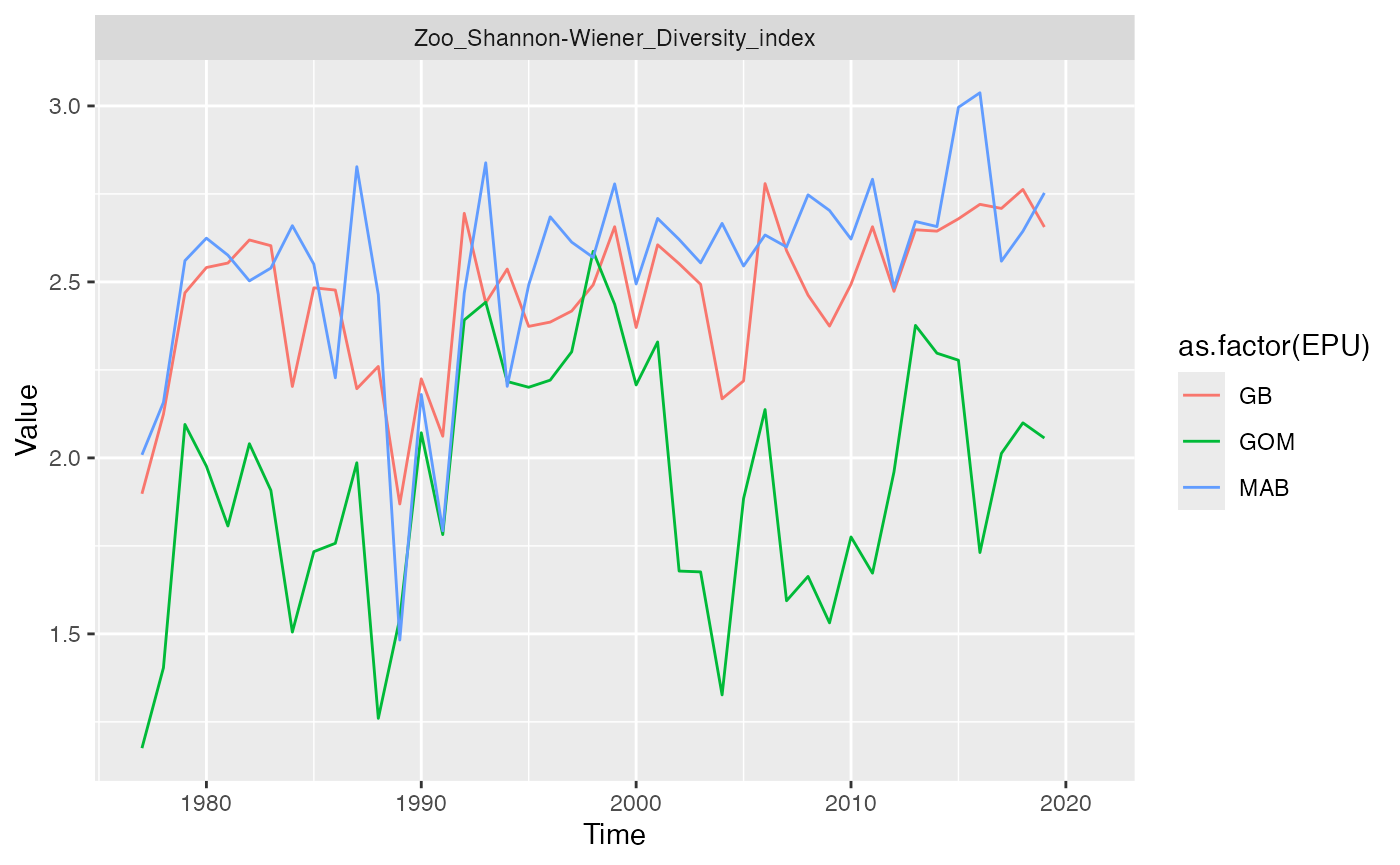
Zooplankton diversity index
ggplot(data = ecodata::zoo_diversity) +
  geom_line(aes(x=Time,y=Value,color=as.factor(EPU))) +
  facet_wrap(vars(Var),scales = "free_y")