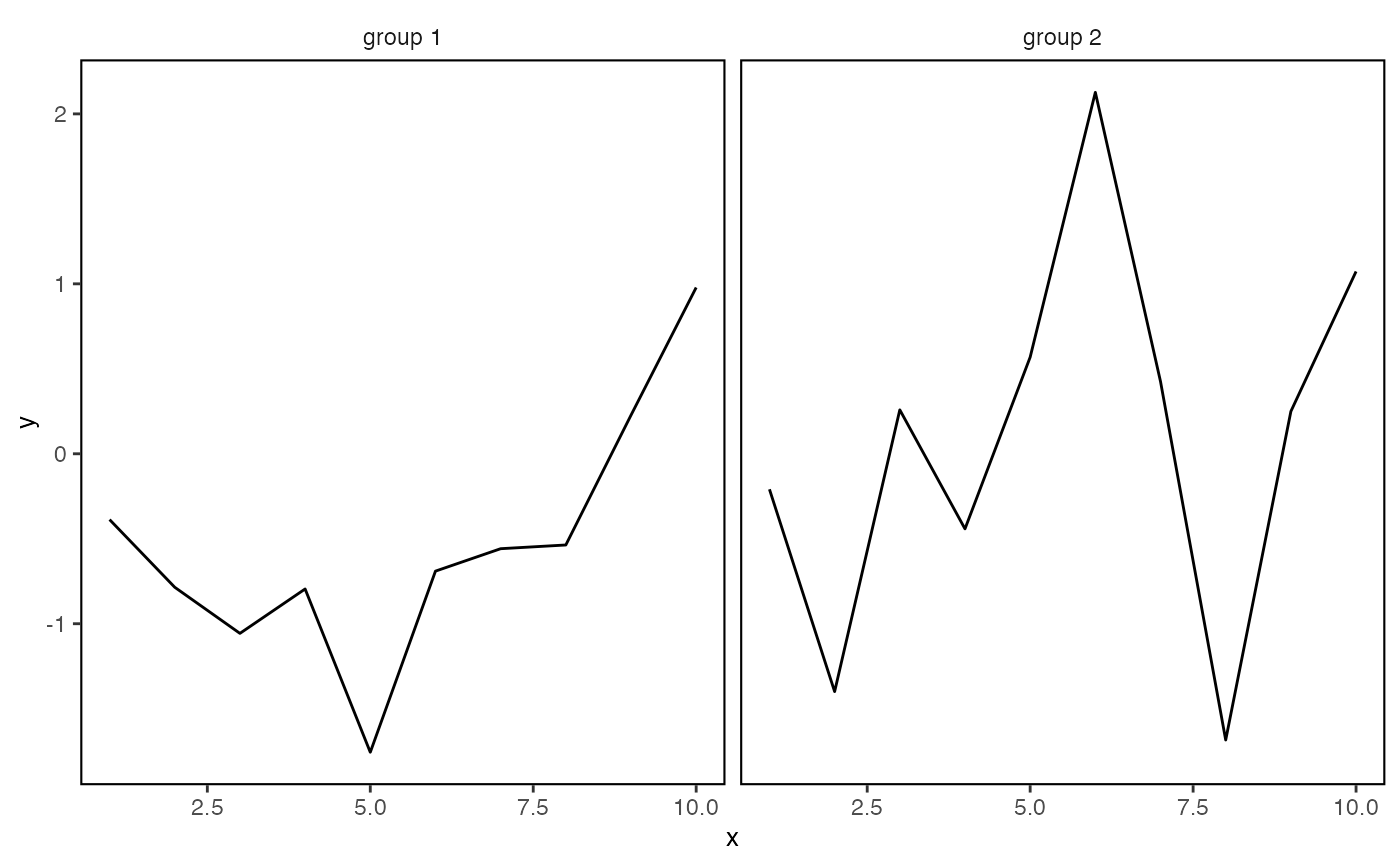
A ggplot2 theme for faceted SOE time series figures
Examples
library(ggplot2)
data <- data.frame(x = rep(1:10,2),
                   y = rnorm(20),
                   Var = rep(c("group 1","group 2"), each = 10))

#Plot series with trend and SOE plot theme
ggplot(data = data) +
  geom_line(aes(x = x, y = y)) +
  facet_wrap(Var~.)+
  theme_facet()
#> Warning: The `size` argument of `element_rect()` is deprecated as of ggplot2 3.4.0.
#> ℹ Please use the `linewidth` argument instead.
#> ℹ The deprecated feature was likely used in the ecodata package.
#>   Please report the issue to the authors.