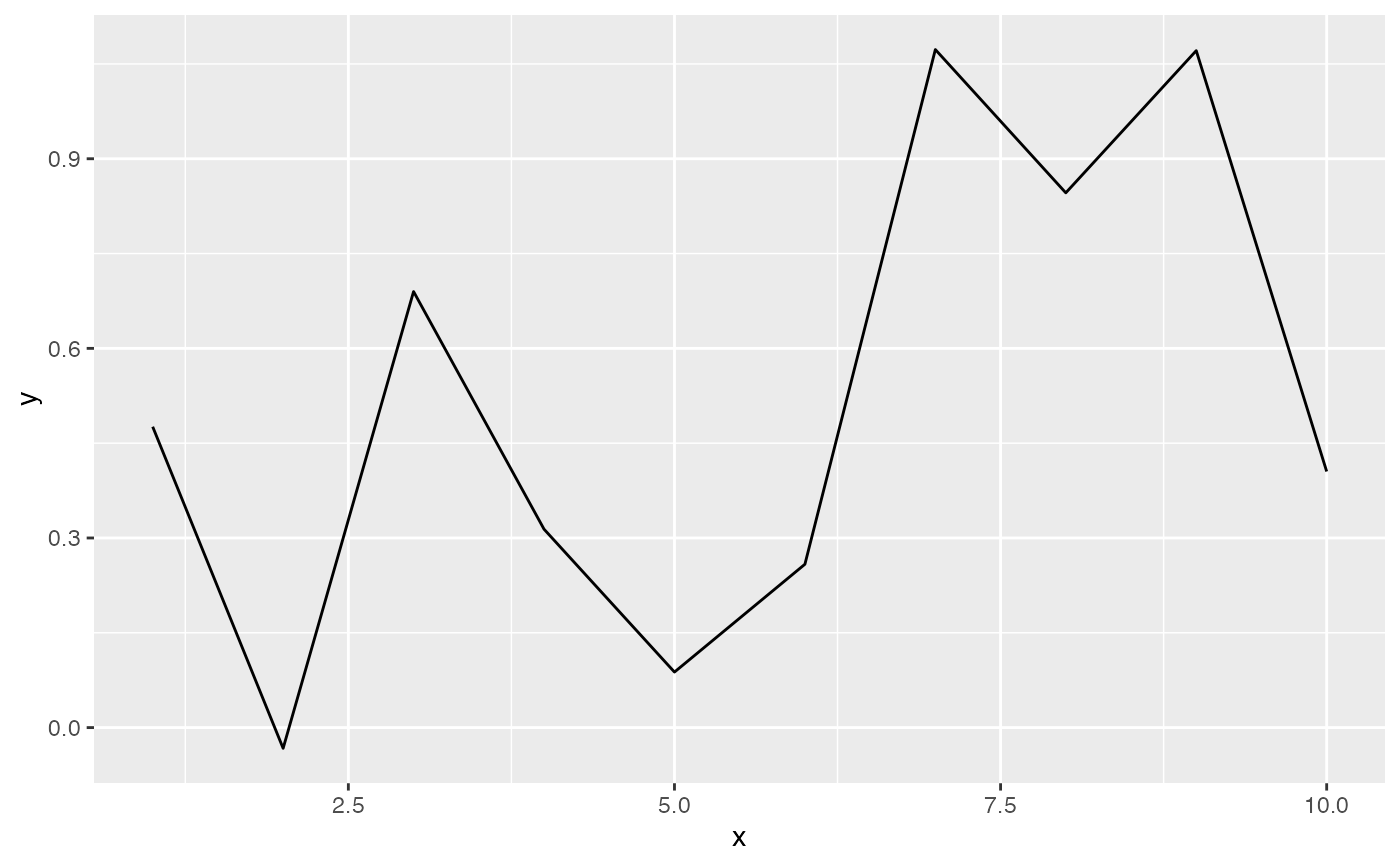
A geom to fit a LM model to a short time series
Usage
geom_lm(
  mapping = NULL,
  data = NULL,
  stat = "LM",
  position = "identity",
  show.legend = NA,
  na.rm = FALSE,
  inherit.aes = TRUE,
  warn = TRUE,
  n = 10,
  nBootSamples = 499,
  pValThreshold = 0.05,
  ...
)
Arguments
- mapping
Set of aesthetic mappings created by
aes(). By defaultinherit.aes = TRUE, which assigns the top-level plottingaes()to the GLS geom.- data
Input series to be analyzed. If NULL, data is inherited from previous layer or
ggplotcall.- stat
stat
- position
position
- show.legend
show legend
- na.rm
remove NAs
- inherit.aes
inherit aesthetics
- warn
Conditional. If
TRUE, a warning message will be returned when N < 30.- n
Numeric. Number of points to use for trend. Default = 10.
- nBootSamples
Numeric. Number of bootstrap samples used to test Null hypothesis. Default = 499
- pValThreshold
Numeric. Significance level of the test. Default = 0.05
- ...
Other arguments may be passed to the stat, including fixed aesthetics.
