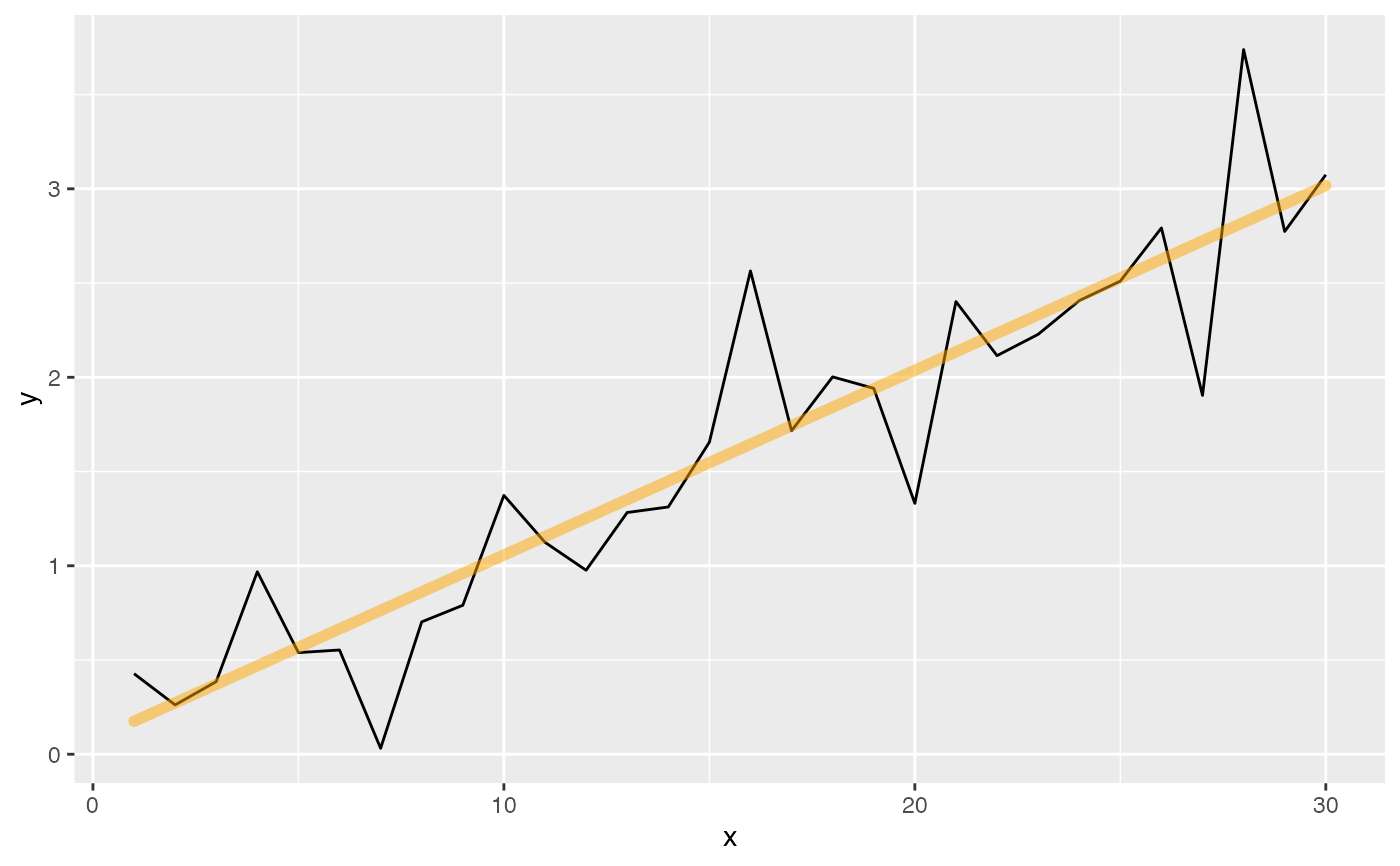
A geom to fit a GLS model to a time series
geom_gls_gauss.RdA geom to fit a GLS model to a time series
geom_gls_gauss(
  mapping = NULL,
  data = NULL,
  stat = "GLSgauss",
  position = "identity",
  na.rm = FALSE,
  show.legend = NA,
  inherit.aes = TRUE,
  warn = TRUE,
  ...
)
Arguments
- mapping
Set of aesthetic mappings created by
aes(). By defaultinherit.aes = TRUE, which assigns the top-level plottingaes()to the GLS geom.- data
Input series to be analyzed. If NULL, data is inherited from previous layer or
ggplotcall.- warn
Conditional. If
TRUE, a warning message will be returned when N < 30.- ...
Other arguments may be passed to the stat, including fixed aesthetics.
Value
If slope is significantly different from 0 (p < 0.05), then a line of best fit is returned. Otherwise output
is NULL.
