class: right, middle, my-title, title-slide # State of the Ecosystem <br /> New England ## NEFMC<br /> 14 April 2022 ### Sean Lucey<br /> Northeast Fisheries Science Center<br /> <br /> Many thanks to:<br /> Kimberly Bastille, Geret DePiper, Sarah Gaichas,<br /> Kimberly Hyde, Scott Large, Laurel Smith,<br /> and all SOE contributors --- class: top, left <style> p.caption { font-size: 0.6em; } </style> <style> .reduced_opacity { opacity: 0.5; } </style> # State of the Ecosystem (SOE) reporting ## Improving ecosystem information and synthesis for fishery managers .pull-left[ - Ecosystem indicators linked to management objectives <a name=cite-depiper_operationalizing_2017></a>([DePiper, et al., 2017](https://academic.oup.com/icesjms/article/74/8/2076/3094701)) + Contextual information + Report evolving since 2016 + Fishery-relevant subset of full Ecosystem Status Reports - Open science emphasis <a name=cite-bastille_improving_2020></a>([Bastille, et al., 2020](https://doi.org/10.1080/08920753.2021.1846155)) ] .pull-right[ *The IEA Loop<sup>1</sup>* 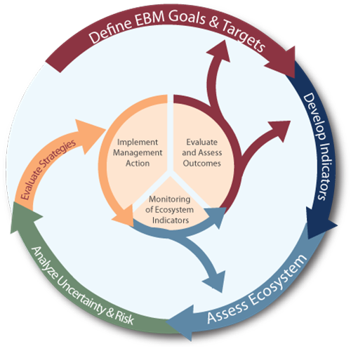 .footnote[ [1] https://www.integratedecosystemassessment.noaa.gov/national/IEA-approach ] ] --- ## State of the Ecosystem: Maintain 2021 structure for 2022 .pull-left[ ## 2021 Report 1. Graphical summary + Page 1-2 report card re: objectives → + Page 3 risk summary bullets + Page 4 synthesis themes 1. Performance relative to management objectives 1. Risks to meeting management objectives ] .pull-right[ <table class="table" style="font-size: 14px; margin-left: auto; margin-right: auto;"> <caption style="font-size: initial !important;">Example ecosystem-scale fishery management objectives</caption> <thead> <tr> <th style="text-align:left;font-weight: bold;"> Objective Categories </th> <th style="text-align:left;font-weight: bold;"> Indicators reported here </th> </tr> </thead> <tbody> <tr grouplength="6"><td colspan="2" style="border-bottom: 1px solid;"><strong>Provisioning and Cultural Services</strong></td></tr> <tr> <td style="text-align:left; padding-left: 2em;" indentlevel="1"> Seafood Production </td> <td style="text-align:left;"> Landings; commercial total and by feeding guild; recreational harvest </td> </tr> <tr> <td style="text-align:left; padding-left: 2em;" indentlevel="1"> Profits </td> <td style="text-align:left;"> Revenue decomposed to price and volume </td> </tr> <tr> <td style="text-align:left; padding-left: 2em;" indentlevel="1"> Recreation </td> <td style="text-align:left;"> Days fished; recreational fleet diversity </td> </tr> <tr> <td style="text-align:left; padding-left: 2em;" indentlevel="1"> Stability </td> <td style="text-align:left;"> Diversity indices (fishery and ecosystem) </td> </tr> <tr> <td style="text-align:left; padding-left: 2em;" indentlevel="1"> Social & Cultural </td> <td style="text-align:left;"> Community engagement/reliance status </td> </tr> <tr> <td style="text-align:left; padding-left: 2em;" indentlevel="1"> Protected Species </td> <td style="text-align:left;"> Bycatch; population (adult and juvenile) numbers, mortalities </td> </tr> <tr grouplength="4"><td colspan="2" style="border-bottom: 1px solid;"><strong>Supporting and Regulating Services</strong></td></tr> <tr> <td style="text-align:left; padding-left: 2em;" indentlevel="1"> Biomass </td> <td style="text-align:left;"> Biomass or abundance by feeding guild from surveys </td> </tr> <tr> <td style="text-align:left; padding-left: 2em;" indentlevel="1"> Productivity </td> <td style="text-align:left;"> Condition and recruitment of managed species, Primary productivity </td> </tr> <tr> <td style="text-align:left; padding-left: 2em;" indentlevel="1"> Trophic structure </td> <td style="text-align:left;"> Relative biomass of feeding guilds, Zooplankton </td> </tr> <tr> <td style="text-align:left; padding-left: 2em;" indentlevel="1"> Habitat </td> <td style="text-align:left;"> Estuarine and offshore habitat conditions </td> </tr> </tbody> </table> ] --- ## State of the Ecosystem summary 2022 .pull-left[ .center[ 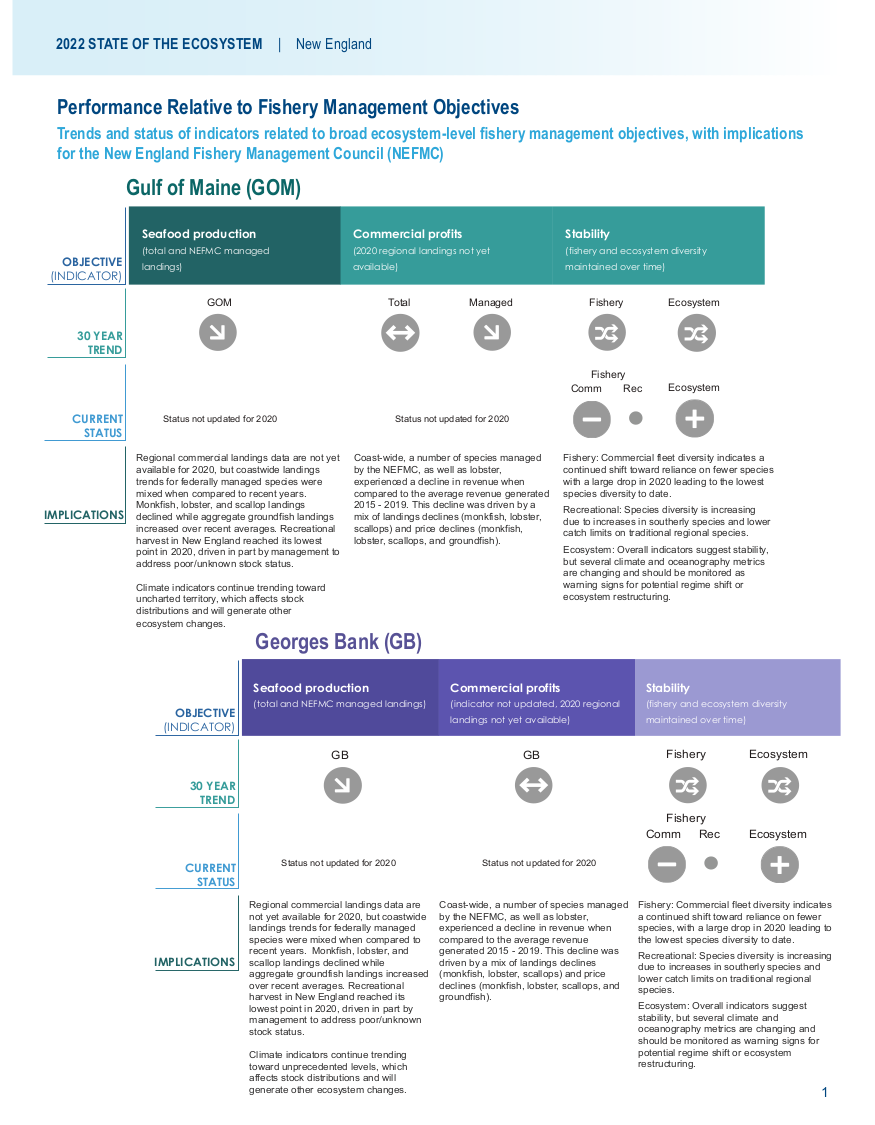 ] ] .pull-right[ .center[ 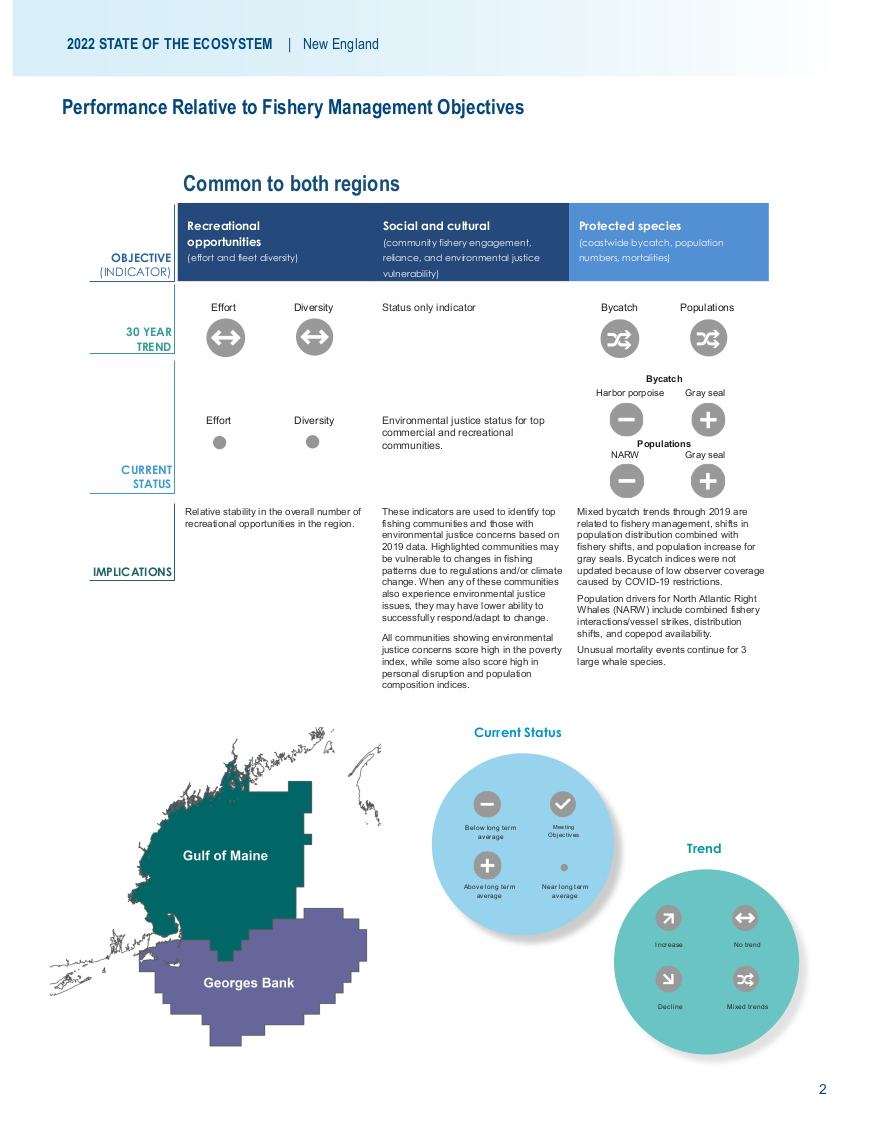 ] ] --- ## State of the Ecosystem: Risks to Meeting Fishery Management Objectives .center[ 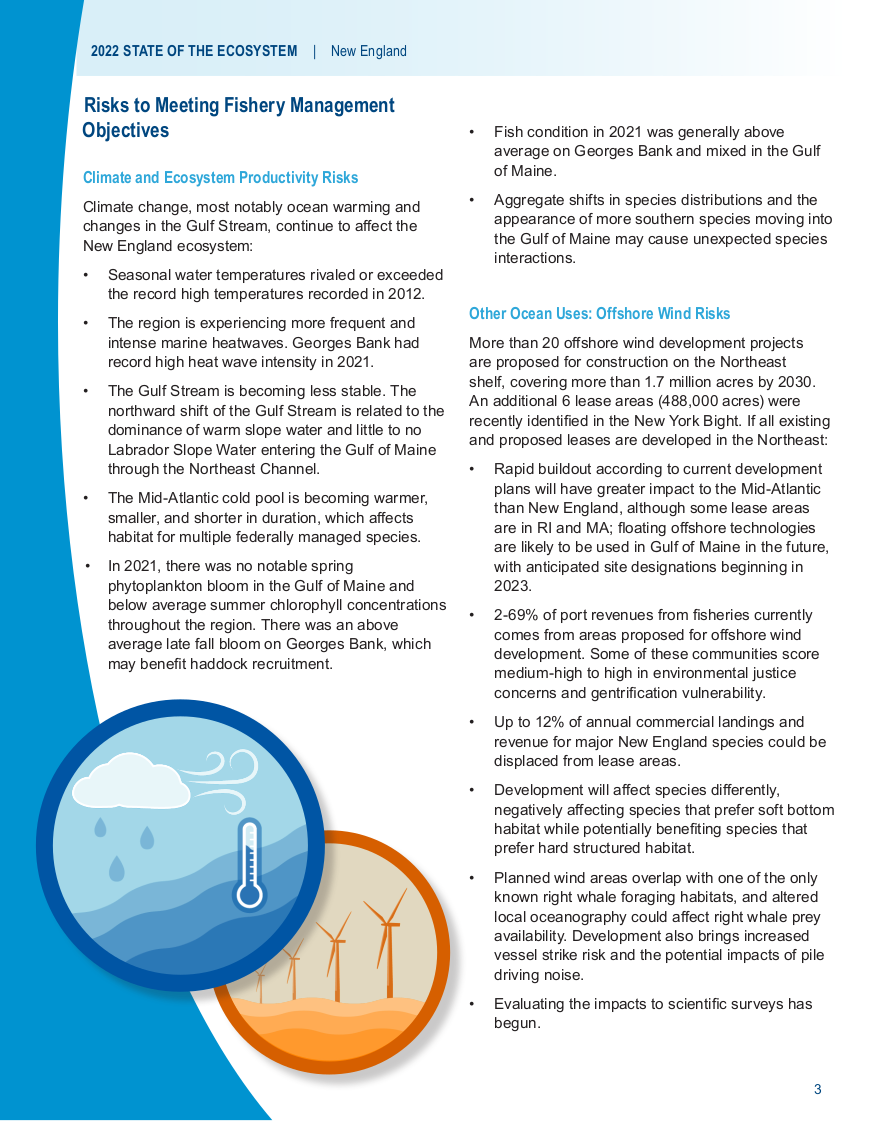 ] --- ## Ecosystem synthesis themes Characterizing ecosystem change for fishery management * Societal, biological, physical and chemical factors comprise the **multiple system drivers** that influence marine ecosystems through a variety of different pathways. * Changes in the multiple drivers can lead to **regime shifts** — large, abrupt and persistent changes in the structure and function of an ecosystem. * Regime shifts and changes in how the multiple system drivers interact can result in **ecosystem reorganization** as species and humans respond and adapt to the new environment. .pull-left[ 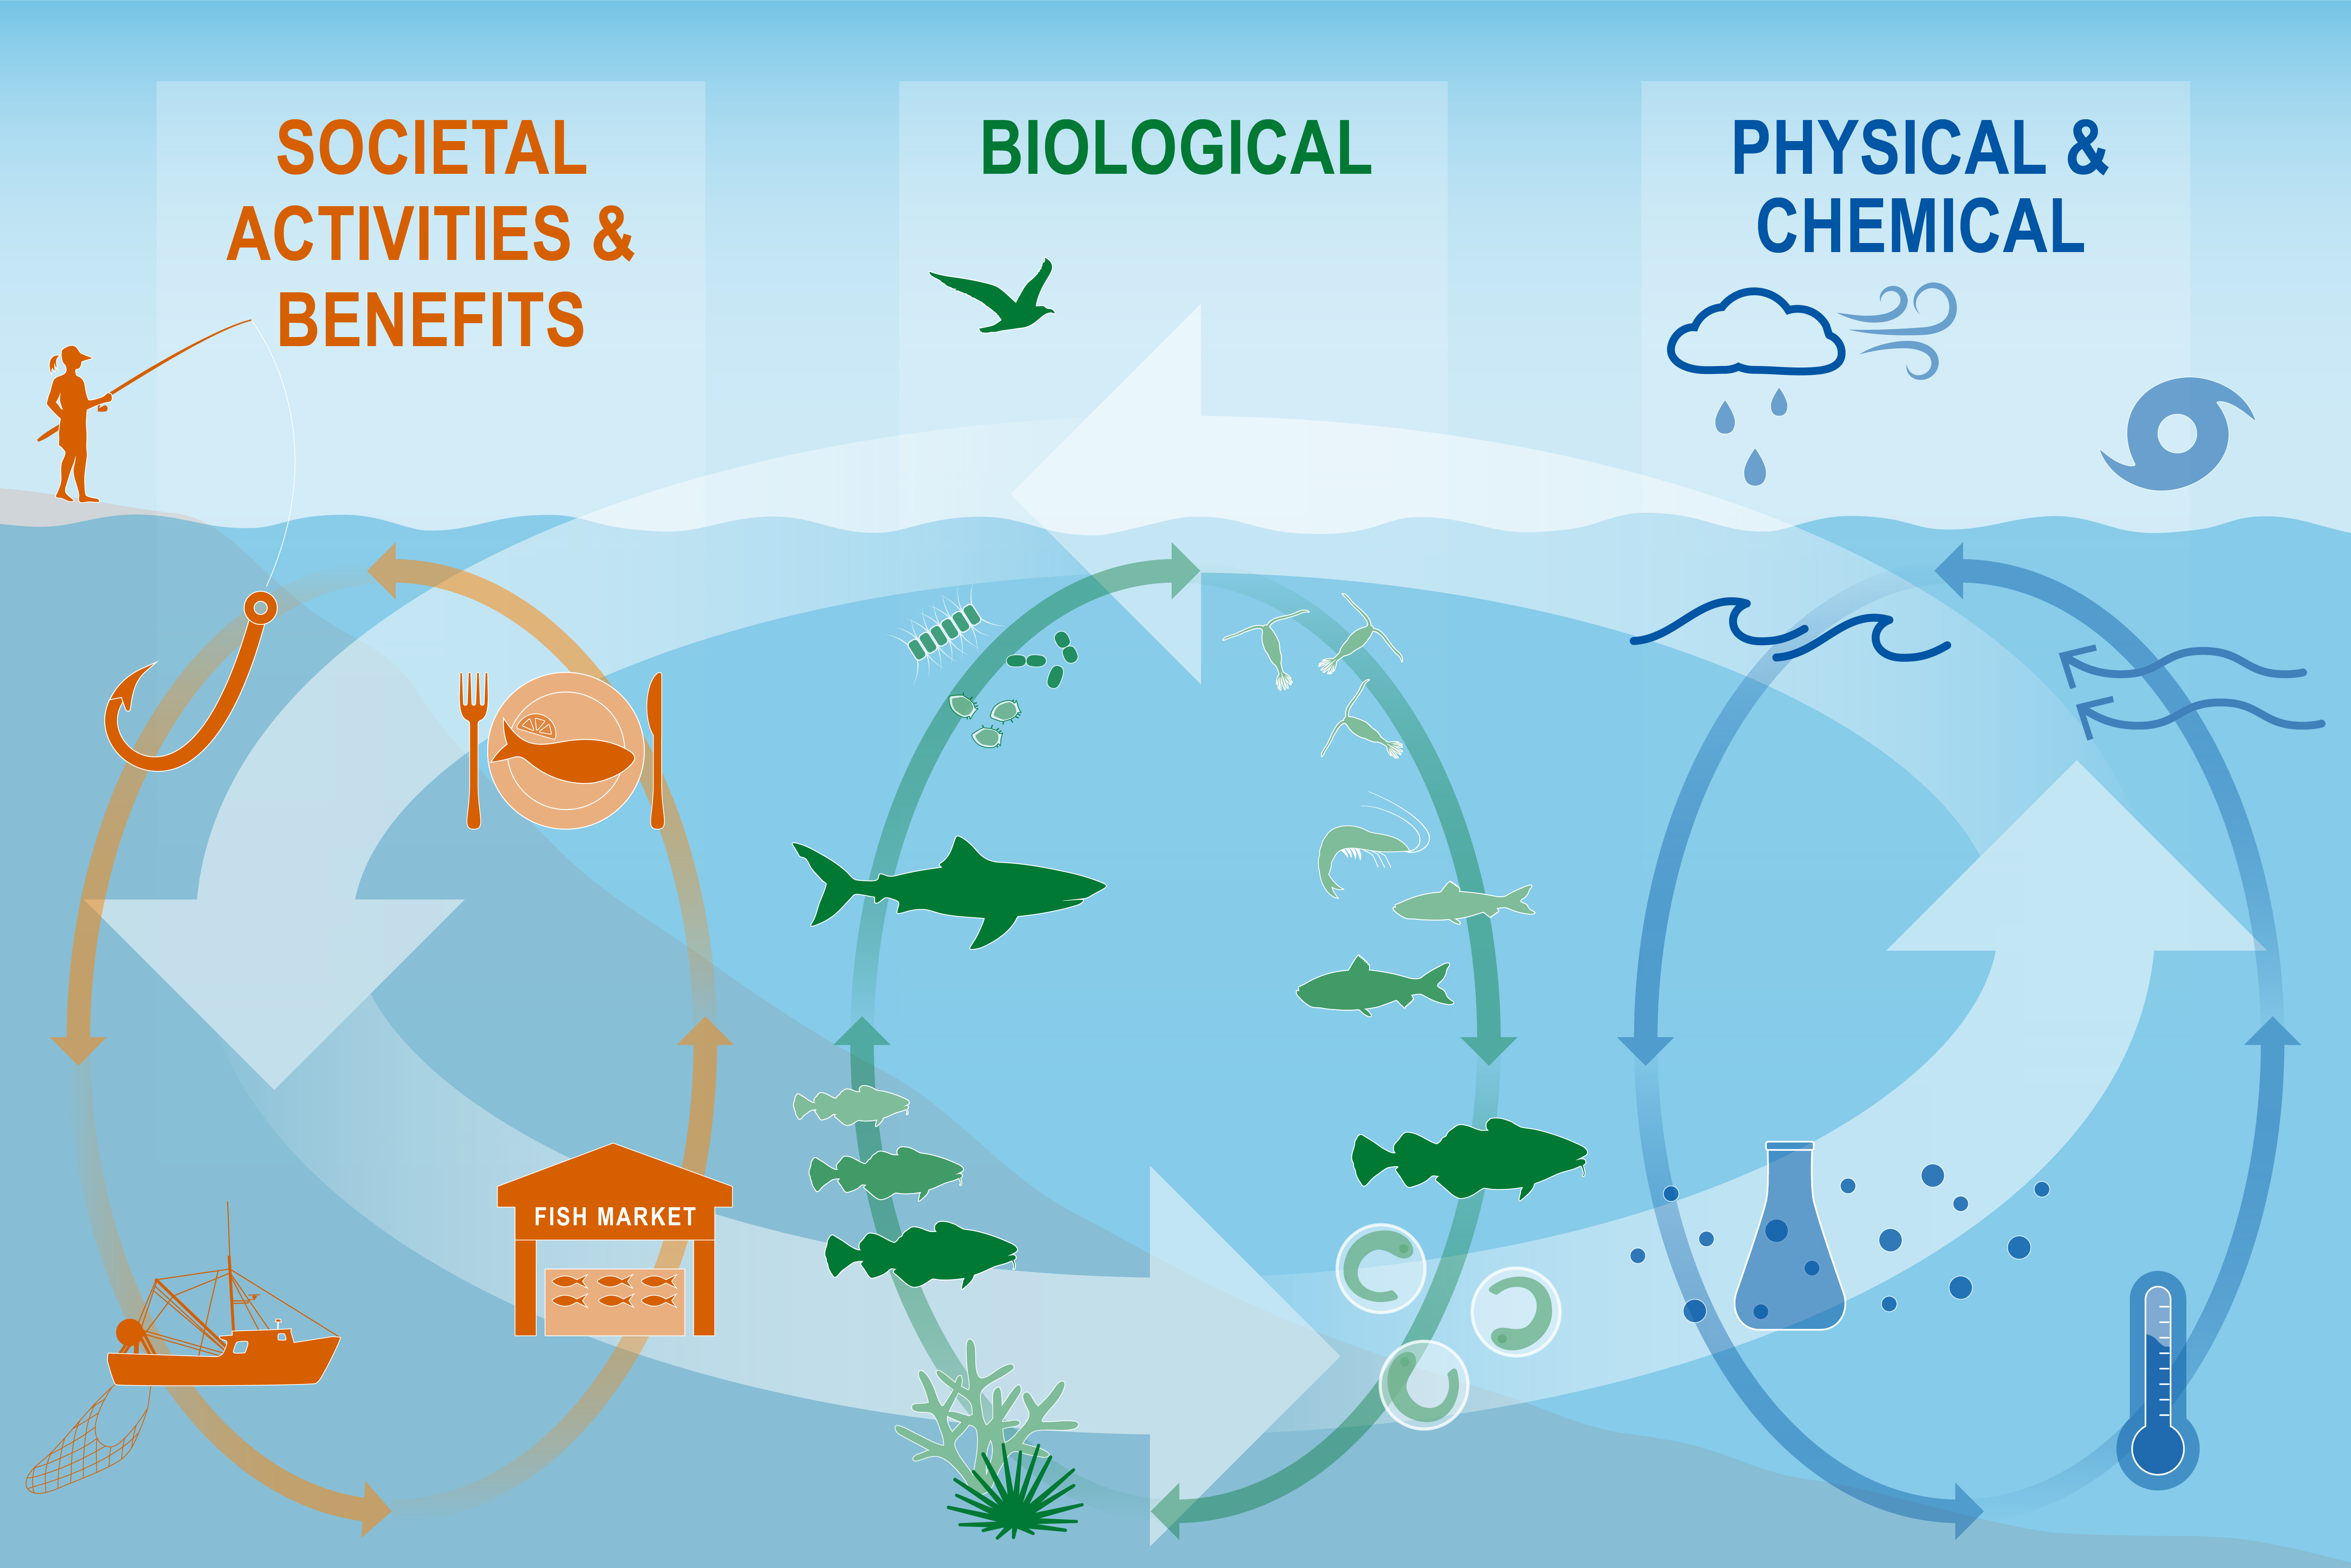 ] .pull-right[ 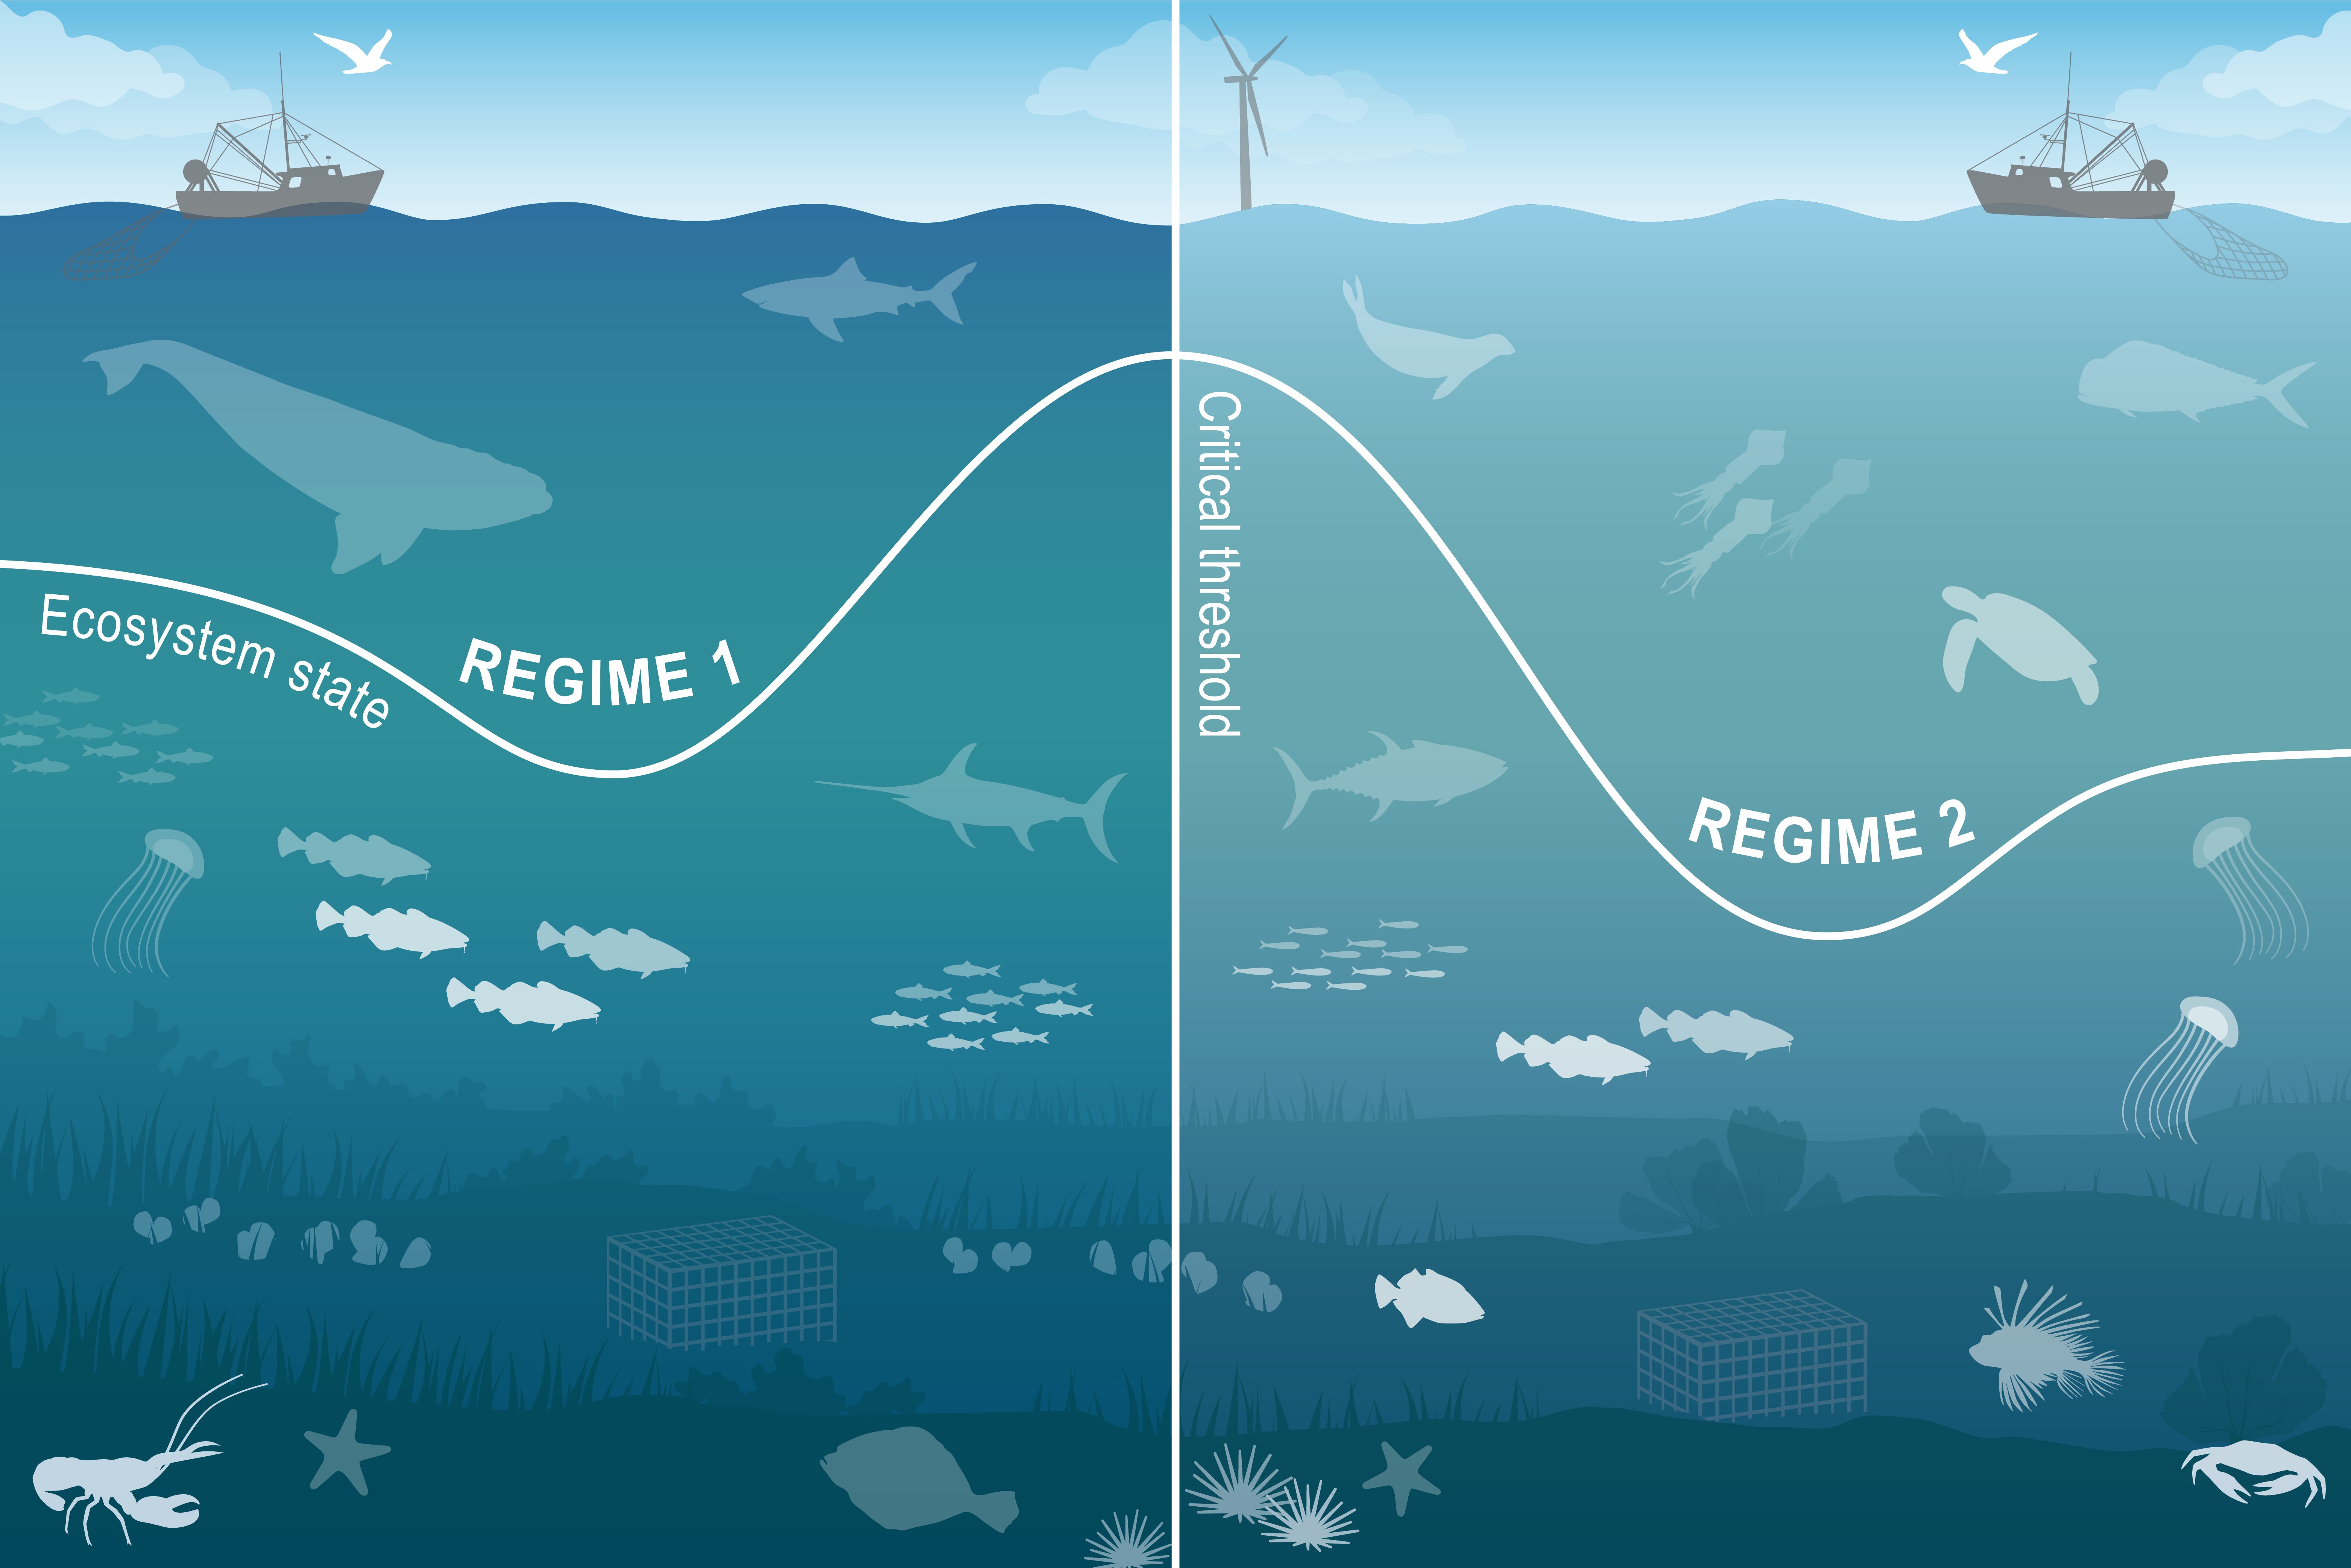 ] --- ## Document Orientation .pull-left[ Spatial scale 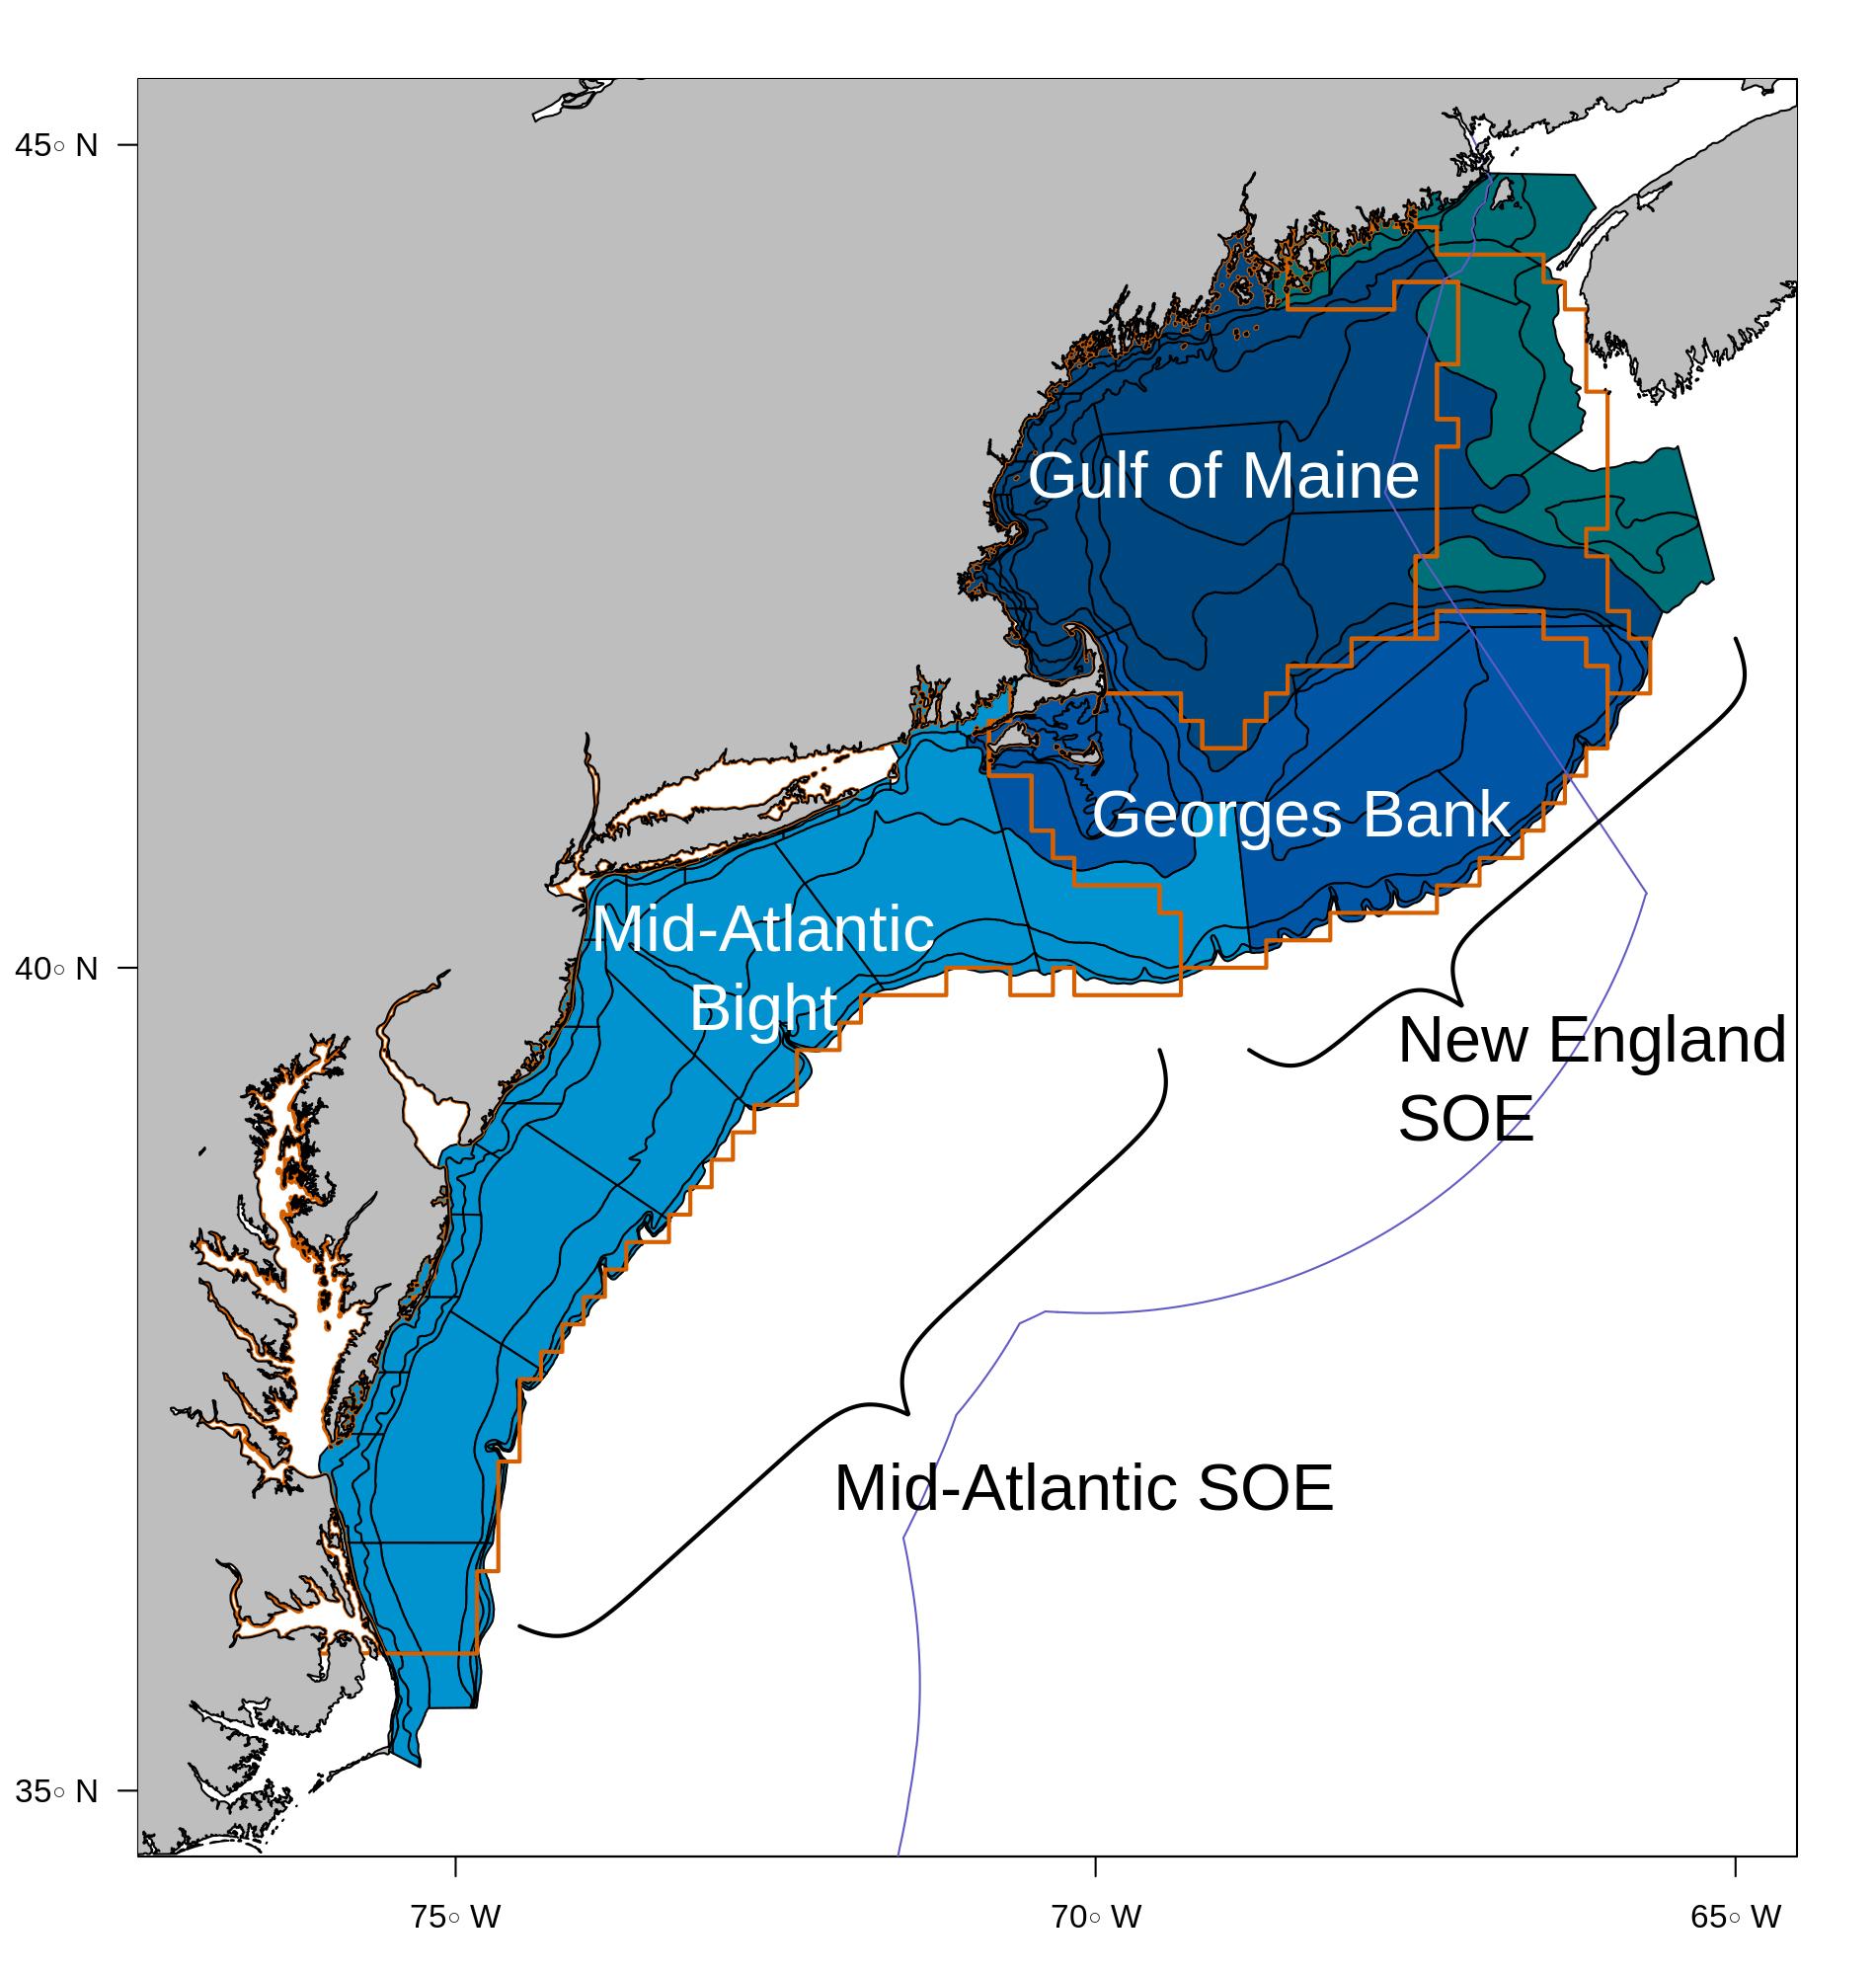 A [glossary of terms](https://noaa-edab.github.io/tech-doc/glossary.html), detailed [technical methods documentation](https://NOAA-EDAB.github.io/tech-doc) and [indicator data](https://github.com/NOAA-EDAB/ecodata) are available online. ] .pull-right[ Key to figures <img src="20220414_NEFMC_Lucey_files/figure-html/unnamed-chunk-5-1.png" width="396" style="display: block; margin: auto;" /> .contrib[ Trends assessed only for 30+ years: [more information](https://noaa-edab.github.io/tech-doc/trend-analysis.html) <p style="color:#FF8C00;">Orange line = significant increase</p> <p style="color:#9932CC;">Purple line = significant decrease</p> No color line = not significant or < 30 years <p style="background-color:#D3D3D3;">Grey background = last 10 years</p> ] ] --- ## Main sections .pull-left[ * Performance relative to management objectives - *What* does the indicator say--up, down, stable? - *Why* do we think it is changing: integrates synthesis themes - Multiple drivers - Regime shifts - Ecosystem reorganization * Objectives - Seafood production - Profits - Recreational opportunities - Stability - Social and cultural - Protected species ] .pull-right[ * Risks to meeting fishery management objectives - *What* does the indicator say--up, down, stable? - *Why* this is important to managers: integrates synthesis themes - Multiple drivers - Regime shifts - Ecosystem reorganization * Risk categories - Climate: warming, ocean currents, acidification - Habitat changes (incl. vulnerability analysis) - Productivity changes (system and fish) - Species interaction changes - Community structure changes - Other ocean uses - Offshore wind development ] --- # Performance relative to management objectives .center[      ] --- ## Objective: Seafood production   .pull-left[ Indicators: Commercial landings .reduced_opacity[ <img src="20220414_NEFMC_Lucey_files/figure-html/unnamed-chunk-6-1.png" width="504" style="display: block; margin: auto;" /> .contrib[ Key: Black = Landings of all species combined; <p style="color:#FF6A6A;">Red = Landings of NEFMC managed species</p> ] ] Coastwide landings at the Federal fishery management plan (FMP) level were mixed in 2020 when compared to recent years. Landings of groundfish were up, while monkfish and scallop were down. Lobster landings also decreased in 2020.* ] .pull-right[ Indicators: Recreational harvest <br /> <img src="20220414_NEFMC_Lucey_files/figure-html/unnamed-chunk-7-1.png" width="504" style="display: block; margin: auto;" /> <img src="20220414_NEFMC_Lucey_files/figure-html/unnamed-chunk-8-1.png" width="504" style="display: block; margin: auto;" /> *[US Seafood Industry and For-Hire Sector Impacts from COVID-19: 2020 in Perspective](https://spo.nmfs.noaa.gov/sites/default/files/TM221.pdf) ] Multiple drivers: ecosystem and stock production, management, market conditions (including COVID-19 disruptions), and environmental change ??? Although scallop decreases are partially explained by a decreased TAC, analyses suggest that the drop in landings is at least partially due to market disruptions due to the COVID-19 pandemic. However, we do not anticipate the long-term declining trend in landings to change. --- ## Landings drivers: Stock status? Survey biomass? .pull-left[ Indicator: Stock status <img src="20220414_NEFMC_Lucey_files/figure-html/unnamed-chunk-9-1.png" width="540" style="display: block; margin: auto;" /> ] .pull-right[ Indicator: Survey biomass <img src="20220414_NEFMC_Lucey_files/figure-html/unnamed-chunk-10-1.png" width="576" style="display: block; margin: auto;" /> ] --- ## Implications: Seafood Production .pull-left[ Drivers: * decline in commercial landings is most likely driven by the requirement to rebuild individual stocks as well as market dynamics * other drivers affecting recreational landings: shark fishery management, possibly survey methodology Monitor: * climate risks including warming, ocean acidification, and shifting distributions * ecosystem composition and production changes * fishing engagement ] .pull-right[ <img src="20220414_NEFMC_Lucey_files/figure-html/unnamed-chunk-11-1.png" width="576" style="display: block; margin: auto;" /> ] --- ## Objective: Commercial Profits  Indicator: Commercial Revenue .reduced_opacity[ <img src="20220414_NEFMC_Lucey_files/figure-html/unnamed-chunk-12-1.png" width="540" style="display: block; margin: auto;" /> .contrib[ Key: Black = Revenue of all species combined; <p style="color:#FF6A6A;">Red = Revenue of NEFMC managed species</p> ] .pull-left[ Both regions driven by single species * GOM high revenue despite low volume * Fluctuations in GB due to rotational management ] ] .pull-right[ Monitor changes in climate and landings drivers: * Sea scallops and lobsters are sensitive to ocean warming and acidification ] --- ## Objective: Recreational opportunities   .pull-left[ Indicators: Recreational effort and fleet diversity <img src="20220414_NEFMC_Lucey_files/figure-html/unnamed-chunk-13-1.png" width="504" style="display: block; margin: auto;" /> <img src="20220414_NEFMC_Lucey_files/figure-html/unnamed-chunk-14-1.png" width="504" style="display: block; margin: auto;" /> ] .pull-right[ Implications * Absence of a long-term trend in recreational effort suggests relative stability in the overall number of recreational opportunities in New England ] --- ## Objective: Stability  Com ; Rec  .pull-left[ *Fishery* Indicators: Commercial fleet count, fleet diversity <img src="20220414_NEFMC_Lucey_files/figure-html/unnamed-chunk-15-1.png" width="504" style="display: block; margin: auto;" /> ] .pull-right[ *Fishery* Indicators: commerical species revenue diversity, recreational species catch diversity <img src="20220414_NEFMC_Lucey_files/figure-html/unnamed-chunk-16-1.png" width="504" style="display: block; margin: auto;" /> <img src="20220414_NEFMC_Lucey_files/figure-html/unnamed-chunk-17-1.png" width="504" style="display: block; margin: auto;" /> ] --- ## Objective: Stability   .pull-left[ *Ecological* Indicators: zooplankton and larval fish diversity .reduced_opacity[ <img src="20220414_NEFMC_Lucey_files/figure-html/unnamed-chunk-18-1.png" width="504" style="display: block; margin: auto;" /> <img src="20220414_NEFMC_Lucey_files/figure-html/unnamed-chunk-19-1.png" width="504" style="display: block; margin: auto;" /> ] ] .pull-right[ *Ecological* Indicator: expected number of species, NEFSC bottom trawl survey <img src="20220414_NEFMC_Lucey_files/figure-html/unnamed-chunk-20-1.png" width="504" style="display: block; margin: auto;" /> Implications: * Commercial fishery diversity driven by small number of species * Diminished capacity to respond to future fishing opportunities * Recreational diversity due to species distributions and regulations * Adult diversity in GOM suggests increase in warm-water species ] ??? * Overall stability in the fisheries and ecosystem components * Increasing diversity in several indicators warrants continued monitoring --- ## Objective: Environmental Justice and Social Vulnerability Indicators: Environmental justice vulnerability, commercial fishery engagement and reliance .pull-left[ <img src="20220414_NEFMC_Lucey_files/figure-html/unnamed-chunk-21-1.png" width="468" style="display: block; margin: auto;" /> New England commercial fishing communities ] .pull-right[ <img src="20220414_NEFMC_Lucey_files/figure-html/unnamed-chunk-22-1.png" width="100%" style="display: block; margin: auto;" /> <!--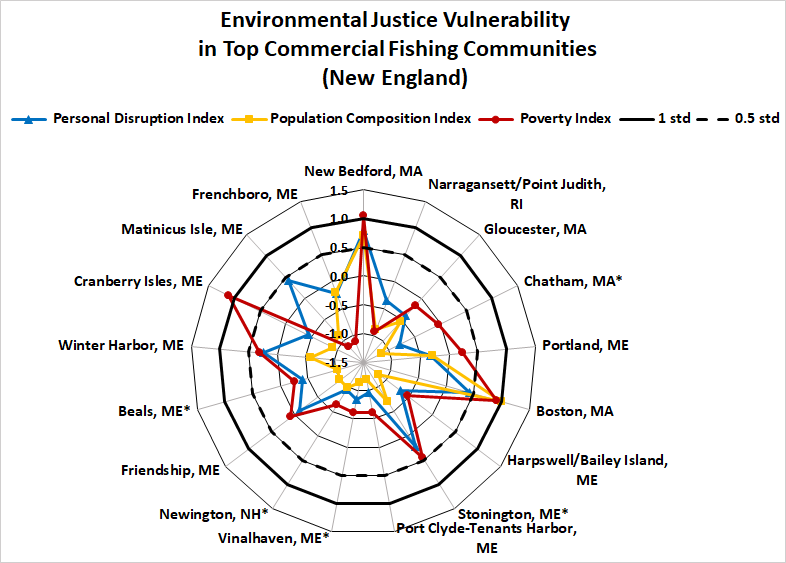--> ] Implications: Highlighted communities may be vulnerable to changes in fishing patterns due to regulations and/or climate change. When also experiencing environmental justice issues, they may have lower ability to successfully respond to change. ??? These plots provide a snapshot of the presence of environmental justice issues in the most highly engaged and most highly reliant commercial and recreational fishing communities in the Mid-Atlantic. These communities may be vulnerable to changes in fishing patterns due to regulations and/or climate change. When any of these communities are also experiencing social vulnerability including environmental justice issues, they may have lower ability to successfully respond to change. --- ## Objective: Environmental Justice and Social Vulnerability Indicators: Environmental justice vulnerability, recreational fishery engagement and reliance .pull-left[ <img src="20220414_NEFMC_Lucey_files/figure-html/unnamed-chunk-23-1.png" width="468" style="display: block; margin: auto;" /> New England recreational fishing communities ] .pull-right[ <img src="20220414_NEFMC_Lucey_files/figure-html/unnamed-chunk-24-1.png" width="100%" style="display: block; margin: auto;" /> <!--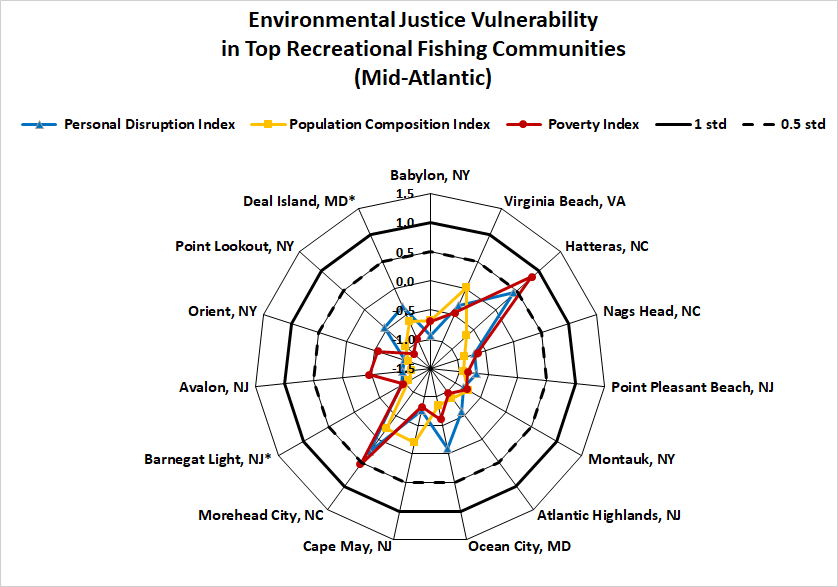--> ] Implications: Highlighted communities may be vulnerable to changes in fishing patterns due to regulations and/or climate change. When also experiencing environmental justice issues, they may have lower ability to successfully respond to change. --- ## Objectives: Protected species *Maintain bycatch below thresholds*   .pull-left[ Indicators: Harbor porpoise and gray seal bycatch .reduced_opacity[ <img src="20220414_NEFMC_Lucey_files/figure-html/unnamed-chunk-25-1.png" width="504" style="display: block; margin: auto;" /> <img src="20220414_NEFMC_Lucey_files/figure-html/unnamed-chunk-26-1.png" width="504" style="display: block; margin: auto;" /> ] ] .pull-right[ Implications: * Currently meeting objectives * The downward trend in harbor porpoise bycatch can also be due to a decrease in harbor porpoise abundance in US waters, reducing their overlap with fisheries, and a decrease in gillnet effort. * The increasing trend in gray seal bycatch may be related to an increase in the gray seal population (U.S. pup counts). ] --- ## Objectives: Protected species *Recover endangered populations*   .pull-left[ Indicators: North Atlantic right whale population, calf counts <img src="20220414_NEFMC_Lucey_files/figure-html/unnamed-chunk-27-1.png" width="504" style="display: block; margin: auto;" /> <img src="20220414_NEFMC_Lucey_files/figure-html/unnamed-chunk-28-1.png" width="504" style="display: block; margin: auto;" /> ] .pull-right[ Implications: * Population drivers for North Atlantic Right Whales (NARW) include combined fishery interactions/ship strikes, distribution shifts, and copepod availability. * Additional potential stressors include offshore wind development, which overlaps with important habitat areas used year-round by right whales, including mother and calf migration corridors and foraging habitat. * Unusual mortality events continue for 3 large whale species. ] --- # Risks to meeting fishery management objectives .center[   ] .center[      ] --- background-image: url("EDAB_images/seasonal-sst-anom-gridded-1.png") background-size: 600px background-position: right ## Risks: Climate change .pull-left[ Indicators: ocean currents, bottom and surface temperature <img src="20220414_NEFMC_Lucey_files/figure-html/unnamed-chunk-29-1.png" width="288" style="display: block; margin: auto;" /> <img src="20220414_NEFMC_Lucey_files/figure-html/unnamed-chunk-30-1.png" width="288" style="display: block; margin: auto;" /> <img src="20220414_NEFMC_Lucey_files/figure-html/unnamed-chunk-31-1.png" width="432" style="display: block; margin: auto;" /> ] --- ## Risks: Climate change .pull-left[ Indicators: marine heatwaves <img src="20220414_NEFMC_Lucey_files/figure-html/unnamed-chunk-32-1.png" width="360" style="display: block; margin: auto;" /> <img src="20220414_NEFMC_Lucey_files/figure-html/unnamed-chunk-33-1.png" width="360" style="display: block; margin: auto;" /> ] .pull-right[ <br /> <img src="20220414_NEFMC_Lucey_files/figure-html/unnamed-chunk-34-1.png" width="504" style="display: block; margin: auto;" /> <img src="20220414_NEFMC_Lucey_files/figure-html/unnamed-chunk-35-1.png" width="504" style="display: block; margin: auto;" /> ] --- ## Risks: Climate change and offshore habitat .pull-left[ Indicator: cold pool indices <img src="20220414_NEFMC_Lucey_files/figure-html/unnamed-chunk-36-1.png" width="504" style="display: block; margin: auto;" /> Indicator: Ocean acidification  ] .pull-right[ Indicator: warm core rings <img src="20220414_NEFMC_Lucey_files/figure-html/unnamed-chunk-37-1.png" width="504" style="display: block; margin: auto;" /> .center[  ] ] --- ## Risks: Ecosystem productivity Indicators: chlorophyll, primary production .pull-left[ <img src="20220414_NEFMC_Lucey_files/figure-html/unnamed-chunk-38-1.png" width="504" style="display: block; margin: auto;" /> ] .pull-right[ <img src="20220414_NEFMC_Lucey_files/figure-html/unnamed-chunk-39-1.png" width="504" style="display: block; margin: auto;" /> ] Implications: increased production by smaller phytoplankton implies less efficient transfer of primary production to higher trophic levels. Monitor implications of increasing gelatinous zooplankton and krill. ??? Below average phytoplankton biomass could be due to reduced nutrient flow to the surface and/or increased grazing pressure. A short fall bloom was detected in November. Primary productivity (the rate of photosynthesis) was average to below average throughout 2021 --- ## Risks: Ecosystem productivity <img src="20220414_NEFMC_Lucey_files/figure-html/unnamed-chunk-40-1.png" width="90%" style="display: block; margin: auto;" /> Implications: fluctuating environmental conditions and prey for forage species affect both abundance and energy content. Energy content varies by season, and has changed over time most dramatically for Atlantic herring --- ## Risks: Ecosystem productivity Indicator: fish condition .pull-left[ Georges Bank <img src="20220414_NEFMC_Lucey_files/figure-html/unnamed-chunk-41-1.png" width="120%" style="display: block; margin: auto;" /> ] .pull-right[ Gulf of Maine <img src="20220414_NEFMC_Lucey_files/figure-html/unnamed-chunk-42-1.png" width="120%" style="display: block; margin: auto;" /> ] Implications: Many species in New England showed improved condition in 2021. Preliminary results of synthetic analyses show that changes in temperature, zooplankton, fishing pressure, and population size influence the condition of different fish species. --- ## Risks: Ecosystem productivity Indicator: fish productivity anomaly .pull-left[ <div class="figure" style="text-align: center"> <img src="20220414_NEFMC_Lucey_files/figure-html/productivity-anomaly-gb-1.png" alt="Small fish per large fish biomass anomaly on Georges Bank. The summed anomaly across species is shown by the black line." width="504" /> <p class="caption">Small fish per large fish biomass anomaly on Georges Bank. The summed anomaly across species is shown by the black line.</p> </div> ] .pull-right[ <div class="figure" style="text-align: center"> <img src="20220414_NEFMC_Lucey_files/figure-html/productivity-anomaly-gom-1.png" alt="Small fish per large fish biomass anomaly in the Gulf of Maine. The summed anomaly across species is shown by the black line." width="504" /> <p class="caption">Small fish per large fish biomass anomaly in the Gulf of Maine. The summed anomaly across species is shown by the black line.</p> </div> ] --- ## Risks: Ecosystem structure Indicators: distribution shifts, diversity, predator status and trends .pull-left[ *No trend in aggregate sharks* <img src="20220414_NEFMC_Lucey_files/figure-html/unnamed-chunk-43-1.png" width="504" style="display: block; margin: auto;" /> ] .pull-right[ *HMS populations mainly at or above target* <img src="20220414_NEFMC_Lucey_files/figure-html/unnamed-chunk-44-1.png" width="504" style="display: block; margin: auto;" /> ] --- ## Risks: Ecosystem structure Indicators: predators .pull-left[ <img src="20220414_NEFMC_Lucey_files/figure-html/unnamed-chunk-45-1.png" width="504" style="display: block; margin: auto;" /> ] .pull-right[ *Gray seals increasing* * Breeding season ~ 27,000 US gray seals, Canada's population ~ 425,000 (2016) * Canada's population increasing at ~ 4% per year * U.S. pupping sites increased from 1 (1988) to 9 (2019) * Harbor and gray seals are generalist predators that consume more than 30 different prey species: red, white and silver hake, sand lance, yellowtail flounder, four-spotted flounder, Gulf-stream flounder, haddock, herring, redfish, and squids. Implications: stable predator populations suggest stable predation pressure on managed species, but increasing predator populations may reflect increasing predation pressure. ] --- ## Risks: Habitat climate vulnerability Indicators: climate sensitive species life stages mapped to climate vulnerable habitats <div id="htmlwidget-a97c0e1b75769161fb49" style="width:100%;height:226.8px;" class="widgetframe html-widget"></div> <script type="application/json" data-for="htmlwidget-a97c0e1b75769161fb49">{"x":{"url":"20220414_NEFMC_Lucey_files/figure-html//widgets/widget_unnamed-chunk-46.html","options":{"xdomain":"*","allowfullscreen":false,"lazyload":false}},"evals":[],"jsHooks":[]}</script> --- background-image: url("EDAB_images/offshore_wind_timeline.png") background-size: 500px background-position: right ## Risks: Offshore Wind Development .pull-left[ Indicators: development timeline <img src="20220414_NEFMC_Lucey_files/figure-html/unnamed-chunk-47-1.png" width="504" style="display: block; margin: auto;" /> ] --- ## Risks: Offshore Wind Development Indicators: fishery and community specific revenue in lease areas .pull-left[ <img src="20220414_NEFMC_Lucey_files/figure-html/unnamed-chunk-48-1.png" width="504" style="display: block; margin: auto;" /> ] .pull-right[ <img src="20220414_NEFMC_Lucey_files/figure-html/unnamed-chunk-49-1.png" width="504" style="display: block; margin: auto;" /> ] --- background-image: url("EDAB_images/NARW_hotpsot_persistence_2_1_2022_TPW.png") background-size: 500px background-position: right ## Risks: Offshore Wind Development .pull-left[ Implications: * 2-69% of port revenue from fisheries currently comes from areas proposed for offshore wind development. Some communities have environmental justice concerns and gentrification vulnerability. * Up to 12% of annual commercial landings and revenue for major New England species occur in lease areas. * Development will affect species differently, negatively affecting species that prefer soft bottom habitat while potentially benefiting species that prefer hard structured habitat. * Planned wind areas overlap with one of the only known right whale foraging habitats, and altered local oceanography could affect right whale prey availability. Development also brings increased vessel strike risk and the potential impacts of pile driving noise. ] .pull-right[] ??? Current plans for rapid buildout of offshore wind in a patchwork of areas spreads the impacts differentially throughout the region Evaluating the impacts to scientific surveys has begun. --- background-image: url("EDAB_images/noaa-iea.png") background-size: 350px background-position: right bottom ## Contributors - THANK YOU! The New England and Mid-Atlantic SOEs made possible by (at least) 61 contributors from 14 institutions .pull-left[ .contrib[ Kimberly Bastille<br> Aaron Beaver (Anchor QEA)<br> Andy Beet<br> Ruth Boettcher (Virginia Department of Game and Inland Fisheries)<br> Mandy Bromilow (NOAA Chesapeake Bay Office)<br> Zhuomin Chen (Woods Hole Oceanographic Institute)<br> Joseph Caracappa<br> Doug Christel (GARFO)<br> Patricia Clay<br> Lisa Colburn<br> Jennifer Cudney (NMFS Atlantic HMS Management Division)<br> Tobey Curtis (NMFS Atlantic HMS Management Division)<br> Geret DePiper<br> Dan Dorfman (NOAA-NOS-NCCOS)<br> Emily Farr (NMFS Office of Habitat Conservation)<br> Michael Fogarty<br> Paula Fratantoni<br> Kevin Friedland<br> Marjy Friedrichs (VIMS)<br> Sarah Gaichas<br> Ben Galuardi (GARFO)<br> Avijit Gangopadhyay (School for Marine Science and Technology, University of Massachusetts Dartmouth)<br> James Gartland (Virginia Institute of Marine Science)<br> Glen Gawarkiewicz (Woods Hole Oceanographic Institution)<br> Sean Hardison<br> Kimberly Hyde<br> John Kosik<br> Steve Kress (National Audubon Society’s Seabird Restoration Program)<br> Young-Oh Kwon (Woods Hole Oceanographic Institute)<br> ] ] .pull-right[ .contrib[ Scott Large<br> Andrew Lipsky<br> Sean Lucey<br> Don Lyons (National Audubon Society’s Seabird Restoration Program)<br> Chris Melrose<br> Shannon Meseck<br> Ryan Morse<br> Brandon Muffley (MAFMC)<br> Kimberly Murray<br> Chris Orphanides<br> Richard Pace<br> Tom Parham (Maryland DNR) Charles Perretti<br> CJ Pellerin (NOAA Chesapeake Bay Office)<br> Grace Roskar (NMFS Office of Habitat Conservation)<br> Grace Saba (Rutgers)<br> Vincent Saba<br> Chris Schillaci (GARFO)<br> Dave Secor (CBL)<br> Angela Silva<br> Adrienne Silver (UMass/SMAST)<br> Emily Slesinger (Rutgers University)<br> Laurel Smith<br> Talya tenBrink (GARFO)<br> Bruce Vogt (NOAA Chesapeake Bay Office)<br> Ron Vogel (UMD Cooperative Institute for Satellite Earth System Studies and NOAA/NESDIS Center for Satellite Applications and Research)<br> John Walden<br> Harvey Walsh<br> Changhua Weng<br> Mark Wuenschel ] ] --- ## References .contrib[ <a name=bib-bastille_improving_2020></a>[Bastille, K. et al.](#cite-bastille_improving_2020) (2020). "Improving the IEA Approach Using Principles of Open Data Science". In: _Coastal Management_ 0.0. Publisher: Taylor & Francis \_ eprint: https://doi.org/10.1080/08920753.2021.1846155, pp. 1-18. ISSN: 0892-0753. DOI: [10.1080/08920753.2021.1846155](https://doi.org/10.1080%2F08920753.2021.1846155). URL: [https://doi.org/10.1080/08920753.2021.1846155](https://doi.org/10.1080/08920753.2021.1846155) (visited on Dec. 09, 2020). <a name=bib-depiper_operationalizing_2017></a>[DePiper, G. S. et al.](#cite-depiper_operationalizing_2017) (2017). "Operationalizing integrated ecosystem assessments within a multidisciplinary team: lessons learned from a worked example". En. In: _ICES Journal of Marine Science_ 74.8, pp. 2076-2086. ISSN: 1054-3139. DOI: [10.1093/icesjms/fsx038](https://doi.org/10.1093%2Ficesjms%2Ffsx038). URL: [https://academic.oup.com/icesjms/article/74/8/2076/3094701](https://academic.oup.com/icesjms/article/74/8/2076/3094701) (visited on Mar. 09, 2018). ] ## Additional resources .pull-left[ * [ecodata R package](https://github.com/noaa-edab/ecodata) * Visualizations: * [New England Human Dimensions indicators](http://noaa-edab.github.io/ecodata/human_dimensions_NE) * [New England Macrofauna indicators](http://noaa-edab.github.io/ecodata/macrofauna_NE) * [New England Lower trophic level indicators](https://noaa-edab.github.io/ecodata/LTL_NE) ] .pull-right[ * [SOE Technical Documentation](https://noaa-edab.github.io/tech-doc) * [Draft indicator catalog](https://noaa-edab.github.io/catalog/) .contrib[ * Slides available at https://noaa-edab.github.io/presentations * Contact: <Sean.Lucey@noaa.gov> ] ] --- background-image: url("EDAB_images/NEFMC-2022cover.png") background-size: 600px background-position: right # Discussion <br /> <br /> <br /> <br /> # Thank you! ]