class: right, middle, my-title, title-slide # Ecosystem reporting applications<br /> in fishery management: ## Examples from the Mid-Atlantic<br /> 04 August 2021 ### Sarah Gaichas<br /> Northeast Fisheries Science Center<br /> Brandon Muffley<br /> Mid-Atlantic Fishery Management Council<br /> <br /> Many thanks to:<br /> Kimberly Bastille, Geret DePiper, Kimberly Hyde, Scott Large, Sean Lucey,<br /> and all SOE contributors --- class: top, left ## Ecosystem reporting used in management processes .pull-left-60[ - Ecosystem reporting linked to management objectives + Open science emphasis <a name=cite-bastille_improving_2020></a>([Bastille, et al., 2020](https://doi.org/10.1080/08920753.2021.1846155)) + Report evolving since 2016 + Fishery-relevant subset of full Ecosystem Status Reports - Used within Mid-Atlantic Fishery Management Council's Ecosystem Process <a name=cite-muffley_there_2020></a>([Muffley, et al., 2020](https://doi.org/10.1080/08920753.2021.1846156)) + Risk assessment <a name=cite-gaichas_implementing_2018></a>([Gaichas, et al., 2018](https://www.frontiersin.org/articles/10.3389/fmars.2018.00442/abstract)) + Conceptual modeling <a name=cite-depiper_learning_2021></a>([DePiper, et al., 2021](https://doi.org/10.1093/icesjms/fsab054)) + Management strategy evaluation (MSE) in progress + Further operational use under discussion - Collaborative process key to getting information used ] .pull-right-40[  ] ??? an iterative, collaborative process has evolved to formulate ecosystem advice and to apply it in decision making --- background-image: url("EDAB_images/nes-components-abstracted.png") background-size: 700px background-position: right bottom ## State of the Ecosystem (SOE) Reporting: Context for busy people *"So what?" --John Boreman, September 2016* 1. Clear linkage of ecosystem indicators with management objectives 1. Synthesis across indicators for big picture 1. Objectives related to human-well being placed first in report 1. Short (< 30 pages), non-technical (but rigorous) text 1. Emphasis on reproducibility ??? In 2016, we began taking steps to address these common critiques of the ESR model Many indicators presented at WGNARS, used in larger Ecosystem Status reports Shorter, fishery specific State of the Ecosystem (SOE) report with conceptual models prototyped based on California Current reporting Feedback from fishery managers redesigned reporting to align with objectives outlined by WGNARS --- ## [2021 Report](https://doi.org/10.25923/jd1w-dc26): Summary .pull-left[ .center[  ] ] .pull-right[ .center[  ] ] ??? cover, 3 pager with visualizations, 34 pages of narrative/plots, 1 page contributors, 1 page orientation, 2 pages references --- ## Revised structure to address Council requests and improve synthesis .pull-left[ * Performance relative to management objectives - *What* does the indicator say--up, down, stable? - *Why* do we think it is changing: integrates synthesis themes - Multiple drivers - Regime shifts - Ecosystem reorganization * Objectives - Seafood production - Profits - Recreational opportunities - Stability - Social and cultural - Protected species ] .pull-right[ * Risks to meeting fishery management objectives - *What* does the indicator say--up, down, stable? - *Why* this is important to managers: integrates synthesis themes - Multiple drivers - Regime shifts - Ecosystem reorganization * Risk categories - Climate: warming, ocean currents, acidification - Habitat changes (incl. vulnerability analysis) - Productivity changes (system and fish) - Species interaction changes - Community structure changes - Other ocean uses - Offshore wind development ] --- ## The Mid-Atlantic Fishery Management Council (MAFMC) .pull-left-30[  ] .pull-right-70[  ] --- ## Mid-Atlantic Council Ecosystem Approach * 2016 Ecosystem Approach to Fishery Management (EAFM) Policy Guidance document: http://www.mafmc.org/s/EAFM-Doc-Revised-2019-02-08.pdf * Mid-Atlantic EAFM framework <a name=cite-gaichas_framework_2016></a>([Gaichas, et al., 2016](https://www.frontiersin.org/articles/10.3389/fmars.2016.00105/full)): .center[  ] ??? The Council’s EAFM framework has similarities to the IEA loop on slide 2. It uses risk assessment as a first step to prioritize combinations of managed species, fleets, and ecosystem interactions for consideration. Second, a conceptual model is developed identifying key environmental, ecological, social, economic, and management linkages for a high-priority fishery. Third, quantitative modeling addressing Council-specified questions and based on interactions identified in the conceptual model is applied to evaluate alternative management strategies that best balance management objectives. As strategies are implemented, outcomes are monitored and the process is adjusted, and/or another priority identified in risk assessment can be addressed. --- ## Iterative, collaborative development of the risk assessment .pull-left-40[ 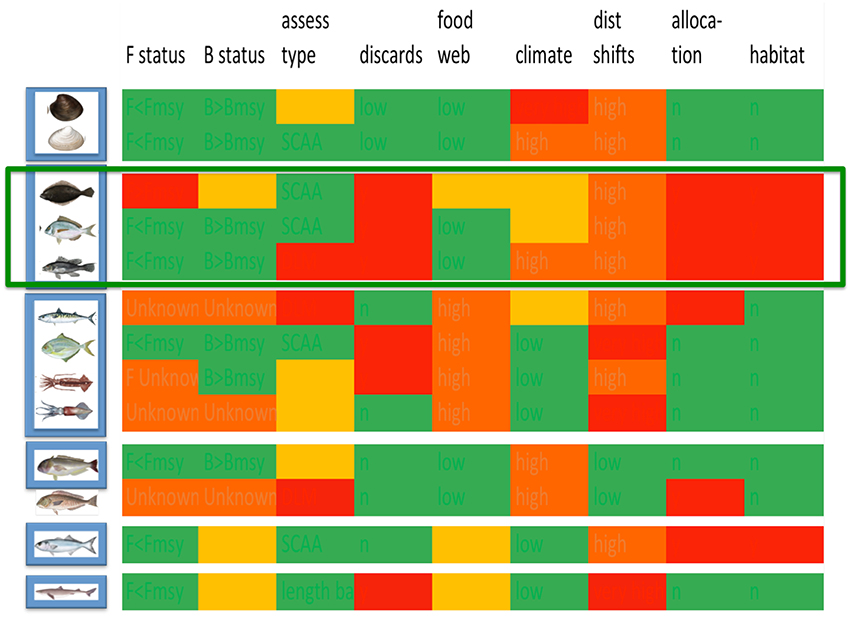 * Council staff and scientists create examples based on Council input ↑ ↓ ↑ ↓ ↑ ↓ ↑ ↓ ↑ ↓ ↑ ↓ ... * Council discusses, clarifies, revises with public input ] .pull-right-60[ <table class="table table-striped table-condensed" style="font-size: 11px; margin-left: auto; margin-right: auto;"> <thead> <tr> <th style="text-align:left;"> Element </th> <th style="text-align:left;"> Definition </th> <th style="text-align:left;"> Indicators </th> </tr> </thead> <tbody> <tr grouplength="4"><td colspan="3" style="border-bottom: 1px solid;"><strong>Economic</strong></td></tr> <tr> <td style="text-align:left;padding-left: 2em;" indentlevel="1"> Commercial Revenue </td> <td style="text-align:left;"> Risk of not maximizing fishery value </td> <td style="text-align:left;"> Revenue in aggregate </td> </tr> <tr> <td style="text-align:left;padding-left: 2em;" indentlevel="1"> Recreational Angler Days/Trips </td> <td style="text-align:left;"> Risk of not maximizing fishery value </td> <td style="text-align:left;"> Numbers of anglers and trips in aggregate </td> </tr> <tr> <td style="text-align:left;padding-left: 2em;" indentlevel="1"> Commercial Fishery Resilience (Revenue Diversity) </td> <td style="text-align:left;"> Risk of reduced fishery business resilience </td> <td style="text-align:left;"> Species diversity of revenue </td> </tr> <tr> <td style="text-align:left;padding-left: 2em;" indentlevel="1"> Commercial Fishery Resilience (Shoreside Support) </td> <td style="text-align:left;"> Risk of reduced fishery business resilience due to shoreside support infrastructure </td> <td style="text-align:left;"> Number of shoreside support businesses </td> </tr> <tr grouplength="2"><td colspan="3" style="border-bottom: 1px solid;"><strong>Social</strong></td></tr> <tr> <td style="text-align:left;padding-left: 2em;" indentlevel="1"> Fleet Resilience </td> <td style="text-align:left;"> Risk of reduced fishery resilience </td> <td style="text-align:left;"> Number of fleets, fleet diversity </td> </tr> <tr> <td style="text-align:left;padding-left: 2em;" indentlevel="1"> Social-Cultural </td> <td style="text-align:left;"> Risk of reduced community resilience </td> <td style="text-align:left;"> Community vulnerability, fishery engagement and reliance </td> </tr> <tr grouplength="2"><td colspan="3" style="border-bottom: 1px solid;"><strong>Food Production</strong></td></tr> <tr> <td style="text-align:left;padding-left: 2em;" indentlevel="1"> Commercial </td> <td style="text-align:left;"> Risk of not optimizing seafood production </td> <td style="text-align:left;"> Seafood landings in aggregate </td> </tr> <tr> <td style="text-align:left;padding-left: 2em;" indentlevel="1"> Recreational </td> <td style="text-align:left;"> Risk of not maintaining personal food production </td> <td style="text-align:left;"> Recreational landings in aggregate </td> </tr> </tbody> </table> ] --- ## Risk elements: Management <table class="table table-striped table-condensed" style="font-size: 14px; margin-left: auto; margin-right: auto;"> <thead> <tr> <th style="text-align:left;"> Element </th> <th style="text-align:left;"> Definition </th> <th style="text-align:left;"> Indicators </th> </tr> </thead> <tbody> <tr grouplength="6"><td colspan="3" style="border-bottom: 1px solid;"><strong>Management</strong></td></tr> <tr> <td style="text-align:left;padding-left: 2em;" indentlevel="1"> Control </td> <td style="text-align:left;"> Risk of not achieving OY due to inadequate control </td> <td style="text-align:left;"> Catch compared to allocation </td> </tr> <tr> <td style="text-align:left;padding-left: 2em;" indentlevel="1"> Interactions </td> <td style="text-align:left;"> Risk of not achieving OY due to interactions with species managed by other entities </td> <td style="text-align:left;"> Number and type of interactions with protected or non-MAFMC managed species, co-management </td> </tr> <tr> <td style="text-align:left;padding-left: 2em;" indentlevel="1"> Other ocean uses </td> <td style="text-align:left;"> Risk of not achieving OY due to other human uses </td> <td style="text-align:left;"> Fishery overlap with energy/mining areas </td> </tr> <tr> <td style="text-align:left;padding-left: 2em;" indentlevel="1"> Regulatory complexity </td> <td style="text-align:left;"> Risk of not achieving compliance due to complexity </td> <td style="text-align:left;"> Number of regulations by species </td> </tr> <tr> <td style="text-align:left;padding-left: 2em;" indentlevel="1"> Discards </td> <td style="text-align:left;"> Risk of not minimizing bycatch to extent practicable </td> <td style="text-align:left;"> Standardized Bycatch Reporting </td> </tr> <tr> <td style="text-align:left;padding-left: 2em;" indentlevel="1"> Allocation </td> <td style="text-align:left;"> Risk of not achieving OY due to spatial mismatch of stocks and management </td> <td style="text-align:left;"> Distribution shifts + number of interests </td> </tr> </tbody> </table> --- ## State of the Ecosystem → Risk assessent example: Commercial revenue This element is applied at the ecosystem level. Revenue serves as a proxy for commercial profits. .table[ .pull-left[ <table> <thead> <tr> <th style="text-align:left;"> Risk Level </th> <th style="text-align:left;"> Definition </th> </tr> </thead> <tbody> <tr> <td style="text-align:left;width: 20em; "> Low </td> <td style="text-align:left;width: 20em; "> No trend and low variability in revenue </td> </tr> <tr> <td style="text-align:left;width: 20em; "> Low-Moderate </td> <td style="text-align:left;width: 20em; "> Increasing or high variability in revenue </td> </tr> <tr> <td style="text-align:left;width: 20em; font-weight: bold;background-color: orange !important;"> Moderate-High </td> <td style="text-align:left;width: 20em; font-weight: bold;background-color: orange !important;"> Significant long term revenue decrease </td> </tr> <tr> <td style="text-align:left;width: 20em; "> High </td> <td style="text-align:left;width: 20em; "> Significant recent decrease in revenue </td> </tr> </tbody> </table> Ranked moderate-high risk due to the significant long term revenue decrease for Mid-Atlantic managed species (red points in top plot) ] ] .pull-right[ <img src="20210804_ESR_Risk_Gaichas_files/figure-html/unnamed-chunk-5-1.png" width="504" style="display: block; margin: auto;" /> Key: Black = Revenue of all species combined; <p style="color:#FF6A6A;">Red = Revenue of MAFMC managed species</p> ] -- ## Risk element: <span style="background-color:orange;">CommRev</span>, unchanged --- # Performance relative to management objectives .center[      ] --- ## Objective: Seafood production     Risk elements: <span style="background-color:red;">ComFood</span> and <span style="background-color:orange;">RecFood</span>, unchanged .pull-left[ Indicators: Commercial and recreational landings <img src="20210804_ESR_Risk_Gaichas_files/figure-html/unnamed-chunk-6-1.png" width="504" style="display: block; margin: auto;" /> .contrib[ Key: Black = Landings of all species combined; <p style="color:#FF6A6A;">Red = Landings of MAFMC managed species</p> ] <img src="20210804_ESR_Risk_Gaichas_files/figure-html/unnamed-chunk-7-1.png" width="504" style="display: block; margin: auto;" /> ] .pull-right[ Multiple drivers: ecosystem and stock production, management, market conditions, and environment Is biomass driving? <img src="20210804_ESR_Risk_Gaichas_files/figure-html/unnamed-chunk-8-1.png" width="576" style="display: block; margin: auto;" /> .contrib[ Key: Black = NEFSC survey; <p style="color:#FF6A6A;">Red = NEAMAP survey</p> ] ] --- ## Landings drivers: Ecosystem or stock production?   Risk elements: Fstatus, Bstatus mostly unchanged .pull-left[ <img src="20210804_ESR_Risk_Gaichas_files/figure-html/unnamed-chunk-9-1.png" width="504" style="display: block; margin: auto;" /> <img src="20210804_ESR_Risk_Gaichas_files/figure-html/unnamed-chunk-10-1.png" width="504" style="display: block; margin: auto;" /> .contrib[ Key: <span style="background-color:#f4a460;">Orange background = Tipping point overfishing threshold, Link and Watson 2019</span> <span style="background-color:#a2cd5a;">Green background = Optimal range, Link and Watson 2019</span> ] ] .pull-right[ <img src="20210804_ESR_Risk_Gaichas_files/figure-html/unnamed-chunk-11-1.png" width="504" style="display: block; margin: auto;" /> One change: <span style="background-color:yellow;">Butterfish Bstatus</span> <img src="20210804_ESR_Risk_Gaichas_files/figure-html/unnamed-chunk-12-1.png" width="540" style="display: block; margin: auto;" /> ] --- ## Implications: Seafood Production .pull-left[ <img src="20210804_ESR_Risk_Gaichas_files/figure-html/unnamed-chunk-15-1.png" width="360" style="display: block; margin: auto;" /> .contrib[ Key: Black = Landings of all species combined; <p style="color:#FF6A6A;">Red = Landings of MAFMC managed species</p> ] ] .pull-right[ Drivers: * market dynamics affecting commercial landings of surfclams and ocean quahogs * other drivers affecting recreational landings: shark fishery management, possibly survey methodology <img src="20210804_ESR_Risk_Gaichas_files/figure-html/unnamed-chunk-16-1.png" width="360" style="display: block; margin: auto;" /> Monitor: * climate risks including warming, ocean acidification, and shifting distributions * ecosystem composition and production changes * fishing engagement ] ??? Because ecosystem overfishing seems unlikely, stock status is mostly acceptable, and aggregate biomass trends appear stable, the decline in commercial landings is most likely driven by market dynamics affecting the landings of surfclams and ocean quahogs, as quotas are not binding for these species. Climate change also seems to be shifting the distribution of surfclams and ocean quahogs, resulting in areas with overlapping distributions and increased mixed landings. Given the regulations governing mixed landings, this could become problematic in the future and is currently being evaluated by the Council. --- # Risks to meeting fishery management objectives .center[   ] .center[      ] --- ## EAFM Risk Assessment: 2021 Update .pull-left[ *Species level risk elements* <table class="risktable table" style="font-size: 9px; margin-left: auto; margin-right: auto;"> <thead> <tr> <th style="text-align:left;"> Species </th> <th style="text-align:left;"> Assess </th> <th style="text-align:left;"> Fstatus </th> <th style="text-align:left;"> Bstatus </th> <th style="text-align:left;"> FW1Pred </th> <th style="text-align:left;"> FW1Prey </th> <th style="text-align:left;"> FW2Prey </th> <th style="text-align:left;"> Climate </th> <th style="text-align:left;"> DistShift </th> <th style="text-align:left;"> EstHabitat </th> </tr> </thead> <tbody> <tr> <td style="text-align:left;"> Ocean Quahog </td> <td style="text-align:left;"> <span style=" color: black !important;padding-right: 4px; padding-left: 4px; background-color: lightgreen !important;text-align: c;">lowest</span> </td> <td style="text-align:left;"> <span style=" color: black !important;padding-right: 4px; padding-left: 4px; background-color: lightgreen !important;text-align: c;">lowest</span> </td> <td style="text-align:left;"> <span style=" color: black !important;padding-right: 4px; padding-left: 4px; background-color: lightgreen !important;text-align: c;">lowest</span> </td> <td style="text-align:left;"> <span style=" color: black !important;padding-right: 4px; padding-left: 4px; background-color: lightgreen !important;text-align: c;">lowest</span> </td> <td style="text-align:left;"> <span style=" color: black !important;padding-right: 4px; padding-left: 4px; background-color: lightgreen !important;text-align: c;">lowest</span> </td> <td style="text-align:left;"> <span style=" color: black !important;padding-right: 4px; padding-left: 4px; background-color: lightgreen !important;text-align: c;">lowest</span> </td> <td style="text-align:left;"> <span style=" color: white !important;padding-right: 4px; padding-left: 4px; background-color: red !important;text-align: c;">highest</span> </td> <td style="text-align:left;"> <span style=" color: black !important;padding-right: 4px; padding-left: 4px; background-color: orange !important;text-align: c;">modhigh</span> </td> <td style="text-align:left;"> <span style=" color: black !important;padding-right: 4px; padding-left: 4px; background-color: lightgreen !important;text-align: c;">lowest</span> </td> </tr> <tr> <td style="text-align:left;"> Surfclam </td> <td style="text-align:left;"> <span style=" color: black !important;padding-right: 4px; padding-left: 4px; background-color: lightgreen !important;text-align: c;">lowest</span> </td> <td style="text-align:left;"> <span style=" color: black !important;padding-right: 4px; padding-left: 4px; background-color: lightgreen !important;text-align: c;">lowest</span> </td> <td style="text-align:left;"> <span style=" color: black !important;padding-right: 4px; padding-left: 4px; background-color: lightgreen !important;text-align: c;">lowest</span> </td> <td style="text-align:left;"> <span style=" color: black !important;padding-right: 4px; padding-left: 4px; background-color: lightgreen !important;text-align: c;">lowest</span> </td> <td style="text-align:left;"> <span style=" color: black !important;padding-right: 4px; padding-left: 4px; background-color: lightgreen !important;text-align: c;">lowest</span> </td> <td style="text-align:left;"> <span style=" color: black !important;padding-right: 4px; padding-left: 4px; background-color: lightgreen !important;text-align: c;">lowest</span> </td> <td style="text-align:left;"> <span style=" color: black !important;padding-right: 4px; padding-left: 4px; background-color: orange !important;text-align: c;">modhigh</span> </td> <td style="text-align:left;"> <span style=" color: black !important;padding-right: 4px; padding-left: 4px; background-color: orange !important;text-align: c;">modhigh</span> </td> <td style="text-align:left;"> <span style=" color: black !important;padding-right: 4px; padding-left: 4px; background-color: lightgreen !important;text-align: c;">lowest</span> </td> </tr> <tr> <td style="text-align:left;"> Summer flounder </td> <td style="text-align:left;"> <span style=" color: black !important;padding-right: 4px; padding-left: 4px; background-color: lightgreen !important;text-align: c;">lowest</span> </td> <td style="text-align:left;"> <span style=" color: black !important;padding-right: 4px; padding-left: 4px; background-color: lightgreen !important;text-align: c;">lowest</span> </td> <td style="text-align:left;"> <span style=" color: black !important;padding-right: 4px; padding-left: 4px; background-color: yellow !important;text-align: c;">lowmod</span> </td> <td style="text-align:left;"> <span style=" color: black !important;padding-right: 4px; padding-left: 4px; background-color: lightgreen !important;text-align: c;">lowest</span> </td> <td style="text-align:left;"> <span style=" color: black !important;padding-right: 4px; padding-left: 4px; background-color: lightgreen !important;text-align: c;">lowest</span> </td> <td style="text-align:left;"> <span style=" color: black !important;padding-right: 4px; padding-left: 4px; background-color: lightgreen !important;text-align: c;">lowest</span> </td> <td style="text-align:left;"> <span style=" color: black !important;padding-right: 4px; padding-left: 4px; background-color: yellow !important;text-align: c;">lowmod</span> </td> <td style="text-align:left;"> <span style=" color: black !important;padding-right: 4px; padding-left: 4px; background-color: orange !important;text-align: c;">modhigh</span> </td> <td style="text-align:left;"> <span style=" color: white !important;padding-right: 4px; padding-left: 4px; background-color: red !important;text-align: c;">highest</span> </td> </tr> <tr> <td style="text-align:left;"> Scup </td> <td style="text-align:left;"> <span style=" color: black !important;padding-right: 4px; padding-left: 4px; background-color: lightgreen !important;text-align: c;">lowest</span> </td> <td style="text-align:left;"> <span style=" color: black !important;padding-right: 4px; padding-left: 4px; background-color: lightgreen !important;text-align: c;">lowest</span> </td> <td style="text-align:left;"> <span style=" color: black !important;padding-right: 4px; padding-left: 4px; background-color: lightgreen !important;text-align: c;">lowest</span> </td> <td style="text-align:left;"> <span style=" color: black !important;padding-right: 4px; padding-left: 4px; background-color: lightgreen !important;text-align: c;">lowest</span> </td> <td style="text-align:left;"> <span style=" color: black !important;padding-right: 4px; padding-left: 4px; background-color: lightgreen !important;text-align: c;">lowest</span> </td> <td style="text-align:left;"> <span style=" color: black !important;padding-right: 4px; padding-left: 4px; background-color: lightgreen !important;text-align: c;">lowest</span> </td> <td style="text-align:left;"> <span style=" color: black !important;padding-right: 4px; padding-left: 4px; background-color: yellow !important;text-align: c;">lowmod</span> </td> <td style="text-align:left;"> <span style=" color: black !important;padding-right: 4px; padding-left: 4px; background-color: orange !important;text-align: c;">modhigh</span> </td> <td style="text-align:left;"> <span style=" color: white !important;padding-right: 4px; padding-left: 4px; background-color: red !important;text-align: c;">highest</span> </td> </tr> <tr> <td style="text-align:left;"> Black sea bass </td> <td style="text-align:left;"> <span style=" color: black !important;padding-right: 4px; padding-left: 4px; background-color: lightgreen !important;text-align: c;">lowest</span> </td> <td style="text-align:left;"> <span style=" color: black !important;padding-right: 4px; padding-left: 4px; background-color: lightgreen !important;text-align: c;">lowest</span> </td> <td style="text-align:left;"> <span style=" color: black !important;padding-right: 4px; padding-left: 4px; background-color: lightgreen !important;text-align: c;">lowest</span> </td> <td style="text-align:left;"> <span style=" color: black !important;padding-right: 4px; padding-left: 4px; background-color: lightgreen !important;text-align: c;">lowest</span> </td> <td style="text-align:left;"> <span style=" color: black !important;padding-right: 4px; padding-left: 4px; background-color: lightgreen !important;text-align: c;">lowest</span> </td> <td style="text-align:left;"> <span style=" color: black !important;padding-right: 4px; padding-left: 4px; background-color: lightgreen !important;text-align: c;">lowest</span> </td> <td style="text-align:left;"> <span style=" color: black !important;padding-right: 4px; padding-left: 4px; background-color: orange !important;text-align: c;">modhigh</span> </td> <td style="text-align:left;"> <span style=" color: black !important;padding-right: 4px; padding-left: 4px; background-color: orange !important;text-align: c;">modhigh</span> </td> <td style="text-align:left;"> <span style=" color: white !important;padding-right: 4px; padding-left: 4px; background-color: red !important;text-align: c;">highest</span> </td> </tr> <tr> <td style="text-align:left;"> Atl. mackerel </td> <td style="text-align:left;"> <span style=" color: black !important;padding-right: 4px; padding-left: 4px; background-color: lightgreen !important;text-align: c;">lowest</span> </td> <td style="text-align:left;"> <span style=" color: white !important;padding-right: 4px; padding-left: 4px; background-color: red !important;text-align: c;">highest</span> </td> <td style="text-align:left;"> <span style=" color: white !important;padding-right: 4px; padding-left: 4px; background-color: red !important;text-align: c;">highest</span> </td> <td style="text-align:left;"> <span style=" color: black !important;padding-right: 4px; padding-left: 4px; background-color: lightgreen !important;text-align: c;">lowest</span> </td> <td style="text-align:left;"> <span style=" color: black !important;padding-right: 4px; padding-left: 4px; background-color: lightgreen !important;text-align: c;">lowest</span> </td> <td style="text-align:left;"> <span style=" color: black !important;padding-right: 4px; padding-left: 4px; background-color: lightgreen !important;text-align: c;">lowest</span> </td> <td style="text-align:left;"> <span style=" color: black !important;padding-right: 4px; padding-left: 4px; background-color: yellow !important;text-align: c;">lowmod</span> </td> <td style="text-align:left;"> <span style=" color: black !important;padding-right: 4px; padding-left: 4px; background-color: orange !important;text-align: c;">modhigh</span> </td> <td style="text-align:left;"> <span style=" color: black !important;padding-right: 4px; padding-left: 4px; background-color: lightgreen !important;text-align: c;">lowest</span> </td> </tr> <tr> <td style="text-align:left;"> Butterfish </td> <td style="text-align:left;"> <span style=" color: black !important;padding-right: 4px; padding-left: 4px; background-color: lightgreen !important;text-align: c;">lowest</span> </td> <td style="text-align:left;"> <span style=" color: black !important;padding-right: 4px; padding-left: 4px; background-color: lightgreen !important;text-align: c;">lowest</span> </td> <td style="text-align:left;"> <span style=" color: black !important;padding-right: 4px; padding-left: 4px; background-color: yellow !important;text-align: c;">lowmod</span> </td> <td style="text-align:left;"> <span style=" color: black !important;padding-right: 4px; padding-left: 4px; background-color: lightgreen !important;text-align: c;">lowest</span> </td> <td style="text-align:left;"> <span style=" color: black !important;padding-right: 4px; padding-left: 4px; background-color: lightgreen !important;text-align: c;">lowest</span> </td> <td style="text-align:left;"> <span style=" color: black !important;padding-right: 4px; padding-left: 4px; background-color: lightgreen !important;text-align: c;">lowest</span> </td> <td style="text-align:left;"> <span style=" color: black !important;padding-right: 4px; padding-left: 4px; background-color: lightgreen !important;text-align: c;">lowest</span> </td> <td style="text-align:left;"> <span style=" color: white !important;padding-right: 4px; padding-left: 4px; background-color: red !important;text-align: c;">highest</span> </td> <td style="text-align:left;"> <span style=" color: black !important;padding-right: 4px; padding-left: 4px; background-color: lightgreen !important;text-align: c;">lowest</span> </td> </tr> <tr> <td style="text-align:left;"> Longfin squid </td> <td style="text-align:left;"> <span style=" color: black !important;padding-right: 4px; padding-left: 4px; background-color: yellow !important;text-align: c;">lowmod</span> </td> <td style="text-align:left;"> <span style=" color: black !important;padding-right: 4px; padding-left: 4px; background-color: yellow !important;text-align: c;">lowmod</span> </td> <td style="text-align:left;"> <span style=" color: black !important;padding-right: 4px; padding-left: 4px; background-color: yellow !important;text-align: c;">lowmod</span> </td> <td style="text-align:left;"> <span style=" color: black !important;padding-right: 4px; padding-left: 4px; background-color: lightgreen !important;text-align: c;">lowest</span> </td> <td style="text-align:left;"> <span style=" color: black !important;padding-right: 4px; padding-left: 4px; background-color: lightgreen !important;text-align: c;">lowest</span> </td> <td style="text-align:left;"> <span style=" color: black !important;padding-right: 4px; padding-left: 4px; background-color: yellow !important;text-align: c;">lowmod</span> </td> <td style="text-align:left;"> <span style=" color: black !important;padding-right: 4px; padding-left: 4px; background-color: lightgreen !important;text-align: c;">lowest</span> </td> <td style="text-align:left;"> <span style=" color: black !important;padding-right: 4px; padding-left: 4px; background-color: orange !important;text-align: c;">modhigh</span> </td> <td style="text-align:left;"> <span style=" color: black !important;padding-right: 4px; padding-left: 4px; background-color: lightgreen !important;text-align: c;">lowest</span> </td> </tr> <tr> <td style="text-align:left;"> Shortfin squid </td> <td style="text-align:left;"> <span style=" color: black !important;padding-right: 4px; padding-left: 4px; background-color: yellow !important;text-align: c;">lowmod</span> </td> <td style="text-align:left;"> <span style=" color: black !important;padding-right: 4px; padding-left: 4px; background-color: yellow !important;text-align: c;">lowmod</span> </td> <td style="text-align:left;"> <span style=" color: black !important;padding-right: 4px; padding-left: 4px; background-color: yellow !important;text-align: c;">lowmod</span> </td> <td style="text-align:left;"> <span style=" color: black !important;padding-right: 4px; padding-left: 4px; background-color: lightgreen !important;text-align: c;">lowest</span> </td> <td style="text-align:left;"> <span style=" color: black !important;padding-right: 4px; padding-left: 4px; background-color: lightgreen !important;text-align: c;">lowest</span> </td> <td style="text-align:left;"> <span style=" color: black !important;padding-right: 4px; padding-left: 4px; background-color: yellow !important;text-align: c;">lowmod</span> </td> <td style="text-align:left;"> <span style=" color: black !important;padding-right: 4px; padding-left: 4px; background-color: lightgreen !important;text-align: c;">lowest</span> </td> <td style="text-align:left;"> <span style=" color: white !important;padding-right: 4px; padding-left: 4px; background-color: red !important;text-align: c;">highest</span> </td> <td style="text-align:left;"> <span style=" color: black !important;padding-right: 4px; padding-left: 4px; background-color: lightgreen !important;text-align: c;">lowest</span> </td> </tr> <tr> <td style="text-align:left;"> Golden tilefish </td> <td style="text-align:left;"> <span style=" color: black !important;padding-right: 4px; padding-left: 4px; background-color: lightgreen !important;text-align: c;">lowest</span> </td> <td style="text-align:left;"> <span style=" color: black !important;padding-right: 4px; padding-left: 4px; background-color: lightgreen !important;text-align: c;">lowest</span> </td> <td style="text-align:left;"> <span style=" color: black !important;padding-right: 4px; padding-left: 4px; background-color: yellow !important;text-align: c;">lowmod</span> </td> <td style="text-align:left;"> <span style=" color: black !important;padding-right: 4px; padding-left: 4px; background-color: lightgreen !important;text-align: c;">lowest</span> </td> <td style="text-align:left;"> <span style=" color: black !important;padding-right: 4px; padding-left: 4px; background-color: lightgreen !important;text-align: c;">lowest</span> </td> <td style="text-align:left;"> <span style=" color: black !important;padding-right: 4px; padding-left: 4px; background-color: lightgreen !important;text-align: c;">lowest</span> </td> <td style="text-align:left;"> <span style=" color: black !important;padding-right: 4px; padding-left: 4px; background-color: orange !important;text-align: c;">modhigh</span> </td> <td style="text-align:left;"> <span style=" color: black !important;padding-right: 4px; padding-left: 4px; background-color: lightgreen !important;text-align: c;">lowest</span> </td> <td style="text-align:left;"> <span style=" color: black !important;padding-right: 4px; padding-left: 4px; background-color: lightgreen !important;text-align: c;">lowest</span> </td> </tr> <tr> <td style="text-align:left;"> Blueline tilefish </td> <td style="text-align:left;"> <span style=" color: white !important;padding-right: 4px; padding-left: 4px; background-color: red !important;text-align: c;">highest</span> </td> <td style="text-align:left;"> <span style=" color: white !important;padding-right: 4px; padding-left: 4px; background-color: red !important;text-align: c;">highest</span> </td> <td style="text-align:left;"> <span style=" color: black !important;padding-right: 4px; padding-left: 4px; background-color: orange !important;text-align: c;">modhigh</span> </td> <td style="text-align:left;"> <span style=" color: black !important;padding-right: 4px; padding-left: 4px; background-color: lightgreen !important;text-align: c;">lowest</span> </td> <td style="text-align:left;"> <span style=" color: black !important;padding-right: 4px; padding-left: 4px; background-color: lightgreen !important;text-align: c;">lowest</span> </td> <td style="text-align:left;"> <span style=" color: black !important;padding-right: 4px; padding-left: 4px; background-color: lightgreen !important;text-align: c;">lowest</span> </td> <td style="text-align:left;"> <span style=" color: black !important;padding-right: 4px; padding-left: 4px; background-color: orange !important;text-align: c;">modhigh</span> </td> <td style="text-align:left;"> <span style=" color: black !important;padding-right: 4px; padding-left: 4px; background-color: lightgreen !important;text-align: c;">lowest</span> </td> <td style="text-align:left;"> <span style=" color: black !important;padding-right: 4px; padding-left: 4px; background-color: lightgreen !important;text-align: c;">lowest</span> </td> </tr> <tr> <td style="text-align:left;"> Bluefish </td> <td style="text-align:left;"> <span style=" color: black !important;padding-right: 4px; padding-left: 4px; background-color: lightgreen !important;text-align: c;">lowest</span> </td> <td style="text-align:left;"> <span style=" color: black !important;padding-right: 4px; padding-left: 4px; background-color: lightgreen !important;text-align: c;">lowest</span> </td> <td style="text-align:left;"> <span style=" color: white !important;padding-right: 4px; padding-left: 4px; background-color: red !important;text-align: c;">highest</span> </td> <td style="text-align:left;"> <span style=" color: black !important;padding-right: 4px; padding-left: 4px; background-color: lightgreen !important;text-align: c;">lowest</span> </td> <td style="text-align:left;"> <span style=" color: black !important;padding-right: 4px; padding-left: 4px; background-color: lightgreen !important;text-align: c;">lowest</span> </td> <td style="text-align:left;"> <span style=" color: black !important;padding-right: 4px; padding-left: 4px; background-color: lightgreen !important;text-align: c;">lowest</span> </td> <td style="text-align:left;"> <span style=" color: black !important;padding-right: 4px; padding-left: 4px; background-color: lightgreen !important;text-align: c;">lowest</span> </td> <td style="text-align:left;"> <span style=" color: black !important;padding-right: 4px; padding-left: 4px; background-color: orange !important;text-align: c;">modhigh</span> </td> <td style="text-align:left;"> <span style=" color: white !important;padding-right: 4px; padding-left: 4px; background-color: red !important;text-align: c;">highest</span> </td> </tr> <tr> <td style="text-align:left;"> Spiny dogfish </td> <td style="text-align:left;"> <span style=" color: black !important;padding-right: 4px; padding-left: 4px; background-color: yellow !important;text-align: c;">lowmod</span> </td> <td style="text-align:left;"> <span style=" color: black !important;padding-right: 4px; padding-left: 4px; background-color: lightgreen !important;text-align: c;">lowest</span> </td> <td style="text-align:left;"> <span style=" color: black !important;padding-right: 4px; padding-left: 4px; background-color: yellow !important;text-align: c;">lowmod</span> </td> <td style="text-align:left;"> <span style=" color: black !important;padding-right: 4px; padding-left: 4px; background-color: lightgreen !important;text-align: c;">lowest</span> </td> <td style="text-align:left;"> <span style=" color: black !important;padding-right: 4px; padding-left: 4px; background-color: lightgreen !important;text-align: c;">lowest</span> </td> <td style="text-align:left;"> <span style=" color: black !important;padding-right: 4px; padding-left: 4px; background-color: lightgreen !important;text-align: c;">lowest</span> </td> <td style="text-align:left;"> <span style=" color: black !important;padding-right: 4px; padding-left: 4px; background-color: lightgreen !important;text-align: c;">lowest</span> </td> <td style="text-align:left;"> <span style=" color: white !important;padding-right: 4px; padding-left: 4px; background-color: red !important;text-align: c;">highest</span> </td> <td style="text-align:left;"> <span style=" color: black !important;padding-right: 4px; padding-left: 4px; background-color: lightgreen !important;text-align: c;">lowest</span> </td> </tr> <tr> <td style="text-align:left;"> Monkfish </td> <td style="text-align:left;"> <span style=" color: white !important;padding-right: 4px; padding-left: 4px; background-color: red !important;text-align: c;">highest</span> </td> <td style="text-align:left;"> <span style=" color: black !important;padding-right: 4px; padding-left: 4px; background-color: yellow !important;text-align: c;">lowmod</span> </td> <td style="text-align:left;"> <span style=" color: black !important;padding-right: 4px; padding-left: 4px; background-color: yellow !important;text-align: c;">lowmod</span> </td> <td style="text-align:left;"> <span style=" color: black !important;padding-right: 4px; padding-left: 4px; background-color: lightgreen !important;text-align: c;">lowest</span> </td> <td style="text-align:left;"> <span style=" color: black !important;padding-right: 4px; padding-left: 4px; background-color: lightgreen !important;text-align: c;">lowest</span> </td> <td style="text-align:left;"> <span style=" color: black !important;padding-right: 4px; padding-left: 4px; background-color: lightgreen !important;text-align: c;">lowest</span> </td> <td style="text-align:left;"> <span style=" color: black !important;padding-right: 4px; padding-left: 4px; background-color: lightgreen !important;text-align: c;">lowest</span> </td> <td style="text-align:left;"> <span style=" color: black !important;padding-right: 4px; padding-left: 4px; background-color: orange !important;text-align: c;">modhigh</span> </td> <td style="text-align:left;"> <span style=" color: black !important;padding-right: 4px; padding-left: 4px; background-color: lightgreen !important;text-align: c;">lowest</span> </td> </tr> <tr> <td style="text-align:left;"> Unmanaged forage </td> <td style="text-align:left;"> <span style=" color: black !important;padding-right: 4px; padding-left: 4px; background-color: white !important;text-align: c;">na</span> </td> <td style="text-align:left;"> <span style=" color: black !important;padding-right: 4px; padding-left: 4px; background-color: white !important;text-align: c;">na</span> </td> <td style="text-align:left;"> <span style=" color: black !important;padding-right: 4px; padding-left: 4px; background-color: white !important;text-align: c;">na</span> </td> <td style="text-align:left;"> <span style=" color: black !important;padding-right: 4px; padding-left: 4px; background-color: lightgreen !important;text-align: c;">lowest</span> </td> <td style="text-align:left;"> <span style=" color: black !important;padding-right: 4px; padding-left: 4px; background-color: yellow !important;text-align: c;">lowmod</span> </td> <td style="text-align:left;"> <span style=" color: black !important;padding-right: 4px; padding-left: 4px; background-color: yellow !important;text-align: c;">lowmod</span> </td> <td style="text-align:left;"> <span style=" color: black !important;padding-right: 4px; padding-left: 4px; background-color: white !important;text-align: c;">na</span> </td> <td style="text-align:left;"> <span style=" color: black !important;padding-right: 4px; padding-left: 4px; background-color: white !important;text-align: c;">na</span> </td> <td style="text-align:left;"> <span style=" color: black !important;padding-right: 4px; padding-left: 4px; background-color: white !important;text-align: c;">na</span> </td> </tr> <tr> <td style="text-align:left;"> Deepsea corals </td> <td style="text-align:left;"> <span style=" color: black !important;padding-right: 4px; padding-left: 4px; background-color: white !important;text-align: c;">na</span> </td> <td style="text-align:left;"> <span style=" color: black !important;padding-right: 4px; padding-left: 4px; background-color: white !important;text-align: c;">na</span> </td> <td style="text-align:left;"> <span style=" color: black !important;padding-right: 4px; padding-left: 4px; background-color: white !important;text-align: c;">na</span> </td> <td style="text-align:left;"> <span style=" color: black !important;padding-right: 4px; padding-left: 4px; background-color: lightgreen !important;text-align: c;">lowest</span> </td> <td style="text-align:left;"> <span style=" color: black !important;padding-right: 4px; padding-left: 4px; background-color: lightgreen !important;text-align: c;">lowest</span> </td> <td style="text-align:left;"> <span style=" color: black !important;padding-right: 4px; padding-left: 4px; background-color: lightgreen !important;text-align: c;">lowest</span> </td> <td style="text-align:left;"> <span style=" color: black !important;padding-right: 4px; padding-left: 4px; background-color: white !important;text-align: c;">na</span> </td> <td style="text-align:left;"> <span style=" color: black !important;padding-right: 4px; padding-left: 4px; background-color: white !important;text-align: c;">na</span> </td> <td style="text-align:left;"> <span style=" color: black !important;padding-right: 4px; padding-left: 4px; background-color: white !important;text-align: c;">na</span> </td> </tr> </tbody> </table> .contrib[ * Butterfish B status risk increased from lowest to low-mod (below Bmsy) ] *Ecosystem level risk elements* <table class="risktable table" style="font-size: 9px; margin-left: auto; margin-right: auto;"> <thead> <tr> <th style="text-align:left;"> System </th> <th style="text-align:left;"> EcoProd </th> <th style="text-align:left;"> CommRev </th> <th style="text-align:left;"> RecVal </th> <th style="text-align:left;"> FishRes1 </th> <th style="text-align:left;"> FishRes4 </th> <th style="text-align:left;"> FleetDiv </th> <th style="text-align:left;"> Social </th> <th style="text-align:left;"> ComFood </th> <th style="text-align:left;"> RecFood </th> </tr> </thead> <tbody> <tr> <td style="text-align:left;"> Mid-Atlantic </td> <td style="text-align:left;"> <span style=" color: black !important;padding-right: 4px; padding-left: 4px; background-color: yellow !important;text-align: c;">lowmod</span> </td> <td style="text-align:left;"> <span style=" color: black !important;padding-right: 4px; padding-left: 4px; background-color: orange !important;text-align: c;">modhigh</span> </td> <td style="text-align:left;"> <span style=" color: white !important;padding-right: 4px; padding-left: 4px; background-color: red !important;text-align: c;">highest</span> </td> <td style="text-align:left;"> <span style=" color: black !important;padding-right: 4px; padding-left: 4px; background-color: lightgreen !important;text-align: c;">lowest</span> </td> <td style="text-align:left;"> <span style=" color: black !important;padding-right: 4px; padding-left: 4px; background-color: orange !important;text-align: c;">modhigh</span> </td> <td style="text-align:left;"> <span style=" color: black !important;padding-right: 4px; padding-left: 4px; background-color: lightgreen !important;text-align: c;">lowest</span> </td> <td style="text-align:left;"> <span style=" color: black !important;padding-right: 4px; padding-left: 4px; background-color: yellow !important;text-align: c;">lowmod</span> </td> <td style="text-align:left;"> <span style=" color: white !important;padding-right: 4px; padding-left: 4px; background-color: red !important;text-align: c;">highest</span> </td> <td style="text-align:left;"> <span style=" color: black !important;padding-right: 4px; padding-left: 4px; background-color: orange !important;text-align: c;">modhigh</span> </td> </tr> </tbody> </table> ] .pull-right[ *Species and Sector level risk elements* <table class="risktable table" style="font-size: 11px; margin-left: auto; margin-right: auto;"> <thead> <tr> <th style="text-align:left;"> Species </th> <th style="text-align:left;"> MgtControl </th> <th style="text-align:left;"> TecInteract </th> <th style="text-align:left;"> OceanUse </th> <th style="text-align:left;"> RegComplex </th> <th style="text-align:left;"> Discards </th> <th style="text-align:left;"> Allocation </th> </tr> </thead> <tbody> <tr> <td style="text-align:left;"> Ocean Quahog-C </td> <td style="text-align:left;"> <span style=" color: black !important;padding-right: 4px; padding-left: 4px; background-color: lightgreen !important;text-align: c;">lowest</span> </td> <td style="text-align:left;"> <span style=" color: black !important;padding-right: 4px; padding-left: 4px; background-color: lightgreen !important;text-align: c;">lowest</span> </td> <td style="text-align:left;"> <span style=" color: black !important;padding-right: 4px; padding-left: 4px; background-color: yellow !important;text-align: c;">lowmod</span> </td> <td style="text-align:left;"> <span style=" color: black !important;padding-right: 4px; padding-left: 4px; background-color: lightgreen !important;text-align: c;">lowest</span> </td> <td style="text-align:left;"> <span style=" color: black !important;padding-right: 4px; padding-left: 4px; background-color: orange !important;text-align: c;">modhigh</span> </td> <td style="text-align:left;"> <span style=" color: black !important;padding-right: 4px; padding-left: 4px; background-color: lightgreen !important;text-align: c;">lowest</span> </td> </tr> <tr> <td style="text-align:left;"> Surfclam-C </td> <td style="text-align:left;"> <span style=" color: black !important;padding-right: 4px; padding-left: 4px; background-color: lightgreen !important;text-align: c;">lowest</span> </td> <td style="text-align:left;"> <span style=" color: black !important;padding-right: 4px; padding-left: 4px; background-color: lightgreen !important;text-align: c;">lowest</span> </td> <td style="text-align:left;"> <span style=" color: black !important;padding-right: 4px; padding-left: 4px; background-color: yellow !important;text-align: c;">lowmod</span> </td> <td style="text-align:left;"> <span style=" color: black !important;padding-right: 4px; padding-left: 4px; background-color: lightgreen !important;text-align: c;">lowest</span> </td> <td style="text-align:left;"> <span style=" color: black !important;padding-right: 4px; padding-left: 4px; background-color: orange !important;text-align: c;">modhigh</span> </td> <td style="text-align:left;"> <span style=" color: black !important;padding-right: 4px; padding-left: 4px; background-color: lightgreen !important;text-align: c;">lowest</span> </td> </tr> <tr> <td style="text-align:left;"> Summer flounder-R </td> <td style="text-align:left;"> <span style=" color: black !important;padding-right: 4px; padding-left: 4px; background-color: orange !important;text-align: c;">modhigh</span> </td> <td style="text-align:left;"> <span style=" color: black !important;padding-right: 4px; padding-left: 4px; background-color: lightgreen !important;text-align: c;">lowest</span> </td> <td style="text-align:left;"> <span style=" color: black !important;padding-right: 4px; padding-left: 4px; background-color: yellow !important;text-align: c;">lowmod</span> </td> <td style="text-align:left;"> <span style=" color: black !important;padding-right: 4px; padding-left: 4px; background-color: orange !important;text-align: c;">modhigh</span> </td> <td style="text-align:left;"> <span style=" color: white !important;padding-right: 4px; padding-left: 4px; background-color: red !important;text-align: c;">highest</span> </td> <td style="text-align:left;"> <span style=" color: white !important;padding-right: 4px; padding-left: 4px; background-color: red !important;text-align: c;">highest</span> </td> </tr> <tr> <td style="text-align:left;"> Summer flounder-C </td> <td style="text-align:left;"> <span style=" color: black !important;padding-right: 4px; padding-left: 4px; background-color: yellow !important;text-align: c;">lowmod</span> </td> <td style="text-align:left;"> <span style=" color: black !important;padding-right: 4px; padding-left: 4px; background-color: orange !important;text-align: c;">modhigh</span> </td> <td style="text-align:left;"> <span style=" color: black !important;padding-right: 4px; padding-left: 4px; background-color: yellow !important;text-align: c;">lowmod</span> </td> <td style="text-align:left;"> <span style=" color: black !important;padding-right: 4px; padding-left: 4px; background-color: orange !important;text-align: c;">modhigh</span> </td> <td style="text-align:left;"> <span style=" color: black !important;padding-right: 4px; padding-left: 4px; background-color: orange !important;text-align: c;">modhigh</span> </td> <td style="text-align:left;"> <span style=" color: white !important;padding-right: 4px; padding-left: 4px; background-color: red !important;text-align: c;">highest</span> </td> </tr> <tr> <td style="text-align:left;"> Scup-R </td> <td style="text-align:left;"> <span style=" color: black !important;padding-right: 4px; padding-left: 4px; background-color: yellow !important;text-align: c;">lowmod</span> </td> <td style="text-align:left;"> <span style=" color: black !important;padding-right: 4px; padding-left: 4px; background-color: lightgreen !important;text-align: c;">lowest</span> </td> <td style="text-align:left;"> <span style=" color: black !important;padding-right: 4px; padding-left: 4px; background-color: yellow !important;text-align: c;">lowmod</span> </td> <td style="text-align:left;"> <span style=" color: black !important;padding-right: 4px; padding-left: 4px; background-color: orange !important;text-align: c;">modhigh</span> </td> <td style="text-align:left;"> <span style=" color: black !important;padding-right: 4px; padding-left: 4px; background-color: orange !important;text-align: c;">modhigh</span> </td> <td style="text-align:left;"> <span style=" color: white !important;padding-right: 4px; padding-left: 4px; background-color: red !important;text-align: c;">highest</span> </td> </tr> <tr> <td style="text-align:left;"> Scup-C </td> <td style="text-align:left;"> <span style=" color: black !important;padding-right: 4px; padding-left: 4px; background-color: lightgreen !important;text-align: c;">lowest</span> </td> <td style="text-align:left;"> <span style=" color: black !important;padding-right: 4px; padding-left: 4px; background-color: yellow !important;text-align: c;">lowmod</span> </td> <td style="text-align:left;"> <span style=" color: black !important;padding-right: 4px; padding-left: 4px; background-color: orange !important;text-align: c;">modhigh</span> </td> <td style="text-align:left;"> <span style=" color: black !important;padding-right: 4px; padding-left: 4px; background-color: orange !important;text-align: c;">modhigh</span> </td> <td style="text-align:left;"> <span style=" color: black !important;padding-right: 4px; padding-left: 4px; background-color: orange !important;text-align: c;">modhigh</span> </td> <td style="text-align:left;"> <span style=" color: white !important;padding-right: 4px; padding-left: 4px; background-color: red !important;text-align: c;">highest</span> </td> </tr> <tr> <td style="text-align:left;"> Black sea bass-R </td> <td style="text-align:left;"> <span style=" color: white !important;padding-right: 4px; padding-left: 4px; background-color: red !important;text-align: c;">highest</span> </td> <td style="text-align:left;"> <span style=" color: black !important;padding-right: 4px; padding-left: 4px; background-color: lightgreen !important;text-align: c;">lowest</span> </td> <td style="text-align:left;"> <span style=" color: black !important;padding-right: 4px; padding-left: 4px; background-color: orange !important;text-align: c;">modhigh</span> </td> <td style="text-align:left;"> <span style=" color: black !important;padding-right: 4px; padding-left: 4px; background-color: orange !important;text-align: c;">modhigh</span> </td> <td style="text-align:left;"> <span style=" color: white !important;padding-right: 4px; padding-left: 4px; background-color: red !important;text-align: c;">highest</span> </td> <td style="text-align:left;"> <span style=" color: white !important;padding-right: 4px; padding-left: 4px; background-color: red !important;text-align: c;">highest</span> </td> </tr> <tr> <td style="text-align:left;"> Black sea bass-C </td> <td style="text-align:left;"> <span style=" color: white !important;padding-right: 4px; padding-left: 4px; background-color: red !important;text-align: c;">highest</span> </td> <td style="text-align:left;"> <span style=" color: black !important;padding-right: 4px; padding-left: 4px; background-color: yellow !important;text-align: c;">lowmod</span> </td> <td style="text-align:left;"> <span style=" color: white !important;padding-right: 4px; padding-left: 4px; background-color: red !important;text-align: c;">highest</span> </td> <td style="text-align:left;"> <span style=" color: black !important;padding-right: 4px; padding-left: 4px; background-color: orange !important;text-align: c;">modhigh</span> </td> <td style="text-align:left;"> <span style=" color: white !important;padding-right: 4px; padding-left: 4px; background-color: red !important;text-align: c;">highest</span> </td> <td style="text-align:left;"> <span style=" color: white !important;padding-right: 4px; padding-left: 4px; background-color: red !important;text-align: c;">highest</span> </td> </tr> <tr> <td style="text-align:left;"> Atl. mackerel-R </td> <td style="text-align:left;"> <span style=" color: black !important;padding-right: 4px; padding-left: 4px; background-color: yellow !important;text-align: c;">lowmod</span> </td> <td style="text-align:left;"> <span style=" color: black !important;padding-right: 4px; padding-left: 4px; background-color: lightgreen !important;text-align: c;">lowest</span> </td> <td style="text-align:left;"> <span style=" color: black !important;padding-right: 4px; padding-left: 4px; background-color: lightgreen !important;text-align: c;">lowest</span> </td> <td style="text-align:left;"> <span style=" color: black !important;padding-right: 4px; padding-left: 4px; background-color: lightgreen !important;text-align: c;">lowest</span> </td> <td style="text-align:left;"> <span style=" color: black !important;padding-right: 4px; padding-left: 4px; background-color: lightgreen !important;text-align: c;">lowest</span> </td> <td style="text-align:left;"> <span style=" color: black !important;padding-right: 4px; padding-left: 4px; background-color: lightgreen !important;text-align: c;">lowest</span> </td> </tr> <tr> <td style="text-align:left;"> Atl. mackerel-C </td> <td style="text-align:left;"> <span style=" color: black !important;padding-right: 4px; padding-left: 4px; background-color: lightgreen !important;text-align: c;">lowest</span> </td> <td style="text-align:left;"> <span style=" color: black !important;padding-right: 4px; padding-left: 4px; background-color: yellow !important;text-align: c;">lowmod</span> </td> <td style="text-align:left;"> <span style=" color: black !important;padding-right: 4px; padding-left: 4px; background-color: orange !important;text-align: c;">modhigh</span> </td> <td style="text-align:left;"> <span style=" color: white !important;padding-right: 4px; padding-left: 4px; background-color: red !important;text-align: c;">highest</span> </td> <td style="text-align:left;"> <span style=" color: black !important;padding-right: 4px; padding-left: 4px; background-color: yellow !important;text-align: c;">lowmod</span> </td> <td style="text-align:left;"> <span style=" color: white !important;padding-right: 4px; padding-left: 4px; background-color: red !important;text-align: c;">highest</span> </td> </tr> <tr> <td style="text-align:left;"> Butterfish-C </td> <td style="text-align:left;"> <span style=" color: black !important;padding-right: 4px; padding-left: 4px; background-color: lightgreen !important;text-align: c;">lowest</span> </td> <td style="text-align:left;"> <span style=" color: black !important;padding-right: 4px; padding-left: 4px; background-color: yellow !important;text-align: c;">lowmod</span> </td> <td style="text-align:left;"> <span style=" color: black !important;padding-right: 4px; padding-left: 4px; background-color: orange !important;text-align: c;">modhigh</span> </td> <td style="text-align:left;"> <span style=" color: white !important;padding-right: 4px; padding-left: 4px; background-color: red !important;text-align: c;">highest</span> </td> <td style="text-align:left;"> <span style=" color: black !important;padding-right: 4px; padding-left: 4px; background-color: orange !important;text-align: c;">modhigh</span> </td> <td style="text-align:left;"> <span style=" color: black !important;padding-right: 4px; padding-left: 4px; background-color: lightgreen !important;text-align: c;">lowest</span> </td> </tr> <tr> <td style="text-align:left;"> Longfin squid-C </td> <td style="text-align:left;"> <span style=" color: black !important;padding-right: 4px; padding-left: 4px; background-color: lightgreen !important;text-align: c;">lowest</span> </td> <td style="text-align:left;"> <span style=" color: black !important;padding-right: 4px; padding-left: 4px; background-color: orange !important;text-align: c;">modhigh</span> </td> <td style="text-align:left;"> <span style=" color: white !important;padding-right: 4px; padding-left: 4px; background-color: red !important;text-align: c;">highest</span> </td> <td style="text-align:left;"> <span style=" color: white !important;padding-right: 4px; padding-left: 4px; background-color: red !important;text-align: c;">highest</span> </td> <td style="text-align:left;"> <span style=" color: white !important;padding-right: 4px; padding-left: 4px; background-color: red !important;text-align: c;">highest</span> </td> <td style="text-align:left;"> <span style=" color: black !important;padding-right: 4px; padding-left: 4px; background-color: lightgreen !important;text-align: c;">lowest</span> </td> </tr> <tr> <td style="text-align:left;"> Shortfin squid-C </td> <td style="text-align:left;"> <span style=" color: black !important;padding-right: 4px; padding-left: 4px; background-color: yellow !important;text-align: c;">lowmod</span> </td> <td style="text-align:left;"> <span style=" color: black !important;padding-right: 4px; padding-left: 4px; background-color: yellow !important;text-align: c;">lowmod</span> </td> <td style="text-align:left;"> <span style=" color: black !important;padding-right: 4px; padding-left: 4px; background-color: yellow !important;text-align: c;">lowmod</span> </td> <td style="text-align:left;"> <span style=" color: black !important;padding-right: 4px; padding-left: 4px; background-color: yellow !important;text-align: c;">lowmod</span> </td> <td style="text-align:left;"> <span style=" color: black !important;padding-right: 4px; padding-left: 4px; background-color: lightgreen !important;text-align: c;">lowest</span> </td> <td style="text-align:left;"> <span style=" color: black !important;padding-right: 4px; padding-left: 4px; background-color: lightgreen !important;text-align: c;">lowest</span> </td> </tr> <tr> <td style="text-align:left;"> Golden tilefish-R </td> <td style="text-align:left;"> <span style=" color: black !important;padding-right: 4px; padding-left: 4px; background-color: white !important;text-align: c;">na</span> </td> <td style="text-align:left;"> <span style=" color: black !important;padding-right: 4px; padding-left: 4px; background-color: lightgreen !important;text-align: c;">lowest</span> </td> <td style="text-align:left;"> <span style=" color: black !important;padding-right: 4px; padding-left: 4px; background-color: lightgreen !important;text-align: c;">lowest</span> </td> <td style="text-align:left;"> <span style=" color: black !important;padding-right: 4px; padding-left: 4px; background-color: lightgreen !important;text-align: c;">lowest</span> </td> <td style="text-align:left;"> <span style=" color: black !important;padding-right: 4px; padding-left: 4px; background-color: lightgreen !important;text-align: c;">lowest</span> </td> <td style="text-align:left;"> <span style=" color: black !important;padding-right: 4px; padding-left: 4px; background-color: lightgreen !important;text-align: c;">lowest</span> </td> </tr> <tr> <td style="text-align:left;"> Golden tilefish-C </td> <td style="text-align:left;"> <span style=" color: black !important;padding-right: 4px; padding-left: 4px; background-color: lightgreen !important;text-align: c;">lowest</span> </td> <td style="text-align:left;"> <span style=" color: black !important;padding-right: 4px; padding-left: 4px; background-color: lightgreen !important;text-align: c;">lowest</span> </td> <td style="text-align:left;"> <span style=" color: black !important;padding-right: 4px; padding-left: 4px; background-color: lightgreen !important;text-align: c;">lowest</span> </td> <td style="text-align:left;"> <span style=" color: black !important;padding-right: 4px; padding-left: 4px; background-color: lightgreen !important;text-align: c;">lowest</span> </td> <td style="text-align:left;"> <span style=" color: black !important;padding-right: 4px; padding-left: 4px; background-color: lightgreen !important;text-align: c;">lowest</span> </td> <td style="text-align:left;"> <span style=" color: black !important;padding-right: 4px; padding-left: 4px; background-color: lightgreen !important;text-align: c;">lowest</span> </td> </tr> <tr> <td style="text-align:left;"> Blueline tilefish-R </td> <td style="text-align:left;"> <span style=" color: black !important;padding-right: 4px; padding-left: 4px; background-color: lightgreen !important;text-align: c;">lowest</span> </td> <td style="text-align:left;"> <span style=" color: black !important;padding-right: 4px; padding-left: 4px; background-color: lightgreen !important;text-align: c;">lowest</span> </td> <td style="text-align:left;"> <span style=" color: black !important;padding-right: 4px; padding-left: 4px; background-color: lightgreen !important;text-align: c;">lowest</span> </td> <td style="text-align:left;"> <span style=" color: black !important;padding-right: 4px; padding-left: 4px; background-color: orange !important;text-align: c;">modhigh</span> </td> <td style="text-align:left;"> <span style=" color: black !important;padding-right: 4px; padding-left: 4px; background-color: lightgreen !important;text-align: c;">lowest</span> </td> <td style="text-align:left;"> <span style=" color: white !important;padding-right: 4px; padding-left: 4px; background-color: red !important;text-align: c;">highest</span> </td> </tr> <tr> <td style="text-align:left;"> Blueline tilefish-C </td> <td style="text-align:left;"> <span style=" color: black !important;padding-right: 4px; padding-left: 4px; background-color: lightgreen !important;text-align: c;">lowest</span> </td> <td style="text-align:left;"> <span style=" color: black !important;padding-right: 4px; padding-left: 4px; background-color: lightgreen !important;text-align: c;">lowest</span> </td> <td style="text-align:left;"> <span style=" color: black !important;padding-right: 4px; padding-left: 4px; background-color: lightgreen !important;text-align: c;">lowest</span> </td> <td style="text-align:left;"> <span style=" color: black !important;padding-right: 4px; padding-left: 4px; background-color: orange !important;text-align: c;">modhigh</span> </td> <td style="text-align:left;"> <span style=" color: black !important;padding-right: 4px; padding-left: 4px; background-color: lightgreen !important;text-align: c;">lowest</span> </td> <td style="text-align:left;"> <span style=" color: white !important;padding-right: 4px; padding-left: 4px; background-color: red !important;text-align: c;">highest</span> </td> </tr> <tr> <td style="text-align:left;"> Bluefish-R </td> <td style="text-align:left;"> <span style=" color: black !important;padding-right: 4px; padding-left: 4px; background-color: yellow !important;text-align: c;">lowmod</span> </td> <td style="text-align:left;"> <span style=" color: black !important;padding-right: 4px; padding-left: 4px; background-color: lightgreen !important;text-align: c;">lowest</span> </td> <td style="text-align:left;"> <span style=" color: black !important;padding-right: 4px; padding-left: 4px; background-color: lightgreen !important;text-align: c;">lowest</span> </td> <td style="text-align:left;"> <span style=" color: black !important;padding-right: 4px; padding-left: 4px; background-color: yellow !important;text-align: c;">lowmod</span> </td> <td style="text-align:left;"> <span style=" color: black !important;padding-right: 4px; padding-left: 4px; background-color: orange !important;text-align: c;">modhigh</span> </td> <td style="text-align:left;"> <span style=" color: white !important;padding-right: 4px; padding-left: 4px; background-color: red !important;text-align: c;">highest</span> </td> </tr> <tr> <td style="text-align:left;"> Bluefish-C </td> <td style="text-align:left;"> <span style=" color: black !important;padding-right: 4px; padding-left: 4px; background-color: lightgreen !important;text-align: c;">lowest</span> </td> <td style="text-align:left;"> <span style=" color: black !important;padding-right: 4px; padding-left: 4px; background-color: lightgreen !important;text-align: c;">lowest</span> </td> <td style="text-align:left;"> <span style=" color: black !important;padding-right: 4px; padding-left: 4px; background-color: yellow !important;text-align: c;">lowmod</span> </td> <td style="text-align:left;"> <span style=" color: black !important;padding-right: 4px; padding-left: 4px; background-color: yellow !important;text-align: c;">lowmod</span> </td> <td style="text-align:left;"> <span style=" color: black !important;padding-right: 4px; padding-left: 4px; background-color: yellow !important;text-align: c;">lowmod</span> </td> <td style="text-align:left;"> <span style=" color: white !important;padding-right: 4px; padding-left: 4px; background-color: red !important;text-align: c;">highest</span> </td> </tr> <tr> <td style="text-align:left;"> Spiny dogfish-R </td> <td style="text-align:left;"> <span style=" color: black !important;padding-right: 4px; padding-left: 4px; background-color: lightgreen !important;text-align: c;">lowest</span> </td> <td style="text-align:left;"> <span style=" color: black !important;padding-right: 4px; padding-left: 4px; background-color: lightgreen !important;text-align: c;">lowest</span> </td> <td style="text-align:left;"> <span style=" color: black !important;padding-right: 4px; padding-left: 4px; background-color: lightgreen !important;text-align: c;">lowest</span> </td> <td style="text-align:left;"> <span style=" color: black !important;padding-right: 4px; padding-left: 4px; background-color: lightgreen !important;text-align: c;">lowest</span> </td> <td style="text-align:left;"> <span style=" color: black !important;padding-right: 4px; padding-left: 4px; background-color: lightgreen !important;text-align: c;">lowest</span> </td> <td style="text-align:left;"> <span style=" color: black !important;padding-right: 4px; padding-left: 4px; background-color: lightgreen !important;text-align: c;">lowest</span> </td> </tr> <tr> <td style="text-align:left;"> Spiny dogfish-C </td> <td style="text-align:left;"> <span style=" color: black !important;padding-right: 4px; padding-left: 4px; background-color: lightgreen !important;text-align: c;">lowest</span> </td> <td style="text-align:left;"> <span style=" color: black !important;padding-right: 4px; padding-left: 4px; background-color: orange !important;text-align: c;">modhigh</span> </td> <td style="text-align:left;"> <span style=" color: black !important;padding-right: 4px; padding-left: 4px; background-color: orange !important;text-align: c;">modhigh</span> </td> <td style="text-align:left;"> <span style=" color: black !important;padding-right: 4px; padding-left: 4px; background-color: orange !important;text-align: c;">modhigh</span> </td> <td style="text-align:left;"> <span style=" color: black !important;padding-right: 4px; padding-left: 4px; background-color: yellow !important;text-align: c;">lowmod</span> </td> <td style="text-align:left;"> <span style=" color: black !important;padding-right: 4px; padding-left: 4px; background-color: lightgreen !important;text-align: c;">lowest</span> </td> </tr> <tr> <td style="text-align:left;"> Chub mackerel-C </td> <td style="text-align:left;"> <span style=" color: black !important;padding-right: 4px; padding-left: 4px; background-color: lightgreen !important;text-align: c;">lowest</span> </td> <td style="text-align:left;"> <span style=" color: black !important;padding-right: 4px; padding-left: 4px; background-color: yellow !important;text-align: c;">lowmod</span> </td> <td style="text-align:left;"> <span style=" color: black !important;padding-right: 4px; padding-left: 4px; background-color: yellow !important;text-align: c;">lowmod</span> </td> <td style="text-align:left;"> <span style=" color: black !important;padding-right: 4px; padding-left: 4px; background-color: yellow !important;text-align: c;">lowmod</span> </td> <td style="text-align:left;"> <span style=" color: black !important;padding-right: 4px; padding-left: 4px; background-color: lightgreen !important;text-align: c;">lowest</span> </td> <td style="text-align:left;"> <span style=" color: black !important;padding-right: 4px; padding-left: 4px; background-color: lightgreen !important;text-align: c;">lowest</span> </td> </tr> <tr> <td style="text-align:left;"> Unmanaged forage </td> <td style="text-align:left;"> <span style=" color: black !important;padding-right: 4px; padding-left: 4px; background-color: lightgreen !important;text-align: c;">lowest</span> </td> <td style="text-align:left;"> <span style=" color: black !important;padding-right: 4px; padding-left: 4px; background-color: lightgreen !important;text-align: c;">lowest</span> </td> <td style="text-align:left;"> <span style=" color: black !important;padding-right: 4px; padding-left: 4px; background-color: orange !important;text-align: c;">modhigh</span> </td> <td style="text-align:left;"> <span style=" color: black !important;padding-right: 4px; padding-left: 4px; background-color: lightgreen !important;text-align: c;">lowest</span> </td> <td style="text-align:left;"> <span style=" color: black !important;padding-right: 4px; padding-left: 4px; background-color: lightgreen !important;text-align: c;">lowest</span> </td> <td style="text-align:left;"> <span style=" color: black !important;padding-right: 4px; padding-left: 4px; background-color: lightgreen !important;text-align: c;">lowest</span> </td> </tr> <tr> <td style="text-align:left;"> Deepsea corals </td> <td style="text-align:left;"> <span style=" color: black !important;padding-right: 4px; padding-left: 4px; background-color: white !important;text-align: c;">na</span> </td> <td style="text-align:left;"> <span style=" color: black !important;padding-right: 4px; padding-left: 4px; background-color: white !important;text-align: c;">na</span> </td> <td style="text-align:left;"> <span style=" color: black !important;padding-right: 4px; padding-left: 4px; background-color: orange !important;text-align: c;">modhigh</span> </td> <td style="text-align:left;"> <span style=" color: black !important;padding-right: 4px; padding-left: 4px; background-color: white !important;text-align: c;">na</span> </td> <td style="text-align:left;"> <span style=" color: black !important;padding-right: 4px; padding-left: 4px; background-color: white !important;text-align: c;">na</span> </td> <td style="text-align:left;"> <span style=" color: black !important;padding-right: 4px; padding-left: 4px; background-color: white !important;text-align: c;">na</span> </td> </tr> </tbody> </table> .contrib[ * Allocation risk decreased for 4 fisheries from high to low (intermediate rankings not applied) * Black sea bass regulatory complexity risk decreased from highest to mod-high ] ] ??? Changes: Butterfish B status risk increased from lowest to low-mod (below Bmsy) Allocation risk decreased for 4 fisheries from high to low (intermediate rankings not applied) Black sea bass regulatory complexity risk decreased from highest to moderate-high Potential new indicators from new SOE sections on climate risk, habitat vulnerability, offshore wind Habitat vulnerability analysis writeups--comments? --- ## How is MAFMC using the risk assessment? What's next? .pull-left[ * Based on risk assessment, the Council selected summer flounder as high-risk fishery for conceptual modeling  ] .pull-right[ * Working group of habitat, biology, stock assessment, management, economic and social scientists developed: * draft conceptual models of high risk elements, linkages * dataset identification and gap analysis for each element and link * draft questions that the Council could persue with additional work * Final conceptual model and supporting information at December 2019 Council meeting, ([DePiper, et al., 2021](https://doi.org/10.1093/icesjms/fsab054)) ] * Council proceeding with management strategy evaluation (MSE) using the information from conceptual modeling as a basis. Topic: addressing recreational fishery discards with EAFM --- <div id="htmlwidget-44a19574c5d96091f097" style="width:100%;height:710px;" class="widgetframe html-widget"></div> <script type="application/json" data-for="htmlwidget-44a19574c5d96091f097">{"x":{"url":"20210804_ESR_Risk_Gaichas_files/figure-html//widgets/widget_sfconceptmod.html","options":{"xdomain":"*","allowfullscreen":false,"lazyload":false}},"evals":[],"jsHooks":[]}</script> ??? In this interactive circular graph visualization, model elements identified as important by the Council (through risk assessment) and by the working group (through a range of experience and expertise) are at the perimeter of the circle. Elements are defined in detail in the last section of [this page](https://gdepiper.github.io/Summer_Flounder_Conceptual_Models/sfconsmod_riskfactors_subplots.html). Relationships between elements are represented as links across the center of the circle to other elements on the perimeter. Links from a model element that affect another element start wide at the base and are color coded to match the category of the element they affect.Hover over a perimeter section (an element) to see all relationships for that element, including links from other elements. Hover over a link to see what it connects. Links by default show text for the two elements and the direction of the relationship (1 for relationship, 0 for no relationship--most links are one direction).For example, hovering over the element "Total Landings" in the full model shows that the working group identified the elements affected by landings as Seafood Production, Recreational Value, and Commercial Profits (three links leading out from landings), and the elements affecting landings as Fluke SSB, Fluke Distributional Shift, Risk Buffering, Management Control, Total Discards, and Shoreside Support (6 links leading into Total Landings). --- ## Council-selected management question: ##Evaluate the biological and economic benefits of minimizing summer flounder discards and converting discards into landings in the recreational sector. Identify management strategies to effectively realize these benefits. .pull-left[ * Opportunity to align EAFM work with traditional Council process * Management challenges to address and reduce regulatory discards + 90% of rec summer flounder catch is released * Raised by AP members and stakeholders seeking management to address * EAFM issue and focus – seven linked categories: Management, Summer Flounder Stock, Science, Fishing Fleets, and Benefits ] .pull-right[ 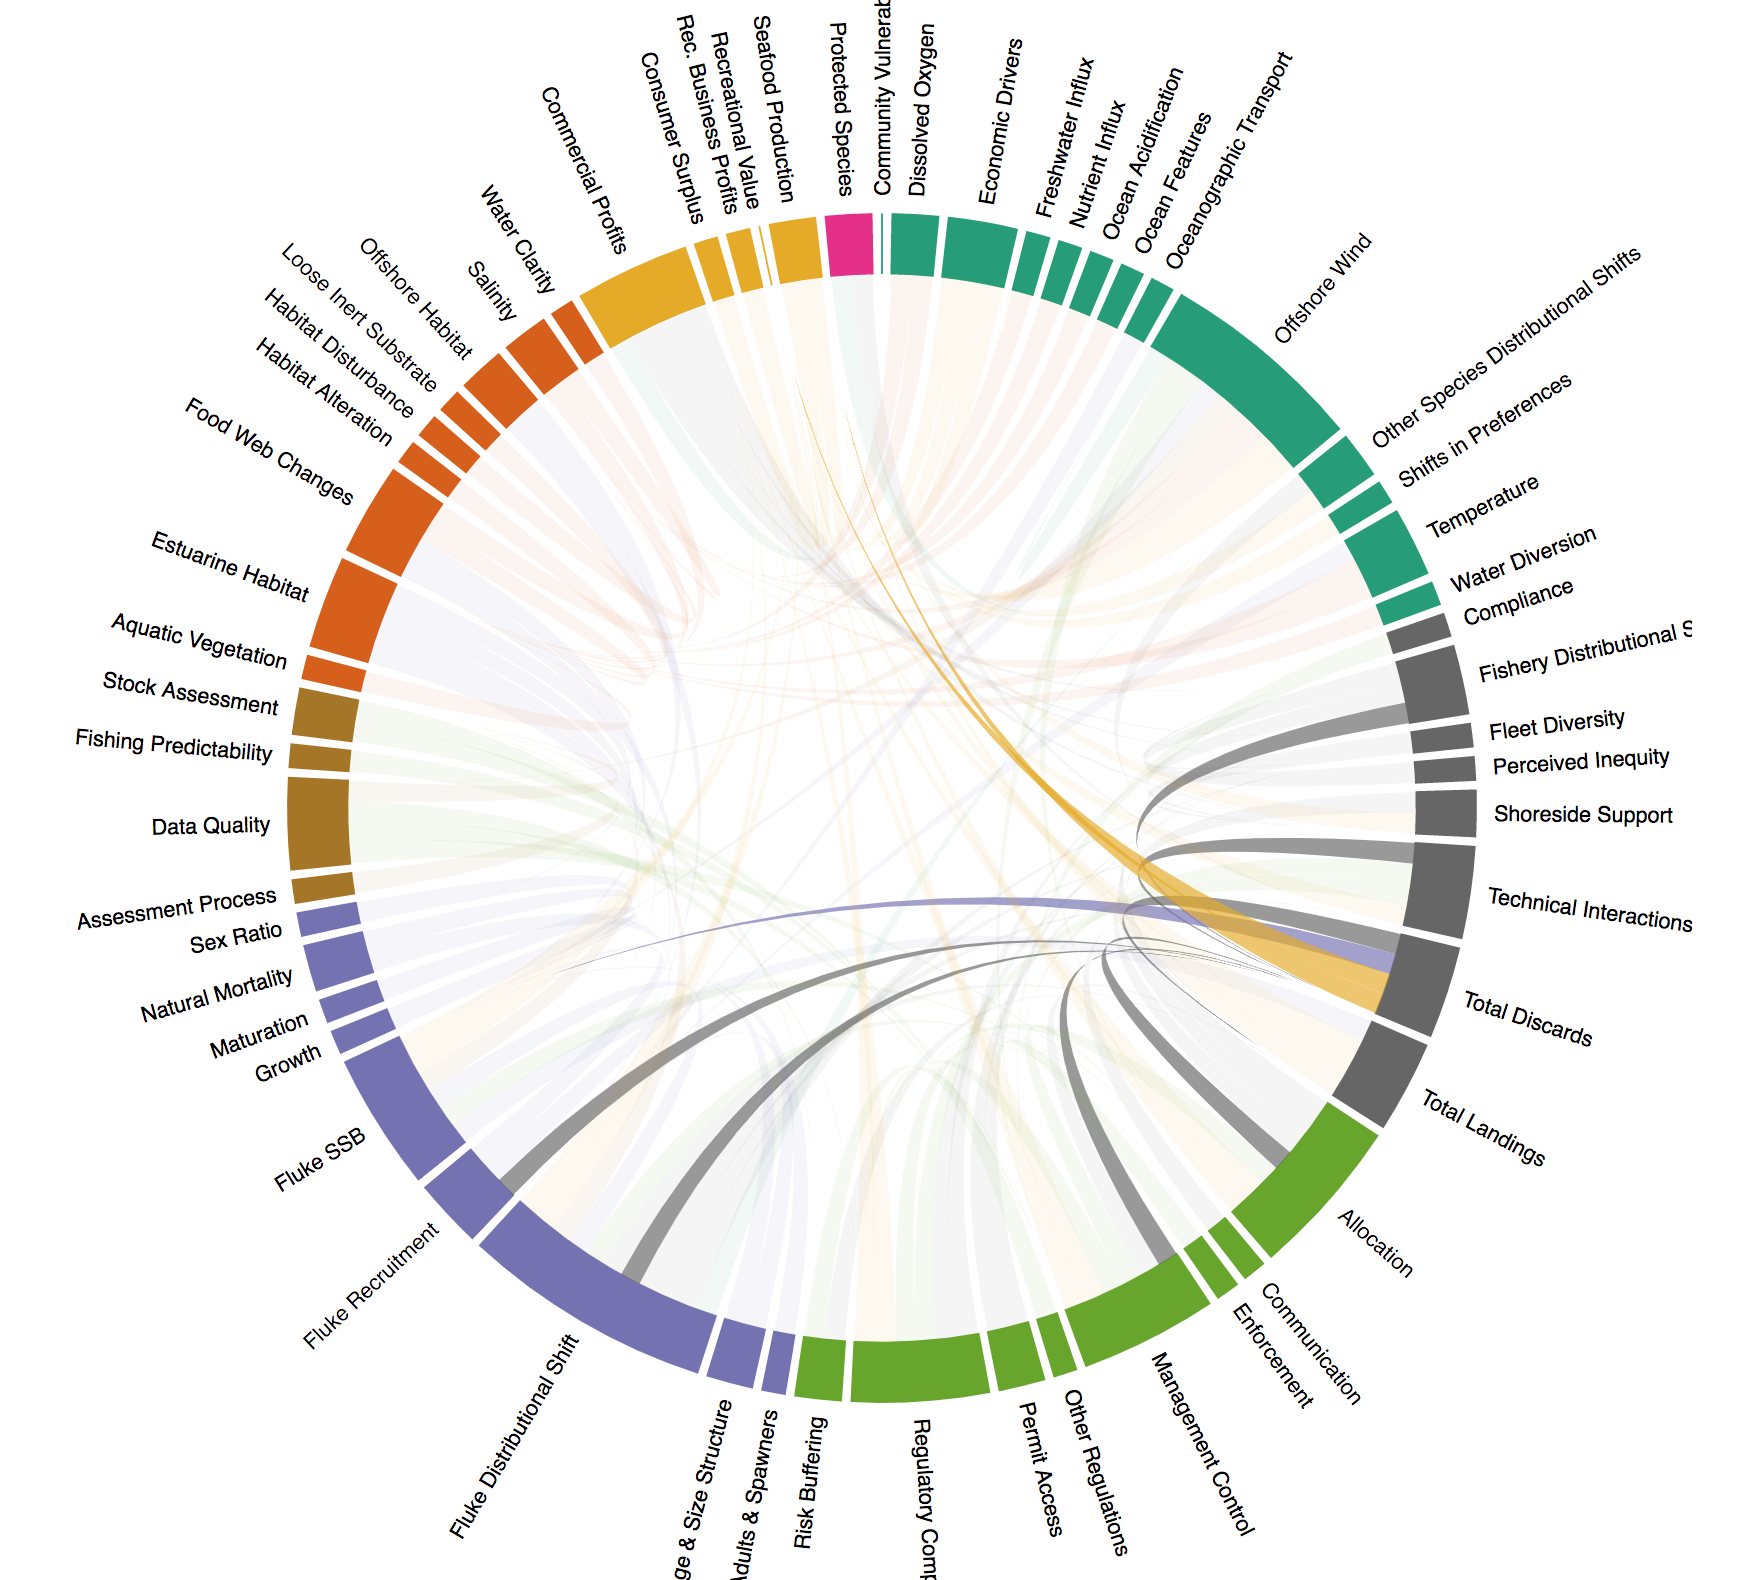  ] --- # Conclusions * The process takes time – need to recognize that early and be willing to invest the resources to see it through + Need the science to develop and support efforts + Need management (and stakeholders) to understand process and concepts and support process * Collaboration is key + Within the science community – diverse expertise is needed + Between science and management – understanding what information is needed and important to management, providing tools to management to understand ecosystem linkages and implications + Between science and stakeholders – need to build trust, open dialogue (everyone is heard), and sharing data and observations (on water and with information) + Between management and stakeholders – listening to/acting on stakeholder priorities and feedback, process not out to add more uncertainty but provide for more informed decisions * Timely and understandable scientific information + Developing a process to create science products at timescales necessary for management + Information needs to be relevant and clearly presented + Flexibility to use different/alternative data sources when specific data in not available (proxies) --- ## References .contrib[ <a name=bib-bastille_improving_2020></a>[Bastille, K. et al.](#cite-bastille_improving_2020) (2020). "Improving the IEA Approach Using Principles of Open Data Science". In: _Coastal Management_ 0.0. Publisher: Taylor & Francis \_ eprint: https://doi.org/10.1080/08920753.2021.1846155, pp. 1-18. ISSN: 0892-0753. DOI: [10.1080/08920753.2021.1846155](https://doi.org/10.1080%2F08920753.2021.1846155). URL: [https://doi.org/10.1080/08920753.2021.1846155](https://doi.org/10.1080/08920753.2021.1846155) (visited on Dec. 09, 2020). <a name=bib-depiper_learning_2021></a>[DePiper, G. et al.](#cite-depiper_learning_2021) (2021). "Learning by doing: collaborative conceptual modelling as a path forward in ecosystem-based management". In: _ICES Journal of Marine Science_. ISSN: 1054-3139. DOI: [10.1093/icesjms/fsab054](https://doi.org/10.1093%2Ficesjms%2Ffsab054). URL: [https://doi.org/10.1093/icesjms/fsab054](https://doi.org/10.1093/icesjms/fsab054) (visited on Apr. 15, 2021). <a name=bib-gaichas_implementing_2018></a>[Gaichas, S. K. et al.](#cite-gaichas_implementing_2018) (2018). "Implementing Ecosystem Approaches to Fishery Management: Risk Assessment in the US Mid-Atlantic". In: _Frontiers in Marine Science_ 5. ISSN: 2296-7745. DOI: [10.3389/fmars.2018.00442](https://doi.org/10.3389%2Ffmars.2018.00442). URL: [https://www.frontiersin.org/articles/10.3389/fmars.2018.00442/abstract](https://www.frontiersin.org/articles/10.3389/fmars.2018.00442/abstract) (visited on Nov. 20, 2018). <a name=bib-gaichas_framework_2016></a>[Gaichas, S. K. et al.](#cite-gaichas_framework_2016) (2016). "A Framework for Incorporating Species, Fleet, Habitat, and Climate Interactions into Fishery Management". In: _Frontiers in Marine Science_ 3. ISSN: 2296-7745. DOI: [10.3389/fmars.2016.00105](https://doi.org/10.3389%2Ffmars.2016.00105). URL: [https://www.frontiersin.org/articles/10.3389/fmars.2016.00105/full](https://www.frontiersin.org/articles/10.3389/fmars.2016.00105/full) (visited on Apr. 29, 2020). <a name=bib-muffley_there_2020></a>[Muffley, B. et al.](#cite-muffley_there_2020) (2020). "There Is no I in EAFM Adapting Integrated Ecosystem Assessment for Mid-Atlantic Fisheries Management". In: _Coastal Management_ 0.0. Publisher: Taylor & Francis \_ eprint: https://doi.org/10.1080/08920753.2021.1846156, pp. 1-17. ISSN: 0892-0753. DOI: [10.1080/08920753.2021.1846156](https://doi.org/10.1080%2F08920753.2021.1846156). URL: [https://doi.org/10.1080/08920753.2021.1846156](https://doi.org/10.1080/08920753.2021.1846156) (visited on Dec. 09, 2020). ## Additional resources .pull-left[ * [2021 State of the Ecosystem Reports](https://www.fisheries.noaa.gov/new-england-mid-atlantic/ecosystems/state-ecosystem-reports-northeast-us-shelf) * [ecodata R package](https://github.com/noaa-edab/ecodata) * Visualizations: * [Mid-Atlantic Human Dimensions indicators](http://noaa-edab.github.io/ecodata/human_dimensions_MAB) * [Mid-Atlantic Macrofauna indicators](http://noaa-edab.github.io/ecodata/macrofauna_MAB) * [Mid-Atlantic Lower trophic level indicators](https://noaa-edab.github.io/ecodata/LTL_MAB) * [SOE Technical Documentation](https://noaa-edab.github.io/tech-doc) * [Draft indicator catalog](https://noaa-edab.github.io/catalog/) ] .pull-right[ * [Mid-Atlantic ecosystem approach](https://www.mafmc.org/eafm) * [Mid-Atlantic Council Summer Flounder conceptual model, support tables](https://gdepiper.github.io/Summer_Flounder_Conceptual_Models/sfconsmod_riskfactors_subplots.html) * [Management questions and conceptual model](https://gdepiper.github.io/Summer_Flounder_Conceptual_Models/sfconsmod_final_2col.html) * [Mid-Atantic April 2021 EAFM updates, including SOE, risk assessment, request memo](https://www.mafmc.org/s/Tab06_SOE-Mid-Atlantic-Risk-Assessment__2021-04.pdf) * [Summer Flounder MSE](https://www.mafmc.org/actions/summer-flounder-mse) * Slides available at https://noaa-edab.github.io/presentations * Contact: <Sarah.Gaichas@noaa.gov> ] ] --- background-image: url("EDAB_images/SOE_feature_image.png") background-size: 1000px background-position: center --- ## State of the Ecosystem Report Structure .pull-left[ ## 2020 Report 1. Summary 2 pager 1. Human dimensions 1. Protected species 1. Fish and invertebrates (managed and otherwise) 1. Habitat quality and ecosystem productivity ## 2021 Report 1. Graphical summary + Page 1 report card re: objectives → + Page 2 risk summary bullets + Page 3 synthesis themes 1. Performance relative to management objectives 1. Risks to meeting management objectives ] .pull-right[ <table class="table" style="font-size: 14px; margin-left: auto; margin-right: auto;"> <caption style="font-size: initial !important;">Ecosystem-scale fishery management objectives</caption> <thead> <tr> <th style="text-align:left;font-weight: bold;"> Objective Categories </th> <th style="text-align:left;font-weight: bold;"> Indicators reported here </th> </tr> </thead> <tbody> <tr grouplength="6"><td colspan="2" style="border-bottom: 1px solid;"><strong>Provisioning and Cultural Services</strong></td></tr> <tr> <td style="text-align:left;padding-left: 2em;" indentlevel="1"> Seafood Production </td> <td style="text-align:left;"> Landings; commercial total and by feeding guild; recreational harvest </td> </tr> <tr> <td style="text-align:left;padding-left: 2em;" indentlevel="1"> Profits </td> <td style="text-align:left;"> Revenue decomposed to price and volume </td> </tr> <tr> <td style="text-align:left;padding-left: 2em;" indentlevel="1"> Recreation </td> <td style="text-align:left;"> Days fished; recreational fleet diversity </td> </tr> <tr> <td style="text-align:left;padding-left: 2em;" indentlevel="1"> Stability </td> <td style="text-align:left;"> Diversity indices (fishery and ecosystem) </td> </tr> <tr> <td style="text-align:left;padding-left: 2em;" indentlevel="1"> Social & Cultural </td> <td style="text-align:left;"> Community engagement/reliance status </td> </tr> <tr> <td style="text-align:left;padding-left: 2em;" indentlevel="1"> Protected Species </td> <td style="text-align:left;"> Bycatch; population (adult and juvenile) numbers, mortalities </td> </tr> <tr grouplength="4"><td colspan="2" style="border-bottom: 1px solid;"><strong>Supporting and Regulating Services</strong></td></tr> <tr> <td style="text-align:left;padding-left: 2em;" indentlevel="1"> Biomass </td> <td style="text-align:left;"> Biomass or abundance by feeding guild from surveys </td> </tr> <tr> <td style="text-align:left;padding-left: 2em;" indentlevel="1"> Productivity </td> <td style="text-align:left;"> Condition and recruitment of managed species, Primary productivity </td> </tr> <tr> <td style="text-align:left;padding-left: 2em;" indentlevel="1"> Trophic structure </td> <td style="text-align:left;"> Relative biomass of feeding guilds, Zooplankton </td> </tr> <tr> <td style="text-align:left;padding-left: 2em;" indentlevel="1"> Habitat </td> <td style="text-align:left;"> Estuarine and offshore habitat conditions </td> </tr> </tbody> </table> ] --- ## Ecosystem synthesis themes for 2021 Characterizing ecosystem change for fishery management * Societal, biological, physical and chemical factors comprise the **multiple system drivers** that influence marine ecosystems through a variety of different pathways. * Changes in the multiple drivers can lead to **regime shifts** — large, abrupt and persistent changes in the structure and function of an ecosystem. * Regime shifts and changes in how the multiple system drivers interact can result in **ecosystem reorganization** as species and humans respond and adapt to the new environment. .pull-left[ 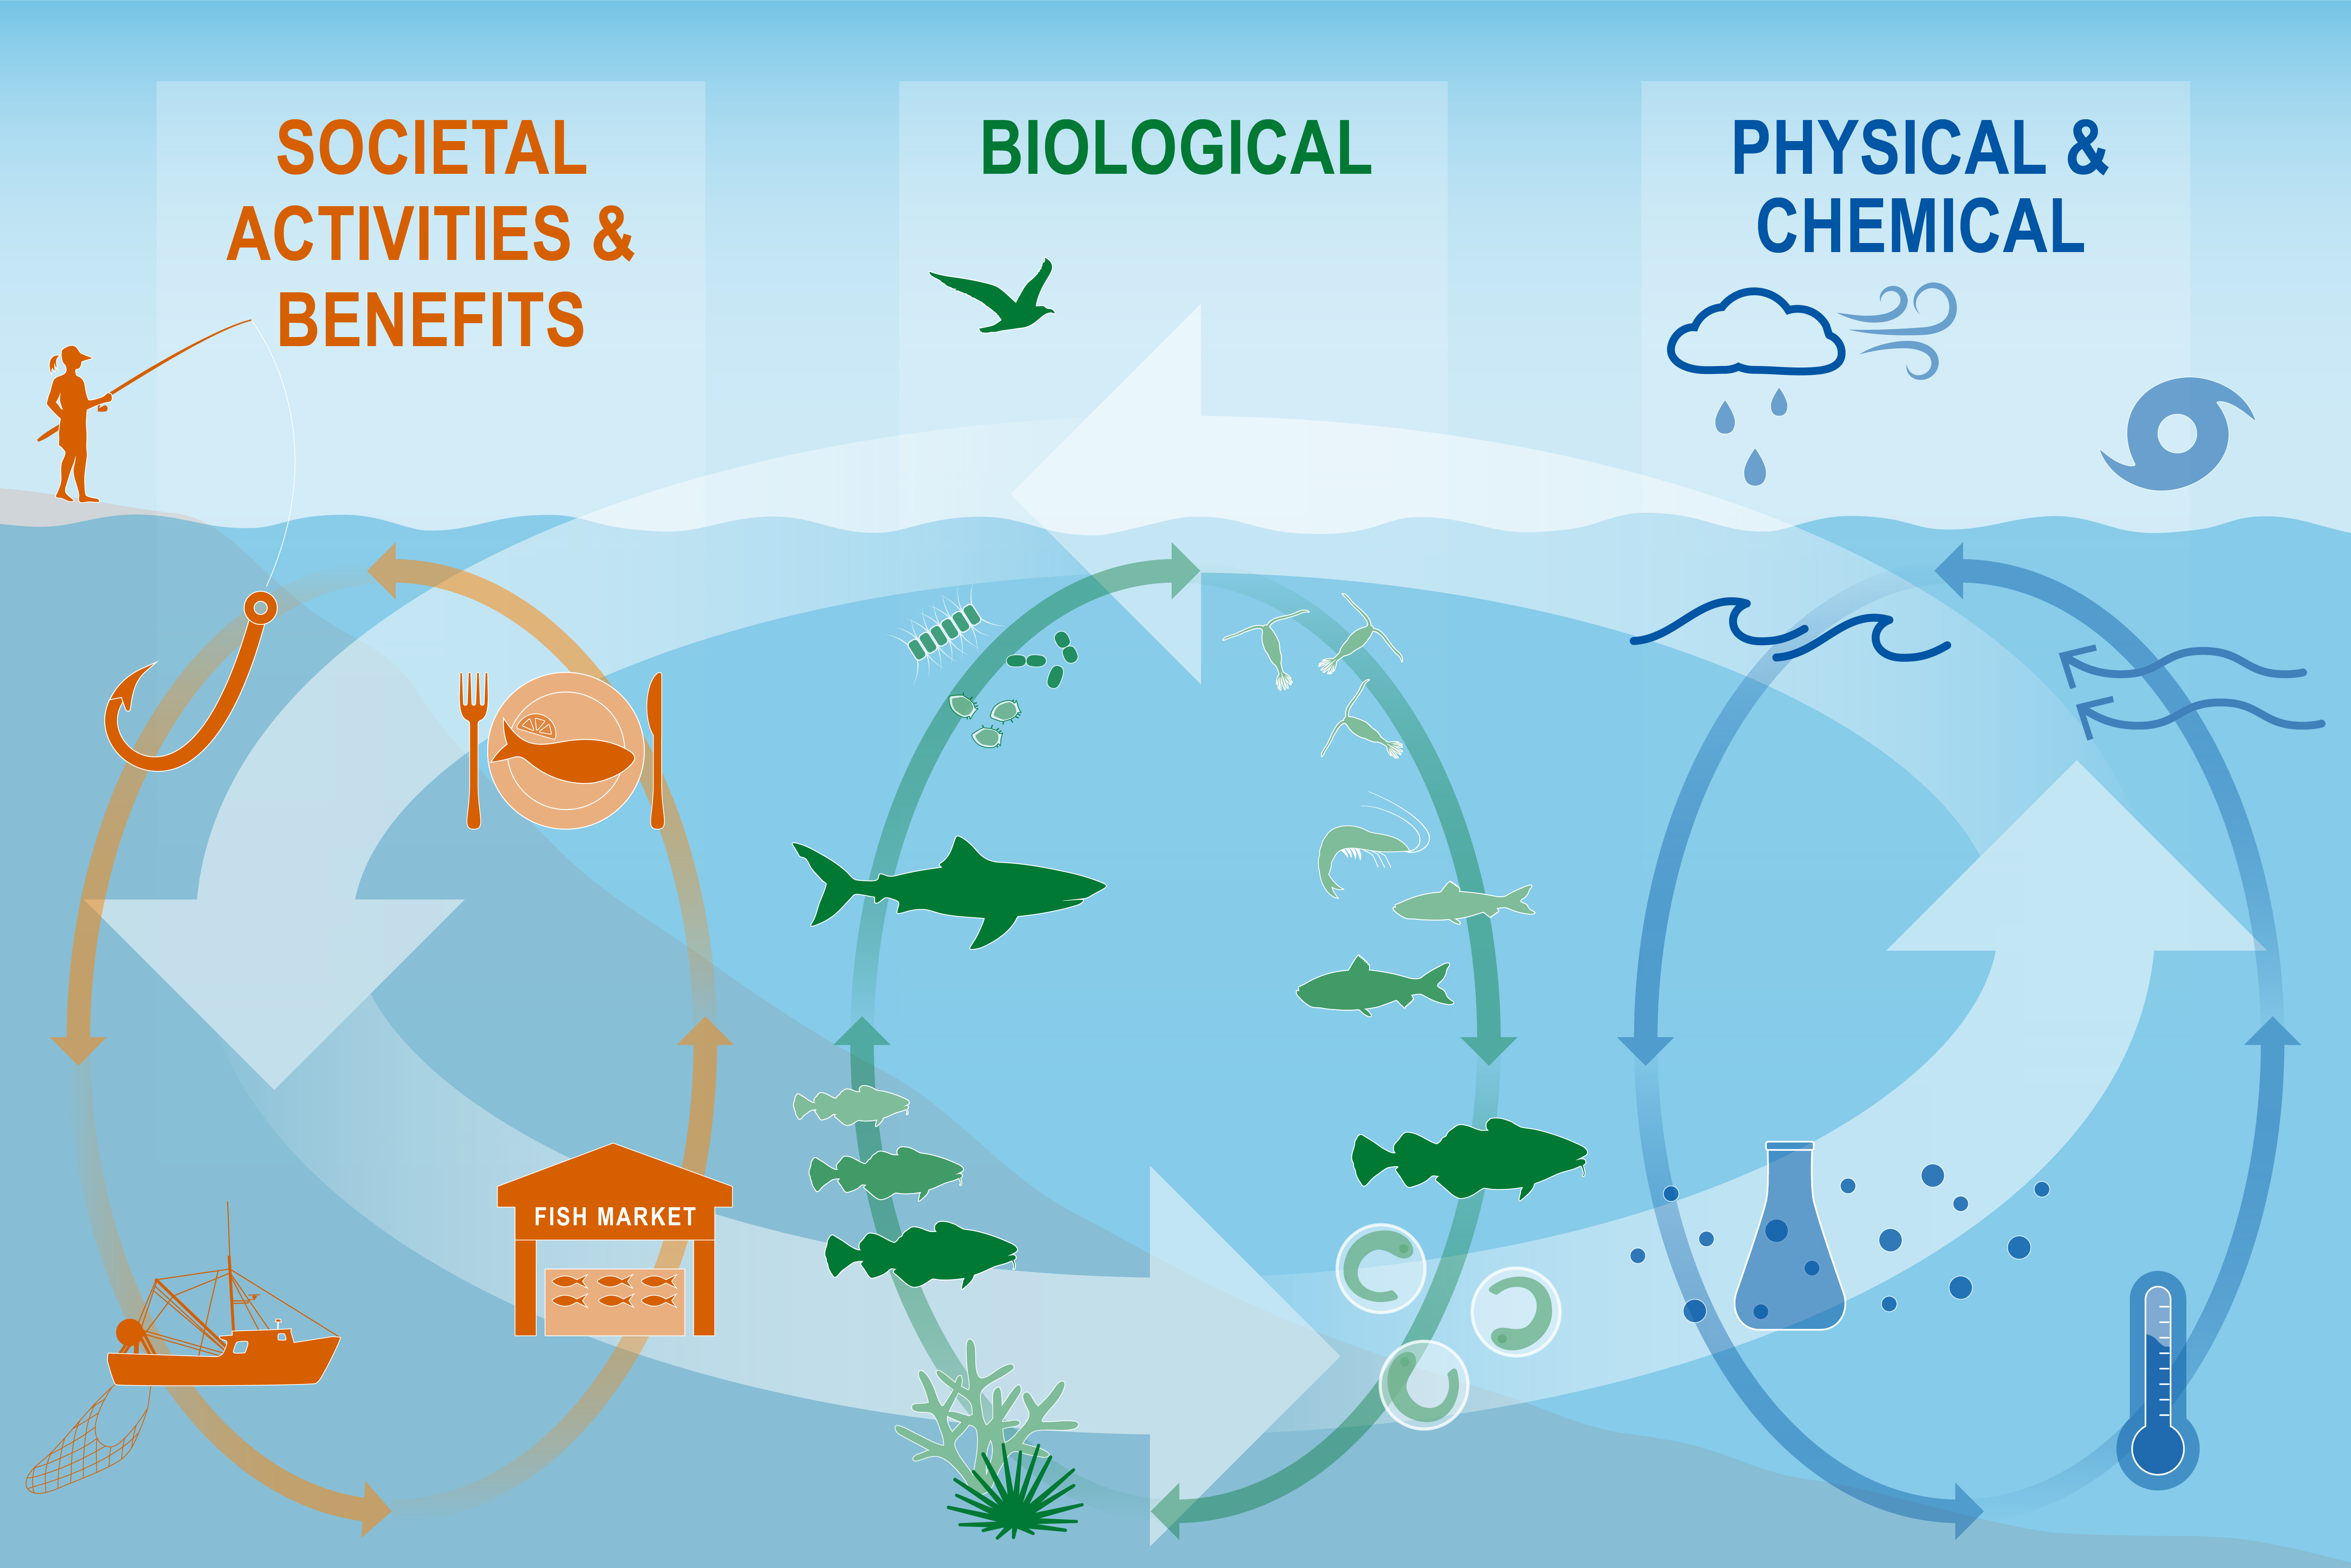 ] .pull-right[  ] --- ## Document Orientation .pull-left[ Spatial scale  A [glossary of terms](https://noaa-edab.github.io/tech-doc/glossary.html), detailed [technical methods documentation](https://NOAA-EDAB.github.io/tech-doc) and [indicator data](https://github.com/NOAA-EDAB/ecodata) are available online. ] .pull-right[ Key to figures <img src="20210804_ESR_Risk_Gaichas_files/figure-html/unnamed-chunk-17-1.png" width="396" style="display: block; margin: auto;" /> .contrib[ Trends assessed only for 30+ years: [more information](https://noaa-edab.github.io/tech-doc/trend-analysis.html) <p style="color:#FF8C00;">Orange line = significant increase</p> <p style="color:#9932CC;">Purple line = significant decrease</p> No color line = not significant or < 30 years <p style="background-color:#D3D3D3;">Grey background = last 10 years</p> ] ] --- ## Continuing dialogue with managers shapes report and indicators presented each year: 2021 Requests <table class="table" style="font-size: 9px; margin-left: auto; margin-right: auto;"> <thead> <tr> <th style="text-align:left;font-weight: bold;"> Request </th> <th style="text-align:right;font-weight: bold;"> Year </th> <th style="text-align:left;font-weight: bold;"> Source </th> <th style="text-align:left;font-weight: bold;"> Progress </th> <th style="text-align:left;font-weight: bold;"> Memo Section </th> </tr> </thead> <tbody> <tr> <td style="text-align:left;width: 8cm; "> Report card and summary visualizations </td> <td style="text-align:right;width: 1cm; "> 2019 </td> <td style="text-align:left;width: 2cm; "> Both Councils </td> <td style="text-align:left;width: 10cm; "> SOE new report card table and summary visualizaitions of synthesis themes </td> <td style="text-align:left;width: 2cm; "> 1 </td> </tr> <tr> <td style="text-align:left;width: 8cm; "> Ecosystem Overfishing indicators (Link and Watson, 2019) </td> <td style="text-align:right;width: 1cm; "> 2020 </td> <td style="text-align:left;width: 2cm; "> Both Councils </td> <td style="text-align:left;width: 10cm; "> SOE two ecosystem overfishing indicators included </td> <td style="text-align:left;width: 2cm; "> 2 </td> </tr> <tr> <td style="text-align:left;width: 8cm; "> Primary production required, interpretation of decline? </td> <td style="text-align:right;width: 1cm; "> 2020 </td> <td style="text-align:left;width: 2cm; "> Both Councils </td> <td style="text-align:left;width: 10cm; "> SOE indicator reworked along with Link and Watson metrics </td> <td style="text-align:left;width: 2cm; "> 3 </td> </tr> <tr> <td style="text-align:left;width: 8cm; "> Climate Change context </td> <td style="text-align:right;width: 1cm; "> 2020 </td> <td style="text-align:left;width: 2cm; "> NEFMC </td> <td style="text-align:left;width: 10cm; "> SOE reorganized; Risks section added emphasizing climate change </td> <td style="text-align:left;width: 2cm; "> 4 </td> </tr> <tr> <td style="text-align:left;width: 8cm; "> Clarify language (e.g., primary production required) </td> <td style="text-align:right;width: 1cm; "> 2020 </td> <td style="text-align:left;width: 2cm; "> Both Councils </td> <td style="text-align:left;width: 10cm; "> SOE edited by Research Communications Branch; glossary included </td> <td style="text-align:left;width: 2cm; "> 5 </td> </tr> <tr> <td style="text-align:left;width: 8cm; "> Copy Editing </td> <td style="text-align:right;width: 1cm; "> 2020 </td> <td style="text-align:left;width: 2cm; "> Both Councils </td> <td style="text-align:left;width: 10cm; "> SOE edited by Research Communications Branch </td> <td style="text-align:left;width: 2cm; "> 6 </td> </tr> <tr> <td style="text-align:left;width: 8cm; "> Ocean Acidification </td> <td style="text-align:right;width: 1cm; "> 2020 </td> <td style="text-align:left;width: 2cm; "> NEFMC </td> <td style="text-align:left;width: 10cm; "> SOE indicator added with in-situ data linked to preliminary lab work on thresholds </td> <td style="text-align:left;width: 2cm; "> 7 </td> </tr> <tr> <td style="text-align:left;width: 8cm; "> Include examples of High/Low engaged ports </td> <td style="text-align:right;width: 1cm; "> 2020 </td> <td style="text-align:left;width: 2cm; "> NEFMC </td> <td style="text-align:left;width: 10cm; "> SOE indicator reworked to show individual ports and social vulnerability </td> <td style="text-align:left;width: 2cm; "> 8 </td> </tr> <tr> <td style="text-align:left;width: 8cm; "> Expand wind lease area and habitat overlap </td> <td style="text-align:right;width: 1cm; "> 2020 </td> <td style="text-align:left;width: 2cm; "> MAFMC </td> <td style="text-align:left;width: 10cm; "> SOE indicator expanded to rank species with habitat in wind lease areas by landings in wind lease areas </td> <td style="text-align:left;width: 2cm; "> 9 </td> </tr> <tr> <td style="text-align:left;width: 8cm; "> Expand cold pool index </td> <td style="text-align:right;width: 1cm; "> 2020 </td> <td style="text-align:left;width: 2cm; "> MAFMC </td> <td style="text-align:left;width: 10cm; "> SOE indicator expanded with modeled data to include area and other attributes </td> <td style="text-align:left;width: 2cm; "> 10 </td> </tr> <tr> <td style="text-align:left;width: 8cm; "> Seperate Bigelow/Albatross catch diversity metric </td> <td style="text-align:right;width: 1cm; "> 2020 </td> <td style="text-align:left;width: 2cm; "> MAFMC </td> <td style="text-align:left;width: 10cm; "> SOE indicator added </td> <td style="text-align:left;width: 2cm; "> 11 </td> </tr> <tr> <td style="text-align:left;width: 8cm; "> Shark abundance and catch indicators </td> <td style="text-align:right;width: 1cm; "> 2020 </td> <td style="text-align:left;width: 2cm; "> MAFMC </td> <td style="text-align:left;width: 10cm; "> SOE multiple shark indicators added </td> <td style="text-align:left;width: 2cm; "> 12 </td> </tr> <tr> <td style="text-align:left;width: 8cm; "> Uncertainty estimates </td> <td style="text-align:right;width: 1cm; "> 2020 </td> <td style="text-align:left;width: 2cm; "> MAFMC </td> <td style="text-align:left;width: 10cm; "> SOE included for subset of indicators </td> <td style="text-align:left;width: 2cm; "> 13 </td> </tr> <tr> <td style="text-align:left;width: 8cm; "> Bycatch index </td> <td style="text-align:right;width: 1cm; "> 2020 </td> <td style="text-align:left;width: 2cm; "> NEFMC </td> <td style="text-align:left;width: 10cm; "> SOE added seal bycatch indicator, retained harbor porpoise indicator </td> <td style="text-align:left;width: 2cm; "> 14 </td> </tr> <tr> <td style="text-align:left;width: 8cm; "> Marine Mammal consumption </td> <td style="text-align:right;width: 1cm; "> 2019 </td> <td style="text-align:left;width: 2cm; "> MAFMC </td> <td style="text-align:left;width: 10cm; "> SOE added discussion of seal diets, memo no new consumption ests since Smith et al but could be in the future once work is complete </td> <td style="text-align:left;width: 2cm; "> 15 </td> </tr> <tr> <td style="text-align:left;width: 8cm; "> Estuarine Water Quality </td> <td style="text-align:right;width: 1cm; "> 2020 </td> <td style="text-align:left;width: 2cm; "> NEFMC </td> <td style="text-align:left;width: 10cm; "> SOE Chesapeake indicators updated and expanded </td> <td style="text-align:left;width: 2cm; "> 16 </td> </tr> <tr> <td style="text-align:left;width: 8cm; "> Forage abundance </td> <td style="text-align:right;width: 1cm; "> 2019 </td> <td style="text-align:left;width: 2cm; "> MAFMC </td> <td style="text-align:left;width: 10cm; "> SOE forage anomaly indicator added </td> <td style="text-align:left;width: 2cm; "> 17 </td> </tr> <tr> <td style="text-align:left;width: 8cm; "> Linking Condition </td> <td style="text-align:right;width: 1cm; "> 2020 </td> <td style="text-align:left;width: 2cm; "> MAFMC </td> <td style="text-align:left;width: 10cm; "> in progress; not ready for 2021 </td> <td style="text-align:left;width: 2cm; "> 18 </td> </tr> <tr> <td style="text-align:left;width: 8cm; "> Avg weight of diet components by feeding group </td> <td style="text-align:right;width: 1cm; "> 2019 </td> <td style="text-align:left;width: 2cm; "> Internal </td> <td style="text-align:left;width: 10cm; "> in progress; part of fish condition </td> <td style="text-align:left;width: 2cm; "> 19 </td> </tr> <tr> <td style="text-align:left;width: 8cm; "> Mean stomach weight across feeding guilds </td> <td style="text-align:right;width: 1cm; "> 2019 </td> <td style="text-align:left;width: 2cm; "> MAFMC </td> <td style="text-align:left;width: 10cm; "> in progress; stomach fullness analysis started--species level </td> <td style="text-align:left;width: 2cm; "> 20 </td> </tr> <tr> <td style="text-align:left;width: 8cm; "> Shellfish growth/distribution linked to climate (system productivity) </td> <td style="text-align:right;width: 1cm; "> 2019 </td> <td style="text-align:left;width: 2cm; "> MAFMC </td> <td style="text-align:left;width: 10cm; "> in progress; project with R Mann student to start 2021 </td> <td style="text-align:left;width: 2cm; "> 21 </td> </tr> <tr> <td style="text-align:left;width: 8cm; "> Cumulative weather index </td> <td style="text-align:right;width: 1cm; "> 2020 </td> <td style="text-align:left;width: 2cm; "> MAFMC </td> <td style="text-align:left;width: 10cm; "> in progress; data gathered for prototype </td> <td style="text-align:left;width: 2cm; "> 22 </td> </tr> <tr> <td style="text-align:left;width: 8cm; "> Management complexity </td> <td style="text-align:right;width: 1cm; "> 2019 </td> <td style="text-align:left;width: 2cm; "> MAFMC </td> <td style="text-align:left;width: 10cm; "> in progress; student work needs further analysis, no further work in 2020 </td> <td style="text-align:left;width: 2cm; "> 23 </td> </tr> <tr> <td style="text-align:left;width: 8cm; "> VAST and uncertainty </td> <td style="text-align:right;width: 1cm; "> 2020 </td> <td style="text-align:left;width: 2cm; "> Both Councils </td> <td style="text-align:left;width: 10cm; "> in progress; not ready for 2021 </td> <td style="text-align:left;width: 2cm; "> 24 </td> </tr> <tr> <td style="text-align:left;width: 8cm; "> Seal index </td> <td style="text-align:right;width: 1cm; "> 2020 </td> <td style="text-align:left;width: 2cm; "> MAFMC </td> <td style="text-align:left;width: 10cm; "> in progress; not ready for 2021 </td> <td style="text-align:left;width: 2cm; "> 25 </td> </tr> <tr> <td style="text-align:left;width: 8cm; "> Incorporate social sciences survey from council </td> <td style="text-align:right;width: 1cm; "> 2020 </td> <td style="text-align:left;width: 2cm; "> NEFMC </td> <td style="text-align:left;width: 10cm; "> unable to start in 2020 </td> <td style="text-align:left;width: 2cm; "> 26 </td> </tr> <tr> <td style="text-align:left;width: 8cm; "> Young of Year index from multiple surveys </td> <td style="text-align:right;width: 1cm; "> 2019 </td> <td style="text-align:left;width: 2cm; "> MAFMC </td> <td style="text-align:left;width: 10cm; "> unable to start in 2020 </td> <td style="text-align:left;width: 2cm; "> 27 </td> </tr> <tr> <td style="text-align:left;width: 8cm; "> Biomass of spp not included in BTS </td> <td style="text-align:right;width: 1cm; "> 2020 </td> <td style="text-align:left;width: 2cm; "> MAFMC </td> <td style="text-align:left;width: 10cm; "> unable to start in 2020 </td> <td style="text-align:left;width: 2cm; "> 28 </td> </tr> <tr> <td style="text-align:left;width: 8cm; "> Estuarine condition relative to power plants and temp </td> <td style="text-align:right;width: 1cm; "> 2019 </td> <td style="text-align:left;width: 2cm; "> MAFMC </td> <td style="text-align:left;width: 10cm; "> unable to start in 2020 </td> <td style="text-align:left;width: 2cm; "> 29 </td> </tr> <tr> <td style="text-align:left;width: 8cm; "> Inflection points for indicators </td> <td style="text-align:right;width: 1cm; "> 2019 </td> <td style="text-align:left;width: 2cm; "> Both Councils </td> <td style="text-align:left;width: 10cm; "> unable to start in 2020 </td> <td style="text-align:left;width: 2cm; "> 30 </td> </tr> <tr> <td style="text-align:left;width: 8cm; "> Reduce indicator dimensionality with multivariate statistics </td> <td style="text-align:right;width: 1cm; "> 2020 </td> <td style="text-align:left;width: 2cm; "> NEFMC </td> <td style="text-align:left;width: 10cm; "> unable to start in 2020 </td> <td style="text-align:left;width: 2cm; "> 31 </td> </tr> <tr> <td style="text-align:left;width: 8cm; "> Breakpoints </td> <td style="text-align:right;width: 1cm; "> 2020 </td> <td style="text-align:left;width: 2cm; "> NEFMC </td> <td style="text-align:left;width: 10cm; "> unable to start in 2020 </td> <td style="text-align:left;width: 2cm; "> 32 </td> </tr> <tr> <td style="text-align:left;width: 8cm; "> Re-evaluate EPUs </td> <td style="text-align:right;width: 1cm; "> 2020 </td> <td style="text-align:left;width: 2cm; "> NEFMC </td> <td style="text-align:left;width: 10cm; "> unable to start in 2020 </td> <td style="text-align:left;width: 2cm; "> 33 </td> </tr> </tbody> </table> --- ## Mid-Atlantic EAFM next steps: management strategy evaluation .pull-left-40[ * Technical working group with similar approach and membership as used in conceptual model process + Diverse interdisciplinary and inter-agency membership – additional MSE expertise + Independent facilitator from outside the region * Introductory MSE workshop September 2020 + Joint federal and state management advisory panels + Stakeholdrs likely to participate in MSE process + Introduced MSE process, concepts, expectations + Simulated stakeholder workshop to understand participant role * Online stakeholder feedback form January 2021 ] .pull-right-60[  ] --- ## MSE approach and timeline .pull-left-40[ Stakeholder workshops * Regional public workshops (virtual; March-April 2021) * Core stakeholder group selected from combined feedback * W1: two virtual - Identify management objectives (14 June 2021) - Identify performance metrics and uncertainties (14 July 2021) * W2: Input on initial model development and results (October-November 2021) * W3: Review updated model and “final” results (Spring 2022) Iterative process with Committees/Council/Board ] .pull-right-60[  ]