class: right, middle, my-title, title-slide # State of the Ecosystem: 2021 Overview ## OneNOAA Seminar 04 May 2021 ### Kimberly Bastille<sup>1,2</sup> <br /> <br /> Sarah Gaichas<sup>1</sup>, Sean Lucey<sup>1</sup>, <br /> Geret DePiper<sup>1</sup>, Kimberly Hyde<sup>1</sup>, and Scott Large<sup>1</sup> <br /> <br /> <br /> Northeast Fisheries Science Center<sup>1</sup> <br /> Ocean Associates Inc.<sup>2</sup> --- class: top, left <style> p.caption { font-size: 0.6em; } </style> # State of the Ecosystem (SOE) reporting ## Improving ecosystem information and synthesis for fishery managers using Integrated Ecosystem Assessment Approach (IEA) .pull-left[ <br /> - Ecosystem indicators linked to management objectives <a name=cite-depiper_operationalizing_2017></a>([DePiper, et al., 2017](https://academic.oup.com/icesjms/article/74/8/2076/3094701)) + Report evolving since 2016 + Contextual information + Fishery-relevant subset of full Ecosystem Status Reprorts - Open science emphasis <a name=cite-bastille_improving_2020></a>([Bastille, et al., 2020](https://doi.org/10.1080/08920753.2021.1846155)) ] .pull-right[ *The IEA Loop<sup>1</sup>* 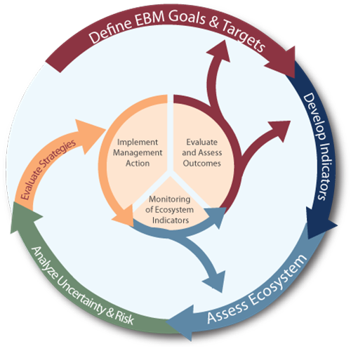 .footnote[ [1] https://www.integratedecosystemassessment.noaa.gov/national/IEA-approach ] ] --- ## State of the Ecosystem: Updated structure .pull-left[ ## 2020 Report 1. Summary 2 pager 1. Human dimensions 1. Protected species 1. Fish and invertebrates (managed and otherwise) 1. Habitat quality and ecosystem productivity ## 2021 Report 1. Graphical summary + Page 1 report card re: objectives → + Page 2 risk summary bullets + Page 3 synthesis themes 1. Performance relative to management objectives 1. Risks to meeting management objectives ] .pull-right[ <table class="table" style="font-size: 14px; margin-left: auto; margin-right: auto;"> <caption style="font-size: initial !important;">Example ecosystem-scale fishery management objectives</caption> <thead> <tr> <th style="text-align:left;font-weight: bold;"> Objective Categories </th> <th style="text-align:left;font-weight: bold;"> Indicators reported here </th> </tr> </thead> <tbody> <tr grouplength="6"><td colspan="2" style="border-bottom: 1px solid;"><strong>Provisioning and Cultural Services</strong></td></tr> <tr> <td style="text-align:left;padding-left: 2em;" indentlevel="1"> Seafood Production </td> <td style="text-align:left;"> Landings; commercial total and by feeding guild; recreational harvest </td> </tr> <tr> <td style="text-align:left;padding-left: 2em;" indentlevel="1"> Profits </td> <td style="text-align:left;"> Revenue decomposed to price and volume </td> </tr> <tr> <td style="text-align:left;padding-left: 2em;" indentlevel="1"> Recreation </td> <td style="text-align:left;"> Days fished; recreational fleet diversity </td> </tr> <tr> <td style="text-align:left;padding-left: 2em;" indentlevel="1"> Stability </td> <td style="text-align:left;"> Diversity indices (fishery and ecosystem) </td> </tr> <tr> <td style="text-align:left;padding-left: 2em;" indentlevel="1"> Social & Cultural </td> <td style="text-align:left;"> Community engagement/reliance status </td> </tr> <tr> <td style="text-align:left;padding-left: 2em;" indentlevel="1"> Protected Species </td> <td style="text-align:left;"> Bycatch; population (adult and juvenile) numbers, mortalities </td> </tr> <tr grouplength="4"><td colspan="2" style="border-bottom: 1px solid;"><strong>Supporting and Regulating Services</strong></td></tr> <tr> <td style="text-align:left;padding-left: 2em;" indentlevel="1"> Biomass </td> <td style="text-align:left;"> Biomass or abundance by feeding guild from surveys </td> </tr> <tr> <td style="text-align:left;padding-left: 2em;" indentlevel="1"> Productivity </td> <td style="text-align:left;"> Condition and recruitment of managed species, Primary productivity </td> </tr> <tr> <td style="text-align:left;padding-left: 2em;" indentlevel="1"> Trophic structure </td> <td style="text-align:left;"> Relative biomass of feeding guilds, Zooplankton </td> </tr> <tr> <td style="text-align:left;padding-left: 2em;" indentlevel="1"> Habitat </td> <td style="text-align:left;"> Estuarine and offshore habitat conditions </td> </tr> </tbody> </table> ] --- ## Report card page 1 and 2 .pull-left[ .center[ 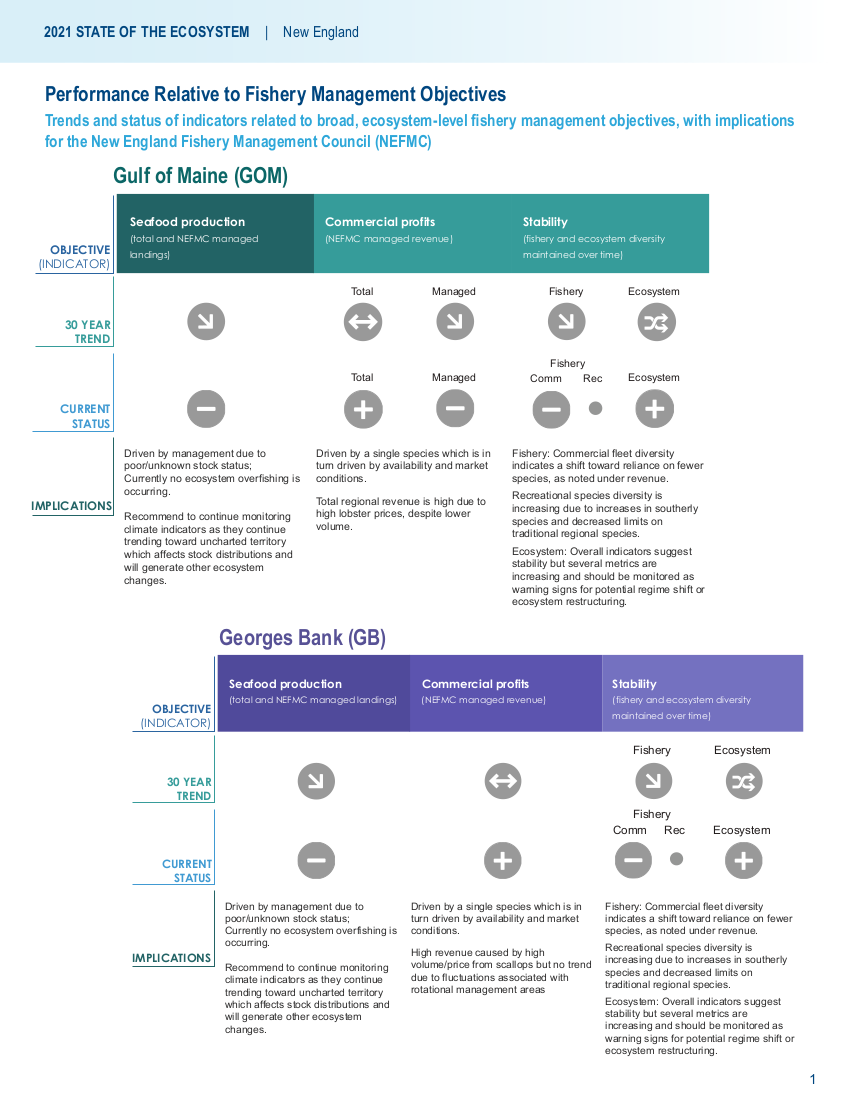 ] ] .pull-right[ .center[ 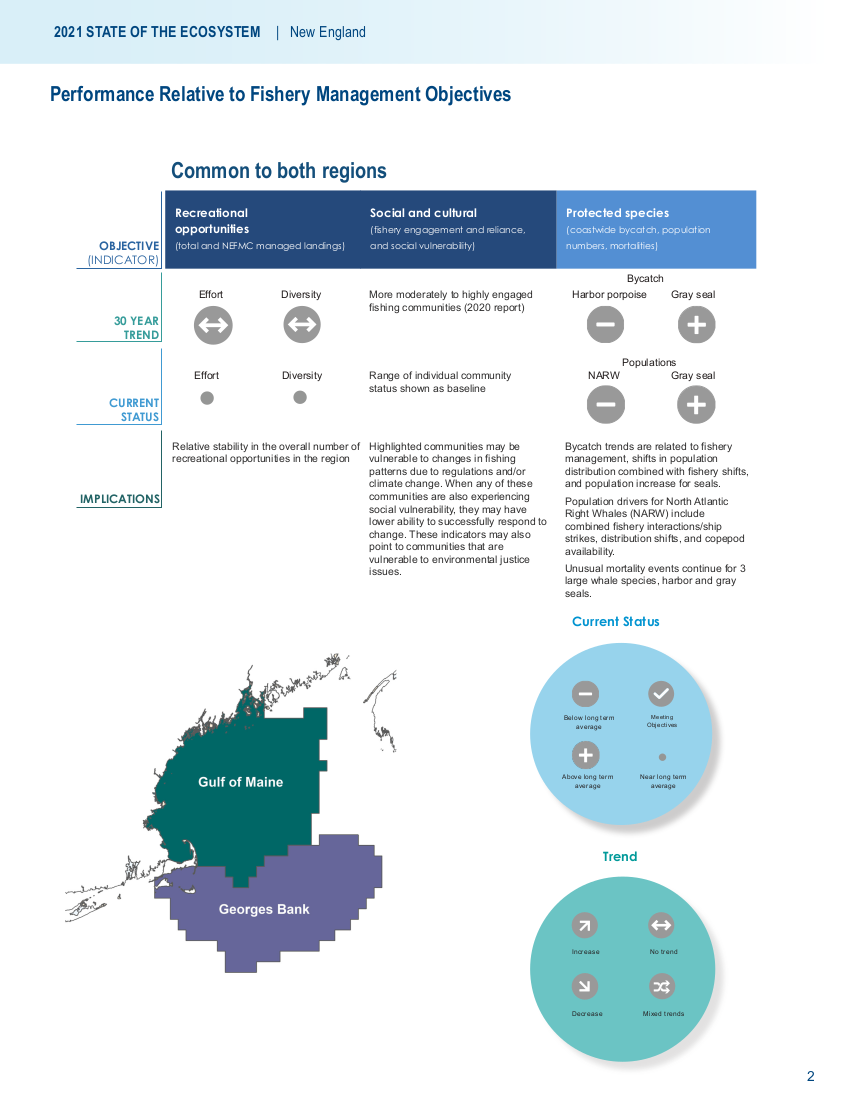 ] ] --- ## Risk summary bullets page 3 .center[ 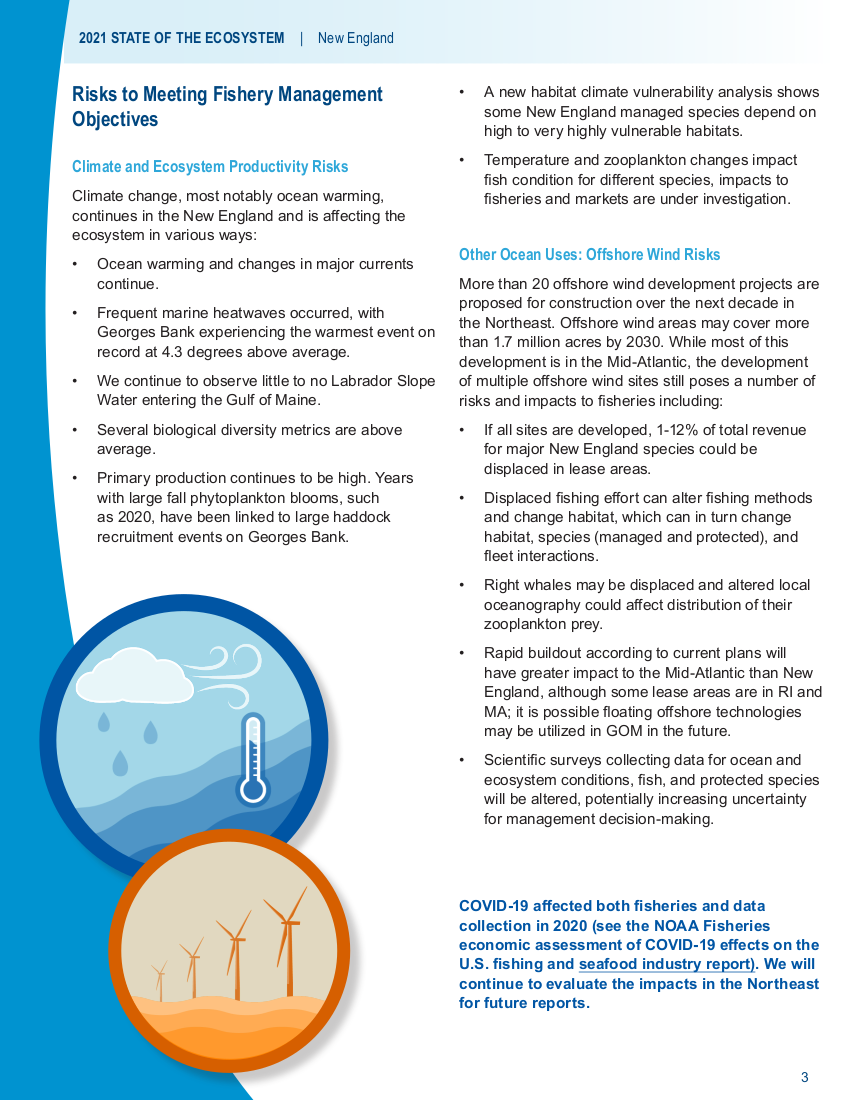 ] --- ## Graphical summary of ecosystem synthesis themes, page 4 Characterizing ecosystem change for fishery management * Societal, biological, physical and chemical factors comprise the **multiple system drivers** that influence marine ecosystems through a variety of different pathways. * Changes in the multiple drivers can lead to **regime shifts** — large, abrupt and persistent changes in the structure and function of an ecosystem. * Regime shifts and changes in how the multiple system drivers interact can result in **ecosystem reorganization** as species and humans respond and adapt to the new environment. .pull-left[ 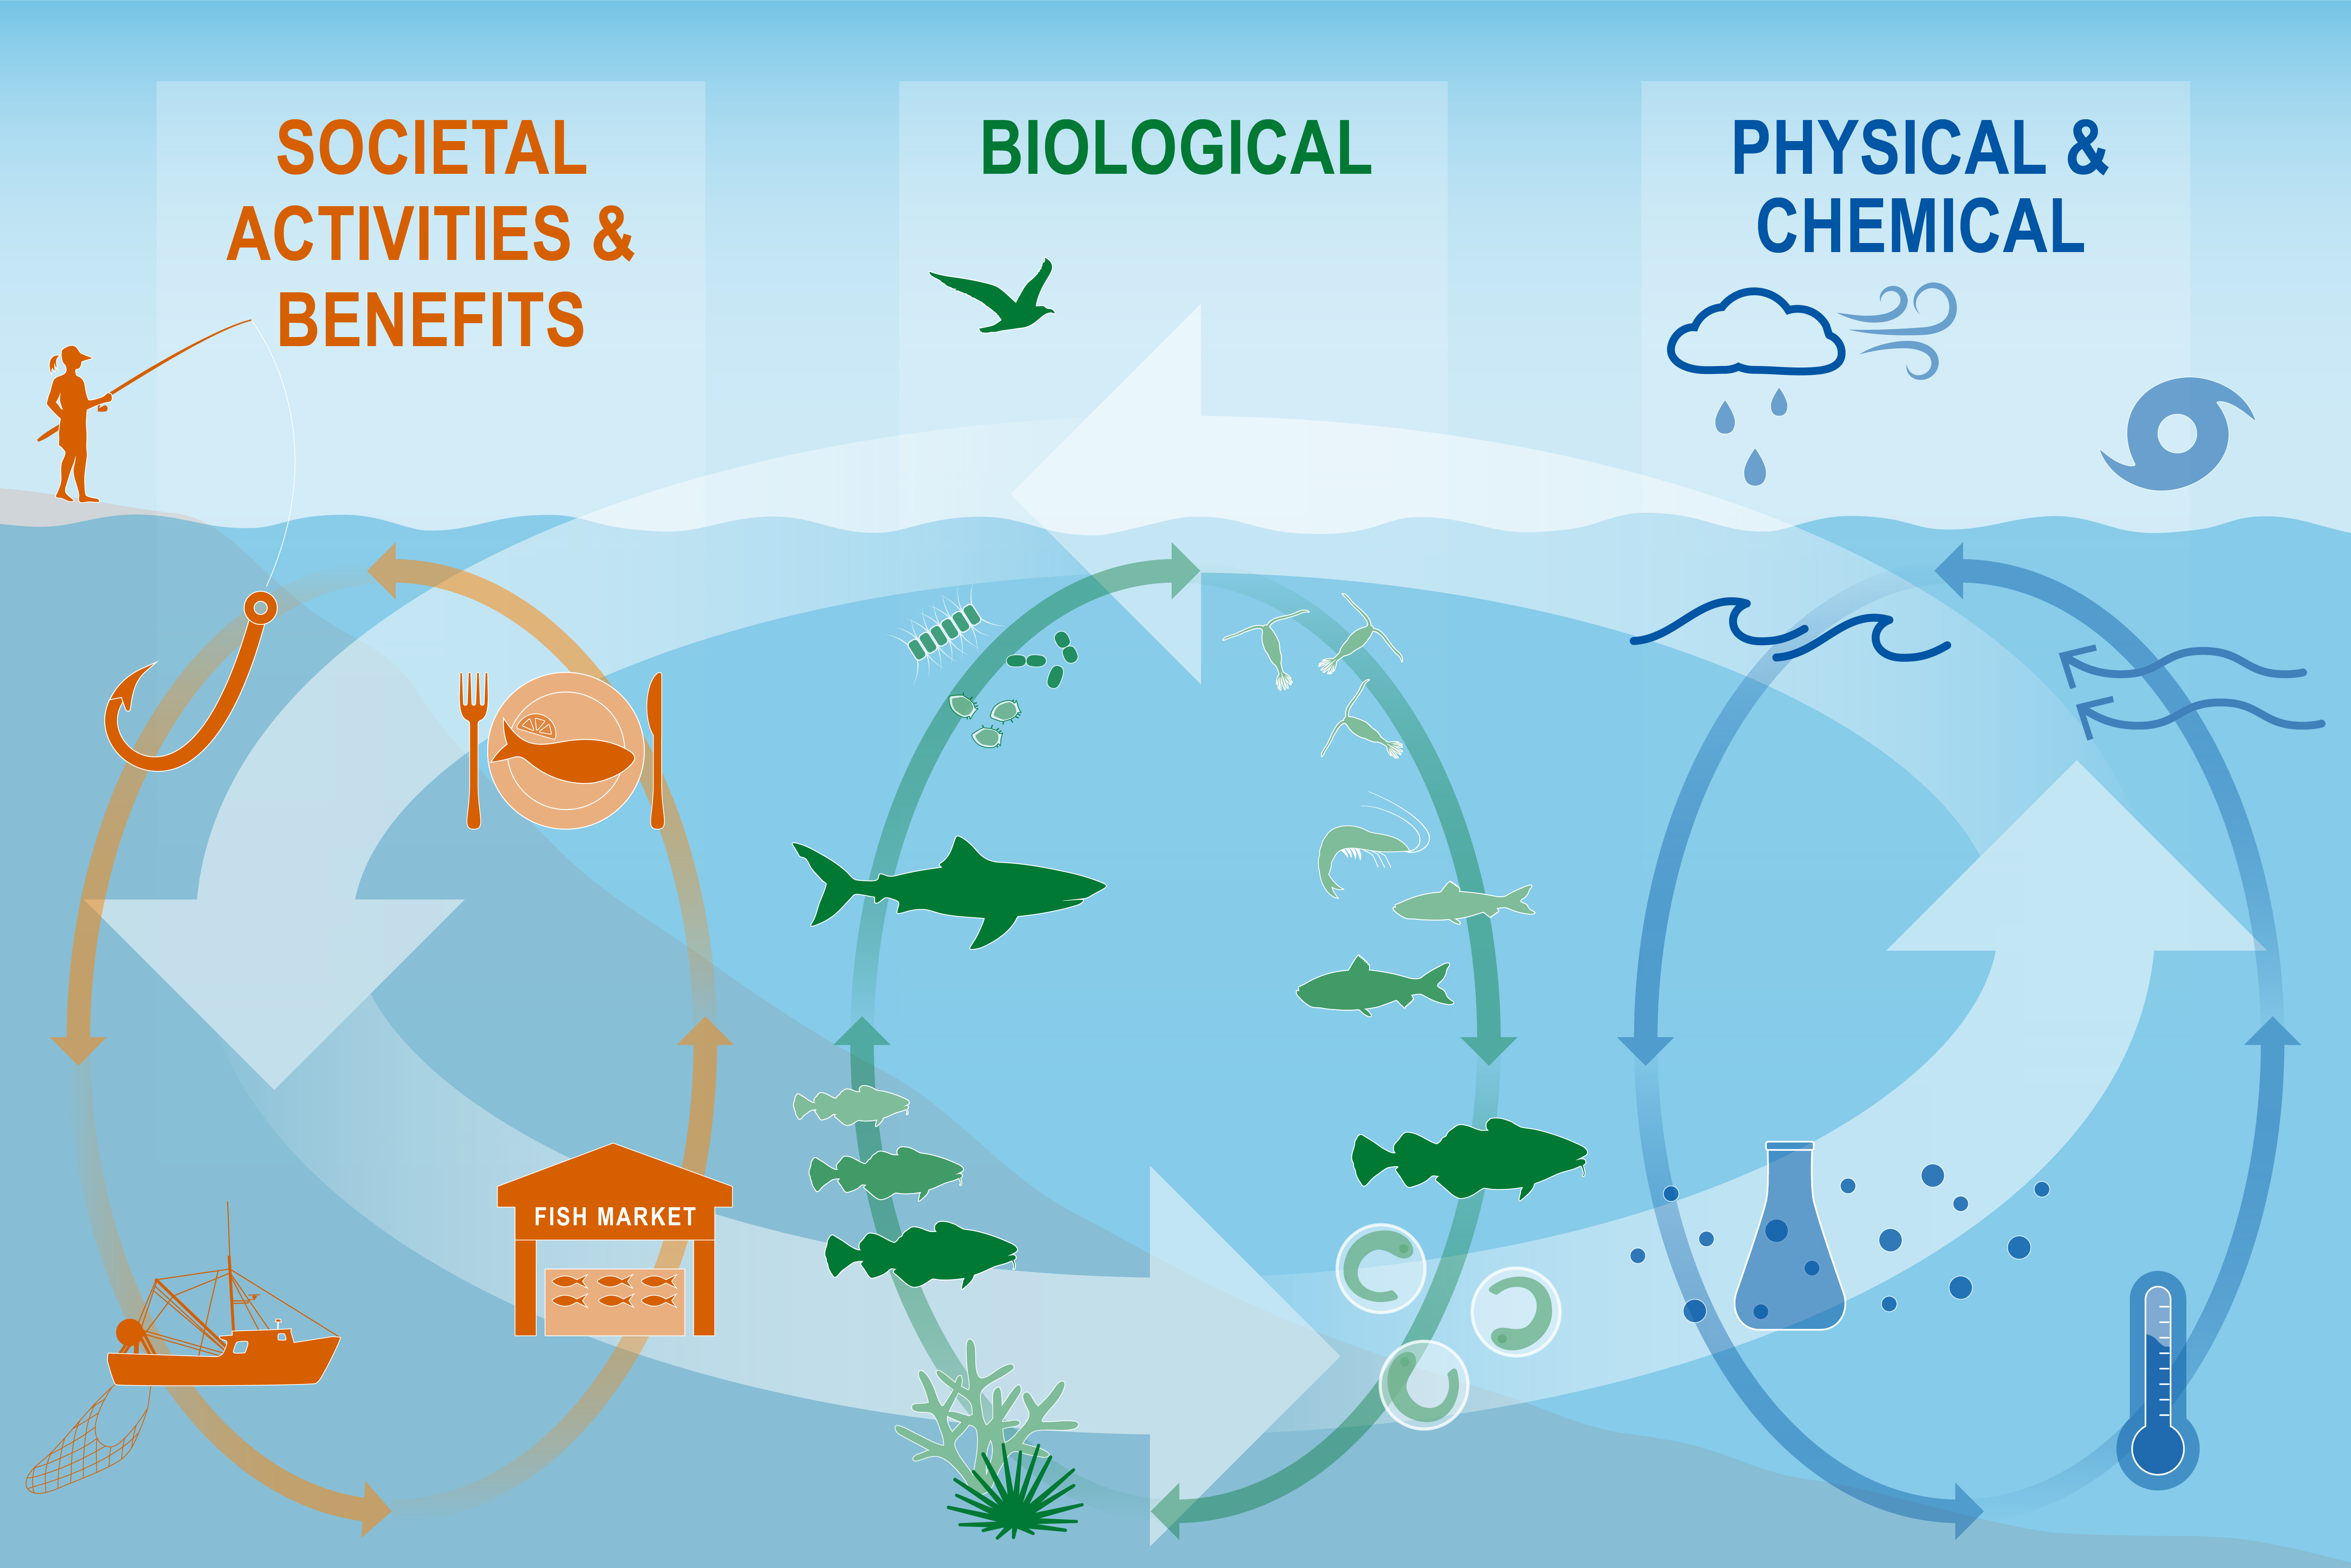 ] .pull-right[ 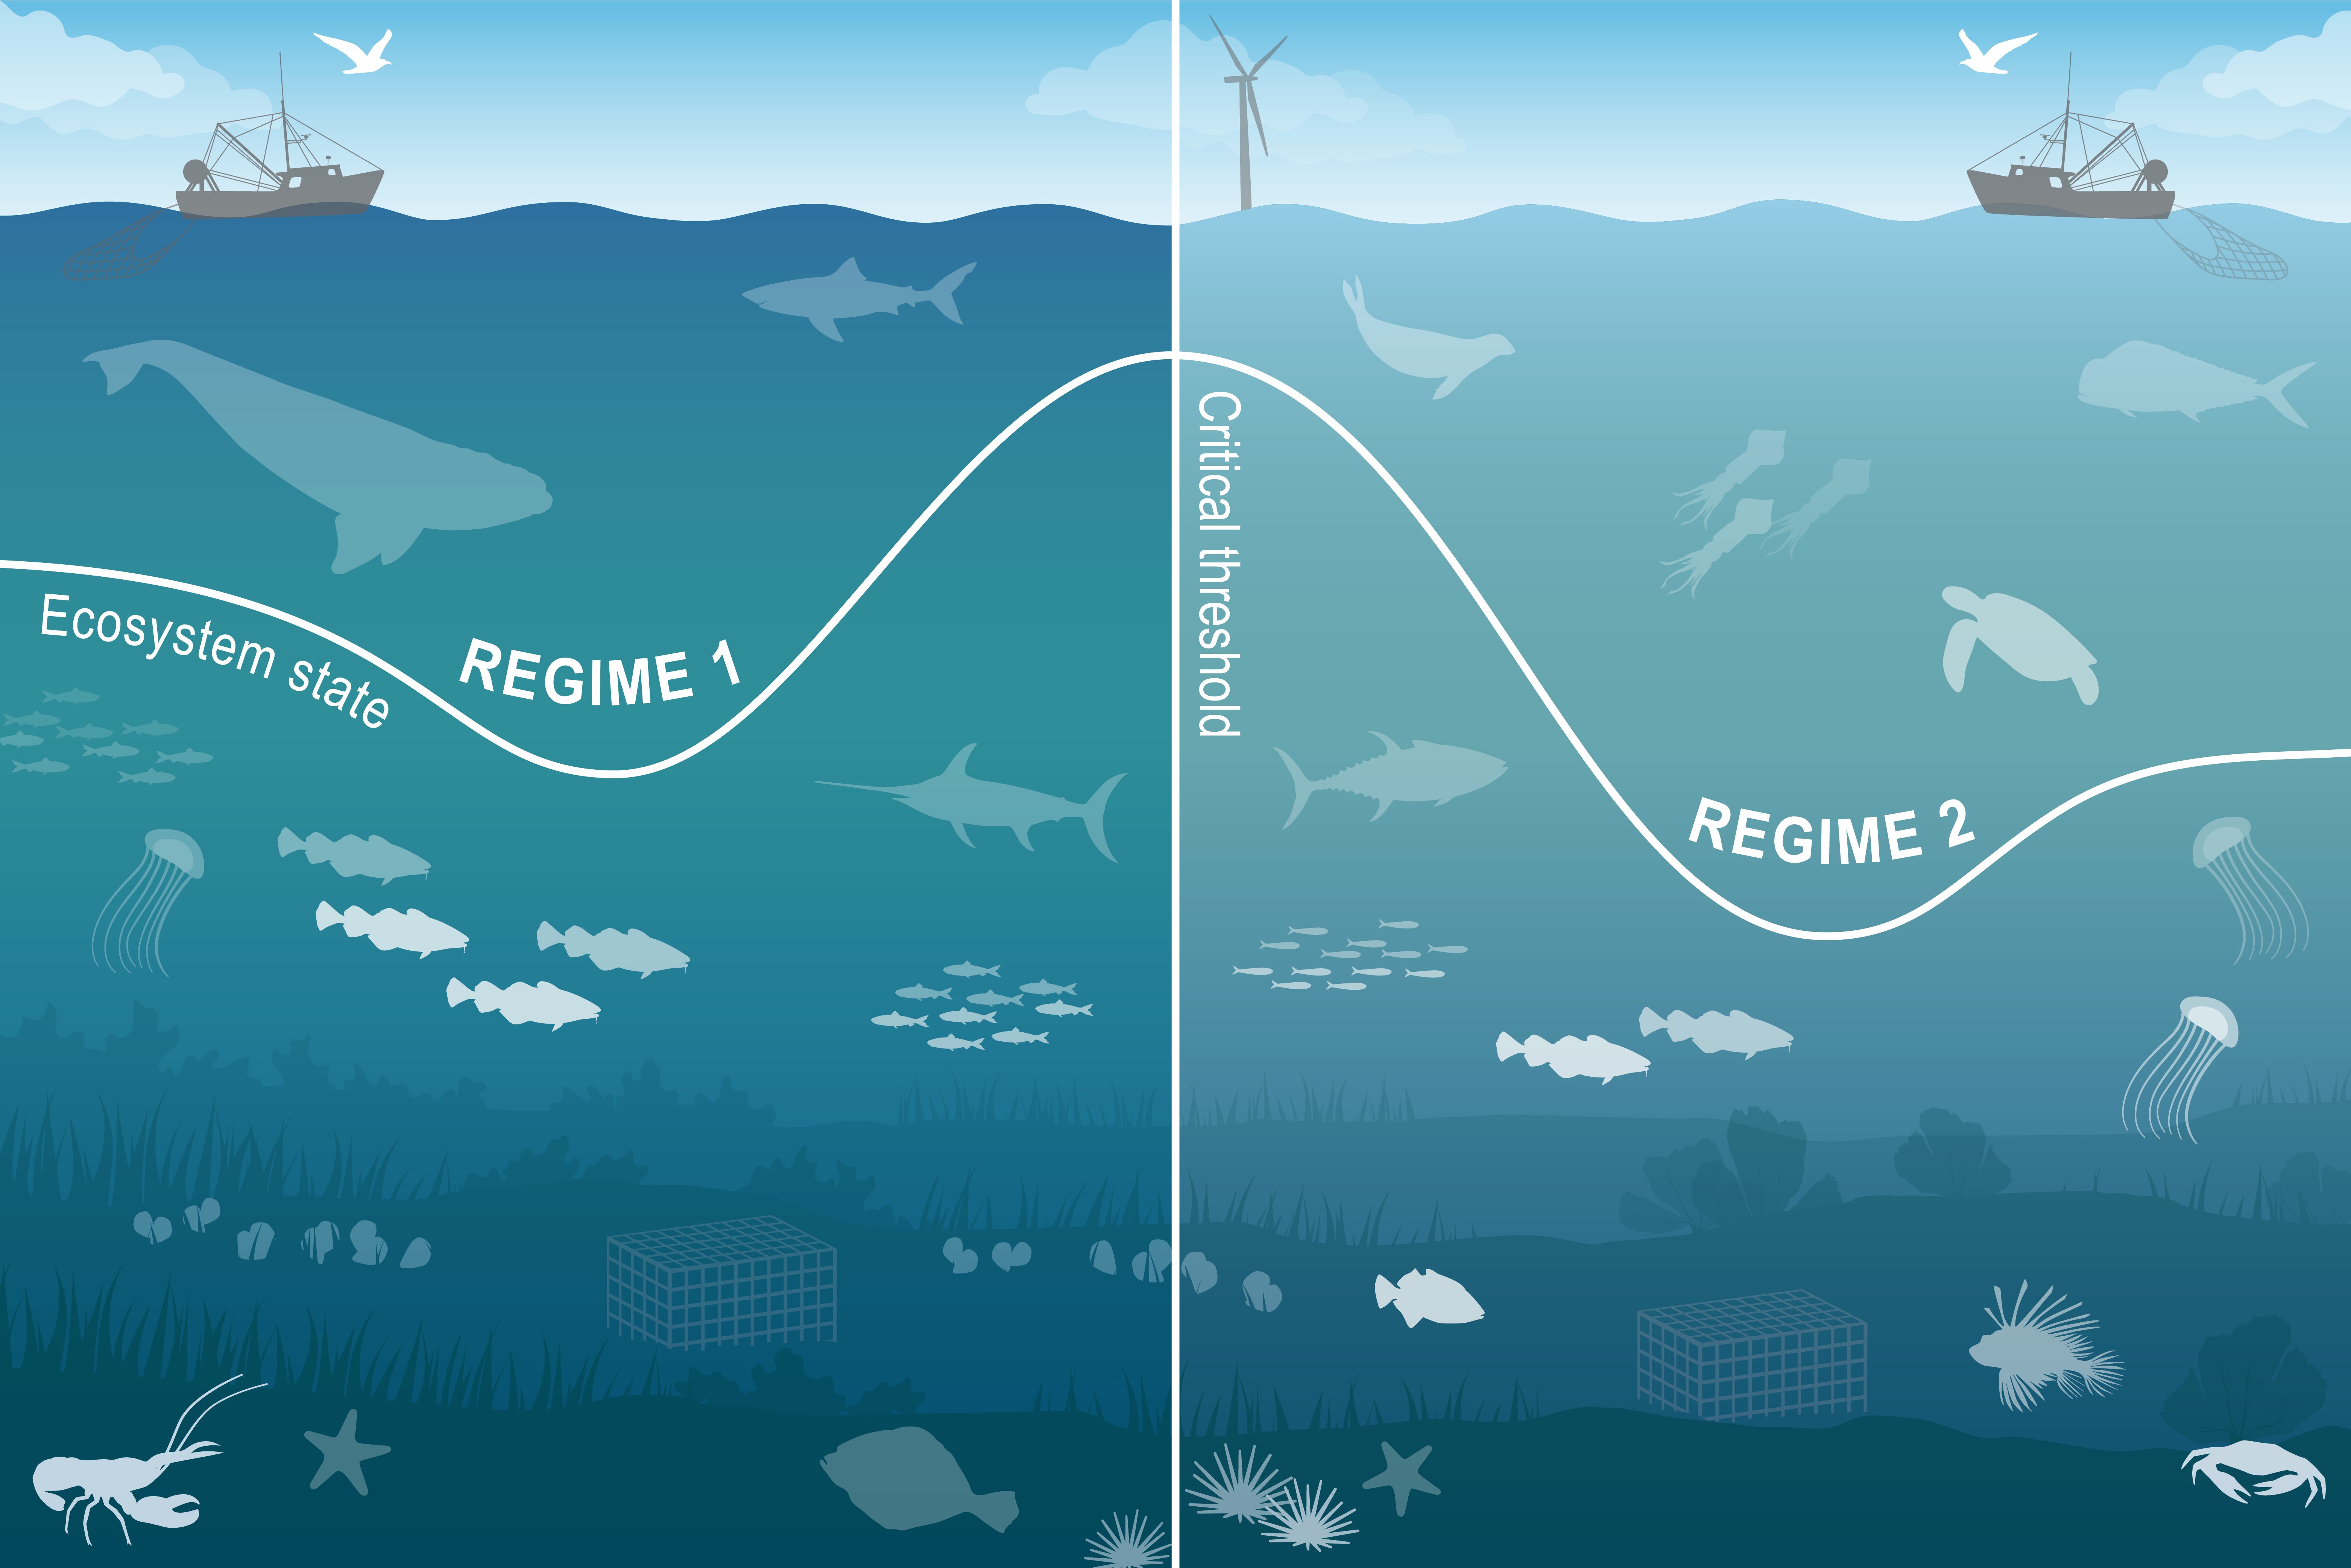 ] --- ## Document Orientation .pull-left[ Spatial scale 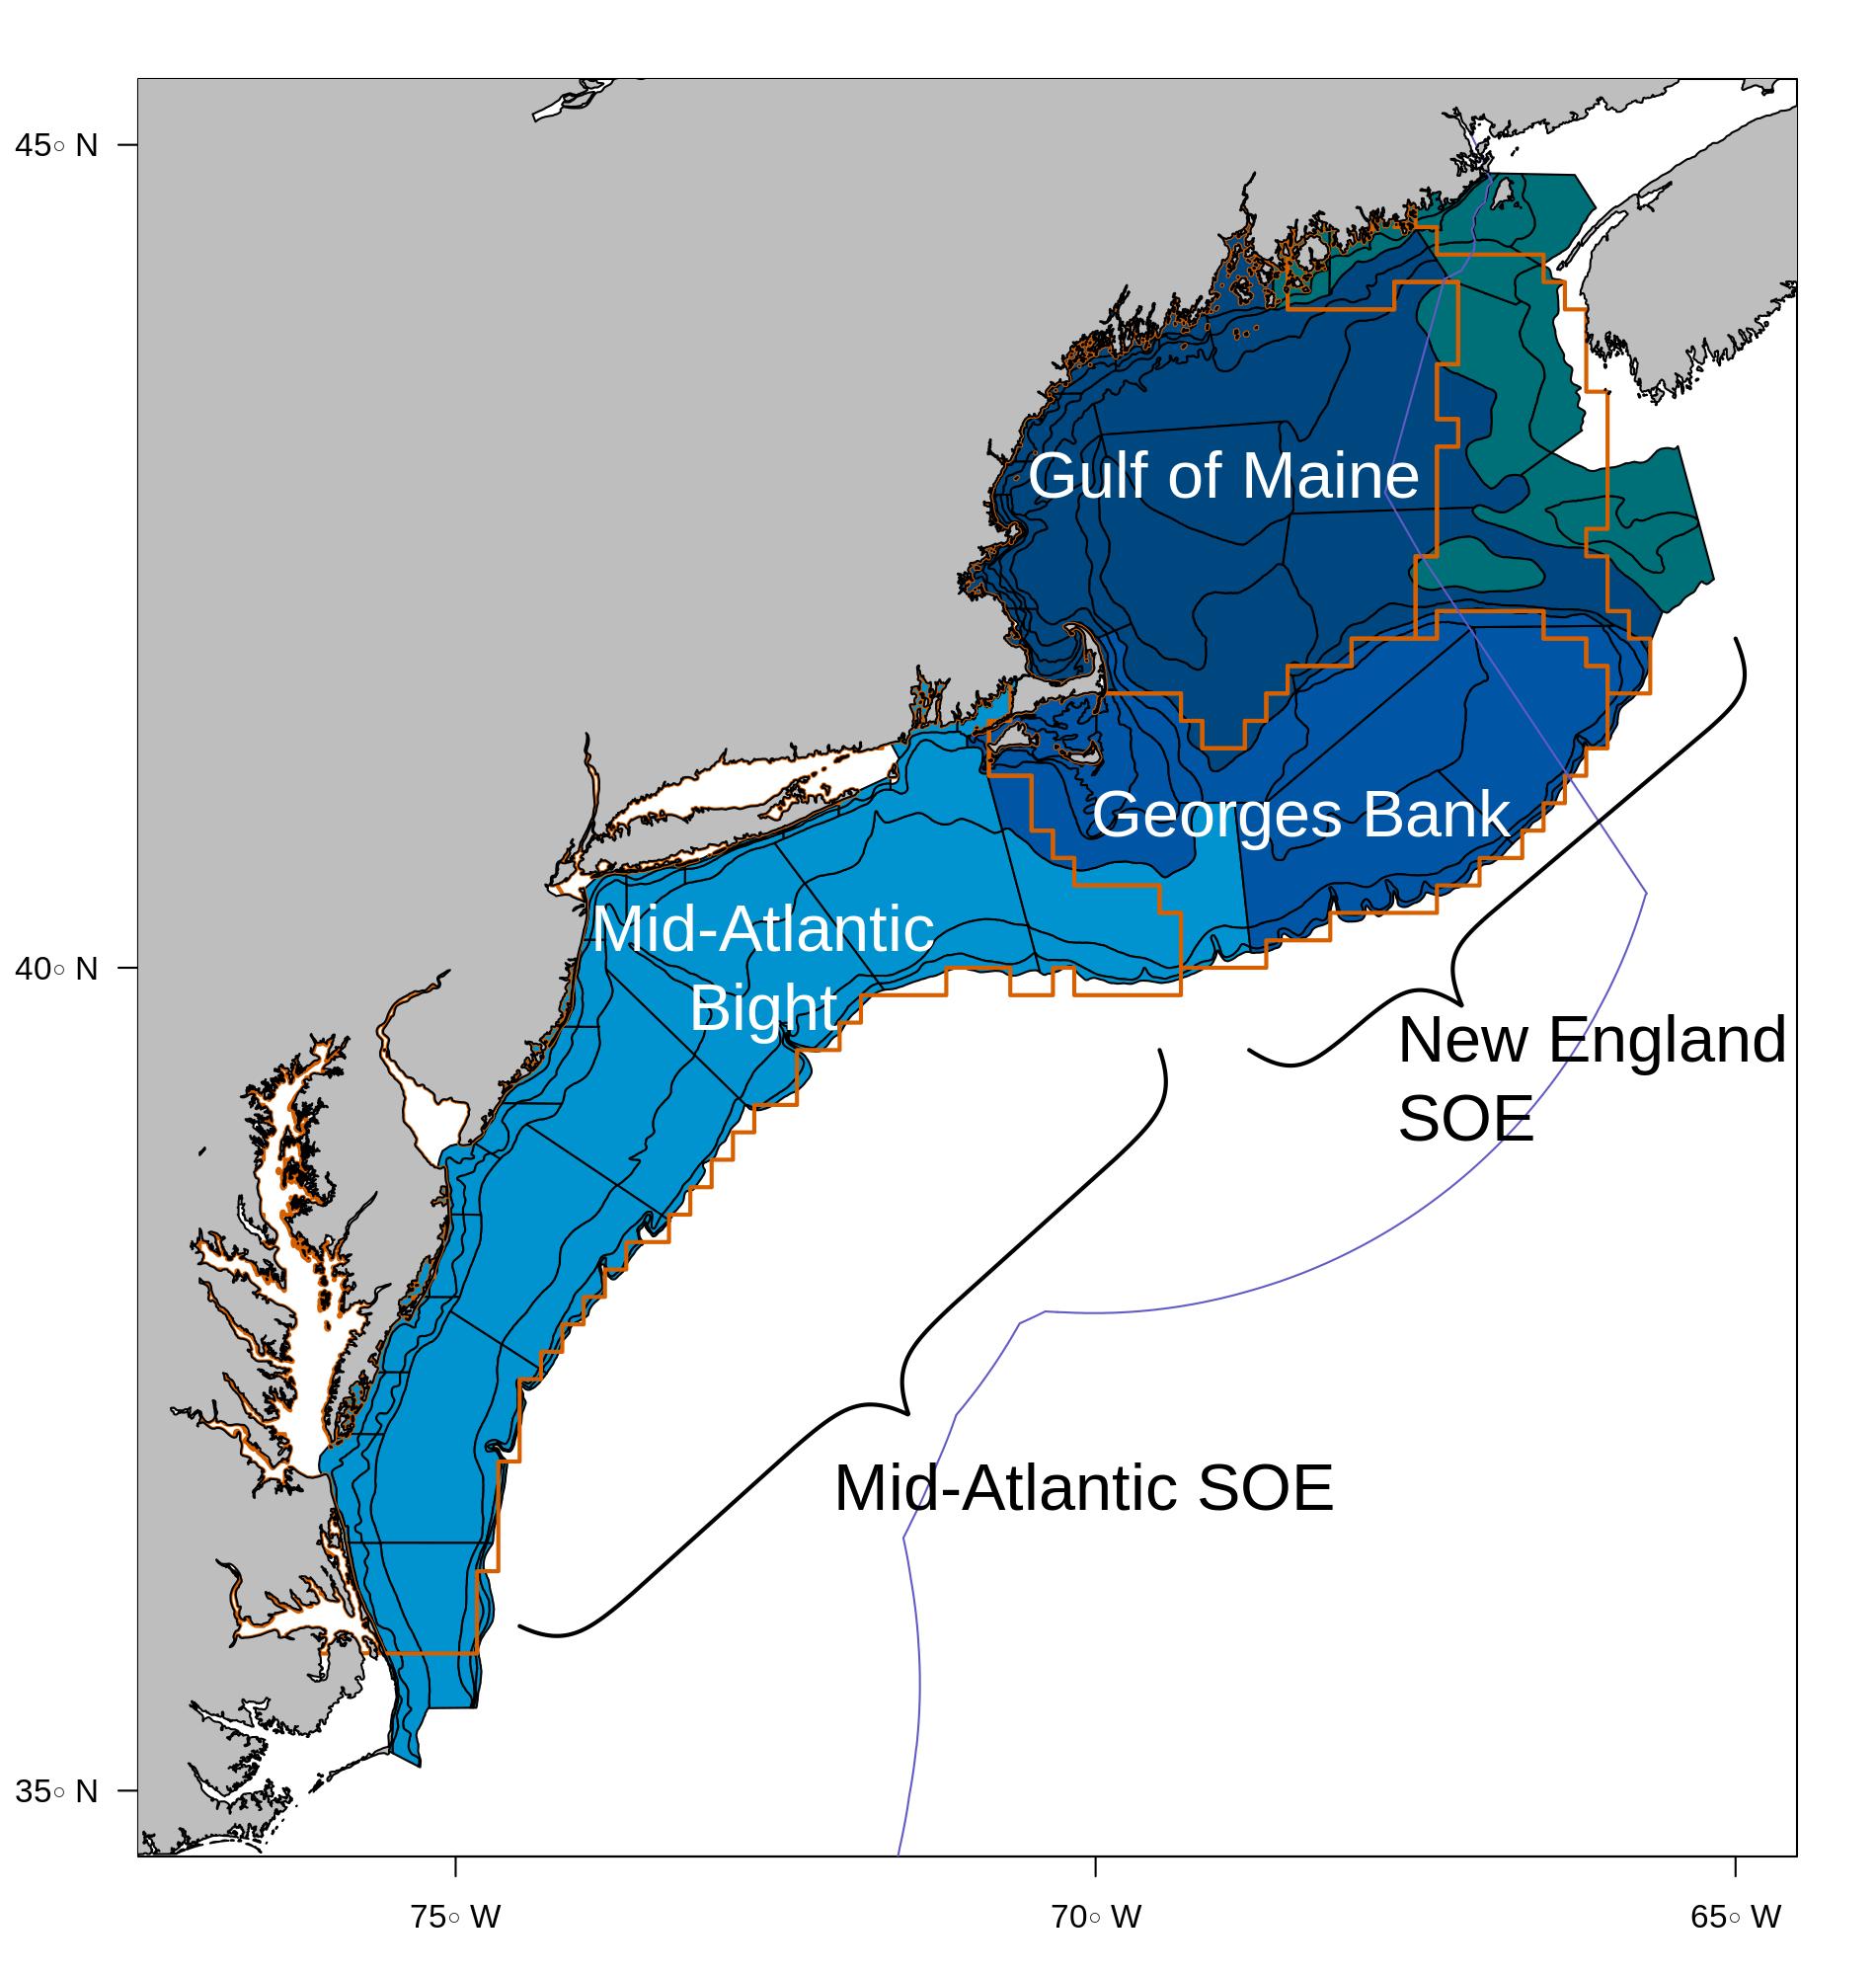 A [glossary of terms](https://noaa-edab.github.io/tech-doc/glossary.html), detailed [technical methods documentation](https://NOAA-EDAB.github.io/tech-doc) and [indicator data](https://github.com/NOAA-EDAB/ecodata) are available online. ] .pull-right[ Key to figures <img src="20210504_OneNOAA_Bastille_files/figure-html/unnamed-chunk-5-1.png" width="396" style="display: block; margin: auto;" /> .contrib[ Trends assessed only for 30+ years: [more information](https://noaa-edab.github.io/tech-doc/trend-analysis.html) <p style="color:#FF8C00;">Orange line = significant increase</p> <p style="color:#9932CC;">Purple line = significant decrease</p> No color line = not significant or < 30 years <p style="background-color:#D3D3D3;">Grey background = last 10 years</p> ] ] --- # Performance relative to management objectives .center[      ] --- ## Objective: Seafood production   *Mid-Atlantic* .pull-left[ ### Indicators: Commercial and Recreational Landings * Surfclams/Ocean quahogs driving decline * Likely market driven <img src="20210504_OneNOAA_Bastille_files/figure-html/unnamed-chunk-7-1.png" width="504" style="display: block; margin: auto;" /> .contrib[ Key: Black = Total Landings; <p style="color:#FF6A6A;">Red = Landings of MAFMC managed species</p> ] ] .pull-right[ <br /> <br /> * Multiple Drivers of recreational decline - Shark management and possibly survey methodology change <img src="20210504_OneNOAA_Bastille_files/figure-html/unnamed-chunk-8-1.png" width="504" style="display: block; margin: auto;" /> ] --- ## Objective: Commercial Profits  *New England* ### Indicators: Revenue and Bennet Index of Price and Volume .pull-left[ <img src="20210504_OneNOAA_Bastille_files/figure-html/unnamed-chunk-10-1.png" width="576" style="display: block; margin: auto;" /> .contrib[ Key: Black = Revenue of all species combined; <p style="color:#FF6A6A;">Red = Revenue of NEFMC managed species</p> ] * Driven by single species. * GB: Fluctuations associated with rotational management areas. * GB: High revenue caused by high volume/price from scallops. ] .pull-right[ <img src="20210504_OneNOAA_Bastille_files/figure-html/unnamed-chunk-11-1.png" width="576" style="display: block; margin: auto;" /> * GOM: Total regional revenue high due to high lobster prices, despite lower volume. ] --- ## Objective: Recreation  ;   *Mid-Atlantic* #### Indicators: Recreational effort and diversity .pull-left[ <img src="20210504_OneNOAA_Bastille_files/figure-html/unnamed-chunk-13-1.png" width="504" style="display: block; margin: auto;" /> <img src="20210504_OneNOAA_Bastille_files/figure-html/unnamed-chunk-14-1.png" width="504" style="display: block; margin: auto;" /> ] .pull-right[ <br /> <br /> * Absence of a long-term trend in recreational effort suggests relative stability in the overall number of recreational opportunities in the MAB. * Decline in recreational fleet diversity suggests a potentially reduced range of opportunities. * Driven by party/charter contraction (from a high of 24% of angler trips to 7% currently), and a shift toward shore based angling. ] --- ## Objective: Stability  Com ; Rec  *New England* .pull-left[ ### *Fishery* Indicators: Commercial fleet count, fleet diversity <img src="20210504_OneNOAA_Bastille_files/figure-html/unnamed-chunk-16-1.png" width="504" style="display: block; margin: auto;" /> ] .pull-right[ ### *Fishery* Indicators: recreational species catch diversity <img src="20210504_OneNOAA_Bastille_files/figure-html/unnamed-chunk-17-1.png" width="504" style="display: block; margin: auto;" /> * commercial fishery diversity driven by small number of species * diminished capacity to respond to future fishing opportunities * recreational diversity due to species distributions and regulations ] --- ## Objective: Stability   *New England* .pull-left[ #### *Ecological* Indicators: zooplankton diversity <img src="20210504_OneNOAA_Bastille_files/figure-html/unnamed-chunk-19-1.png" width="504" style="display: block; margin: auto;" /> <img src="20210504_OneNOAA_Bastille_files/figure-html/unnamed-chunk-20-1.png" width="504" style="display: block; margin: auto;" /> ] .pull-right[ ### *Ecological* Indicator: expected number of species, NEFSC bottom trawl survey <img src="20210504_OneNOAA_Bastille_files/figure-html/unnamed-chunk-21-1.png" width="504" style="display: block; margin: auto;" /> * mixed trends need further monitoring <br /> <br /> <br /> ] --- ## Objective: Social & Cultural *Mid-Atlantic* #### Indicators: Social vulnerability, fishery engagement and reliance .pull-left[ <img src="20210504_OneNOAA_Bastille_files/figure-html/unnamed-chunk-23-1.png" width="504" style="display: block; margin: auto;" /> ] .pull-right[ <img src="20210504_OneNOAA_Bastille_files/figure-html/unnamed-chunk-24-1.png" width="504" style="display: block; margin: auto;" /> ] * Highlighted communities may be vulnerable to changes in fishing patterns due to regulations and/or climate change. * Social vulnerability communities may have lower ability to successfully respond to change. * May also be vulnerable to environmental justice issues. --- ## Objective: Protected species *Maintain bycatch below thresholds*   *Northeast Shelf* ### Indicators: Harbor porpoise and gray seal bycatch .pull-left[ <img src="20210504_OneNOAA_Bastille_files/figure-html/unnamed-chunk-25-1.png" width="504" style="display: block; margin: auto;" /> <img src="20210504_OneNOAA_Bastille_files/figure-html/unnamed-chunk-26-1.png" width="504" style="display: block; margin: auto;" /> ] .pull-right[ <br /> <br /> * Currently meeting objectives * The downward trend in harbor porpoise bycatch can also be due to a decrease in harbor porpoise abundance in US waters, reducing their overlap with fisheries, and a decrease in gillnet effort. * The increasing trend in gray seal bycatch may be related to an increase in the gray seal population. ] --- ## Objectives: Protected species *Recover endangered populations*   *Northeast Shelf* ### Indicators: North Atlantic right whale population, calf counts .pull-left[ <img src="20210504_OneNOAA_Bastille_files/figure-html/unnamed-chunk-27-1.png" width="504" style="display: block; margin: auto;" /> <img src="20210504_OneNOAA_Bastille_files/figure-html/unnamed-chunk-28-1.png" width="504" style="display: block; margin: auto;" /> ] .pull-right[ <br /> <br /> * Population drivers for North Atlantic Right Whales (NARW) include combined fishery interactions/ship strikes, distribution shifts, and copepod availability. * Unusual mortality events continue for 3 large whale species, harbor and gray seals. ] --- # Risks to meeting fishery management objectives .center[   ] .center[      ] --- ## Risks: Climate change ### Indicators: sea surface temperature and marine heatwaves .pull-left[ <img src="20210504_OneNOAA_Bastille_files/figure-html/unnamed-chunk-30-1.png" width="504" style="display: block; margin: auto;" /> * Georges Bank experienced the warmest event on record at 4.3 degrees above average ] .pull-right[ <img src="20210504_OneNOAA_Bastille_files/figure-html/unnamed-chunk-31-1.png" width="504" style="display: block; margin: auto;" /> <img src="20210504_OneNOAA_Bastille_files/figure-html/unnamed-chunk-32-1.png" width="360" style="display: block; margin: auto;" /> ] --- ## Risks: Climate change ### Indicators: ocean currents and bottom temperatures .pull-left[ <img src="20210504_OneNOAA_Bastille_files/figure-html/unnamed-chunk-34-1.png" width="360" style="display: block; margin: auto;" /> <img src="20210504_OneNOAA_Bastille_files/figure-html/unnamed-chunk-35-1.png" width="360" style="display: block; margin: auto;" /> * Gulf stream moving further north ] .pull-right[ <img src="20210504_OneNOAA_Bastille_files/figure-html/unnamed-chunk-37-1.png" width="360" style="display: block; margin: auto;" /> <img src="20210504_OneNOAA_Bastille_files/figure-html/unnamed-chunk-38-1.png" width="360" style="display: block; margin: auto;" /> * Almost no cold Labrador slopewater entering the GOM ] --- ## Risks: Climate change ### Indicators: cool pool area and ocean acidification .pull-left[  ] .pull-right[  ] --- ## Risks: Ecosystem productivity ### Indicators: primary production and zooplankton .pull-left[ <img src="20210504_OneNOAA_Bastille_files/figure-html/unnamed-chunk-40-1.png" width="576" style="display: block; margin: auto;" /> <img src="20210504_OneNOAA_Bastille_files/figure-html/unnamed-chunk-41-1.png" width="504" style="display: block; margin: auto;" /> ] .pull-right[ <img src="20210504_OneNOAA_Bastille_files/figure-html/unnamed-chunk-42-1.png" width="576" style="display: block; margin: auto;" /> * Increased production by smaller phytoplankton implies less efficient transfer of primary production to higher trophic levels. * Monitor implications of increasing gelatinous zooplankton and krill. ] --- ## Risks: Ecosystem productivity ### Indicators: plankton-based forage anomaly and forage fish energy content .pull-left[ <img src="20210504_OneNOAA_Bastille_files/figure-html/unnamed-chunk-44-1.png" width="504" style="display: block; margin: auto;" /> ] .pull-right[ <img src="20210504_OneNOAA_Bastille_files/figure-html/unnamed-chunk-45-1.png" width="576" style="display: block; margin: auto;" /> ] * fluctuating environmental conditions and prey for forage species affect both abundance and energy content. * Energy content varies by season, and has changed over time most dramatically for Atlantic herring --- ## Risks: Ecosystem productivity ### Indicators: fish condition .pull-left[ .center[ 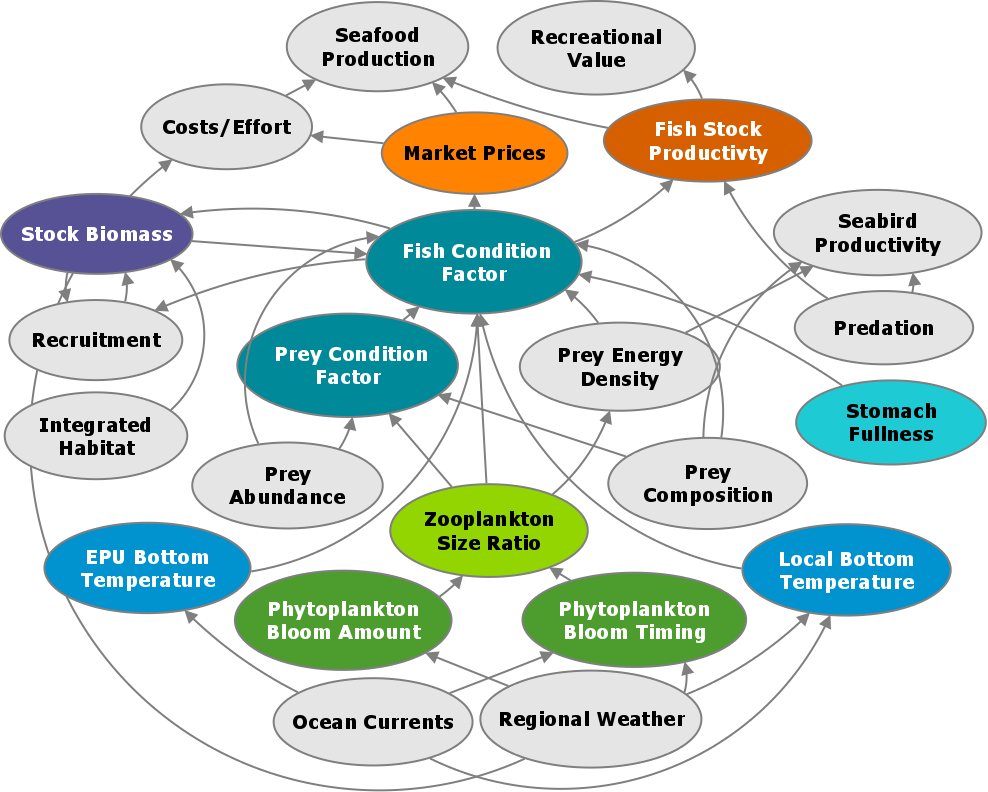 ] <br /> Preliminary results: * Multiple, different condition drivers by species ] .pull-right[ Mid-Atlantic Bight 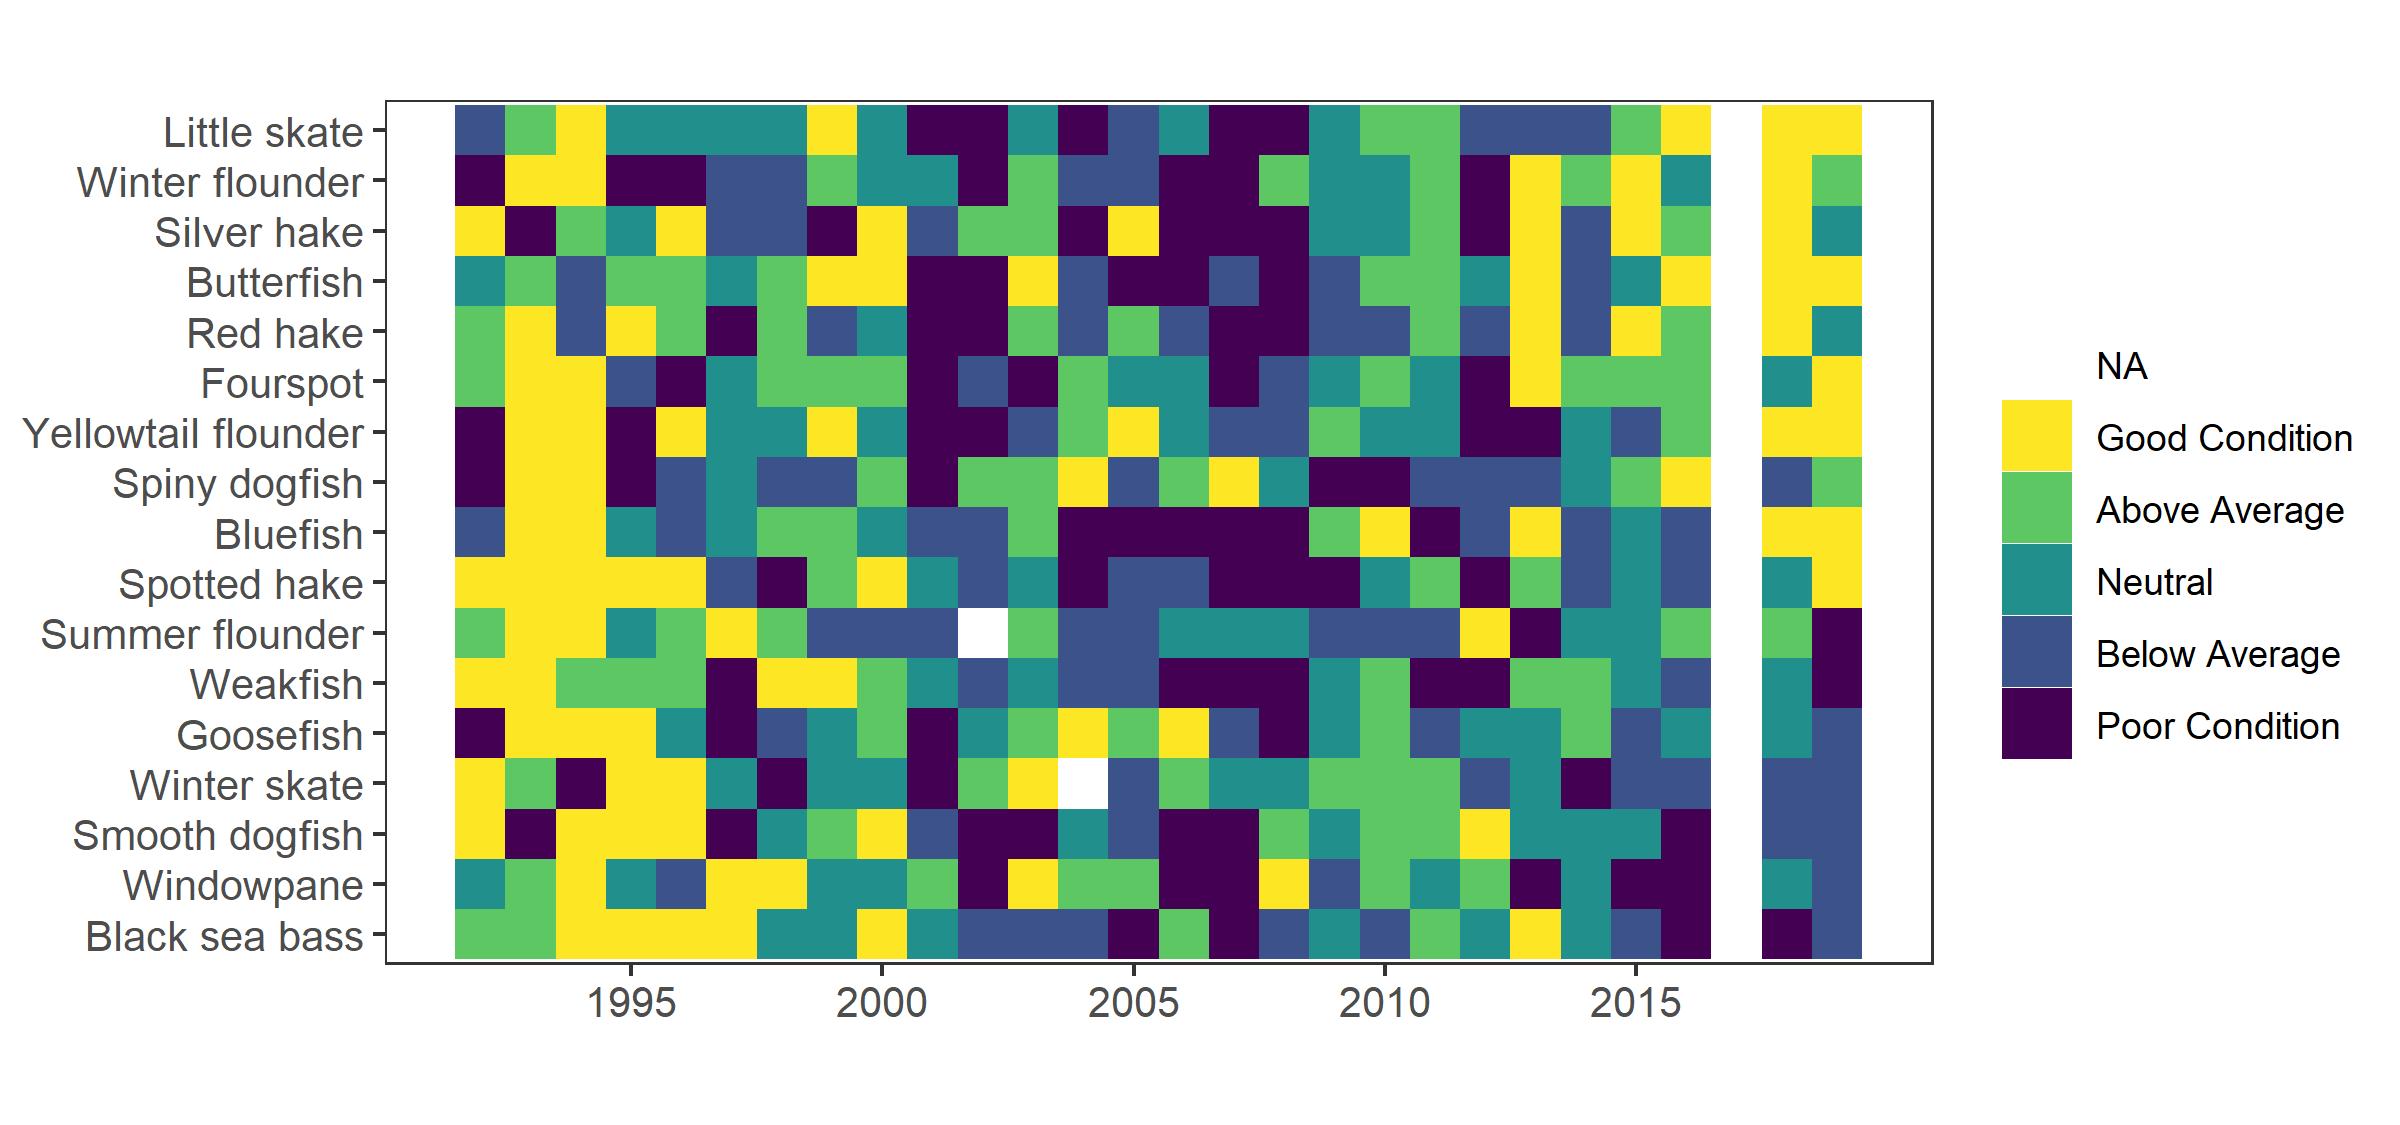 * Acadian redfish, butterfish and winter flounder more affected by fishing pressure and stock size * Weakfish, windowpane flounder, and American plaice more affected by local bottom temperatures and zooplankton ] --- ## Risks: Habitat climate vulnerability ### Indicators: climate sensitive species life stages mapped to climate vulnerable habitats <div id="htmlwidget-28d2ccd5a64712843869" style="width:100%;height:226.8px;" class="widgetframe html-widget"></div> <script type="application/json" data-for="htmlwidget-28d2ccd5a64712843869">{"x":{"url":"20210504_OneNOAA_Bastille_files/figure-html//widgets/widget_unnamed-chunk-46.html","options":{"xdomain":"*","allowfullscreen":false,"lazyload":false}},"evals":[],"jsHooks":[]}</script> <br /> <br /> <br /> <br /> <br /> <br /> <br /> <br /> [Habitat tables](https://noaa-edab.github.io/ecodata/Hab_table) --- background-image: url("EDAB_images/SurveyMap202133.png") background-size: 700px background-position: right ## Risks: Offshore Wind Development ### Indicators: development timeline, revenue in lease <br />areas, survey overlap ([full map](https://noaa-edab.github.io/ecodata/human_dimensions_MAB#Shelfwide_Indicators)) .pull-left[ <img src="20210504_OneNOAA_Bastille_files/figure-html/unnamed-chunk-47-1.png" width="504" style="display: block; margin: auto;" /> <img src="20210504_OneNOAA_Bastille_files/figure-html/unnamed-chunk-48-1.png" width="504" style="display: block; margin: auto;" /> ] .pull-right[ ] --- ## Risks: Offshore Wind Development .pull-left[ * Current plans for rapid buildout of offshore wind in a patchwork of areas spreads the impacts differentially throughout the region * 2-24% of total average revenue for major Mid-Atlantic commercial species in lease areas could be displaced if all sites are developed. Displaced fishing effort can alter fishing methods, which can in turn change habitat, species (managed and protected), and fleet interactions. * Right whales may be displaced, and altered local oceanography could affect distribution of their zooplankton prey. * Scientific data collection surveys for ocean and ecosystem conditions, fish, and protected species will be altered, potentially increasing uncertainty for management decision making. ] .pull-right[ .center[ 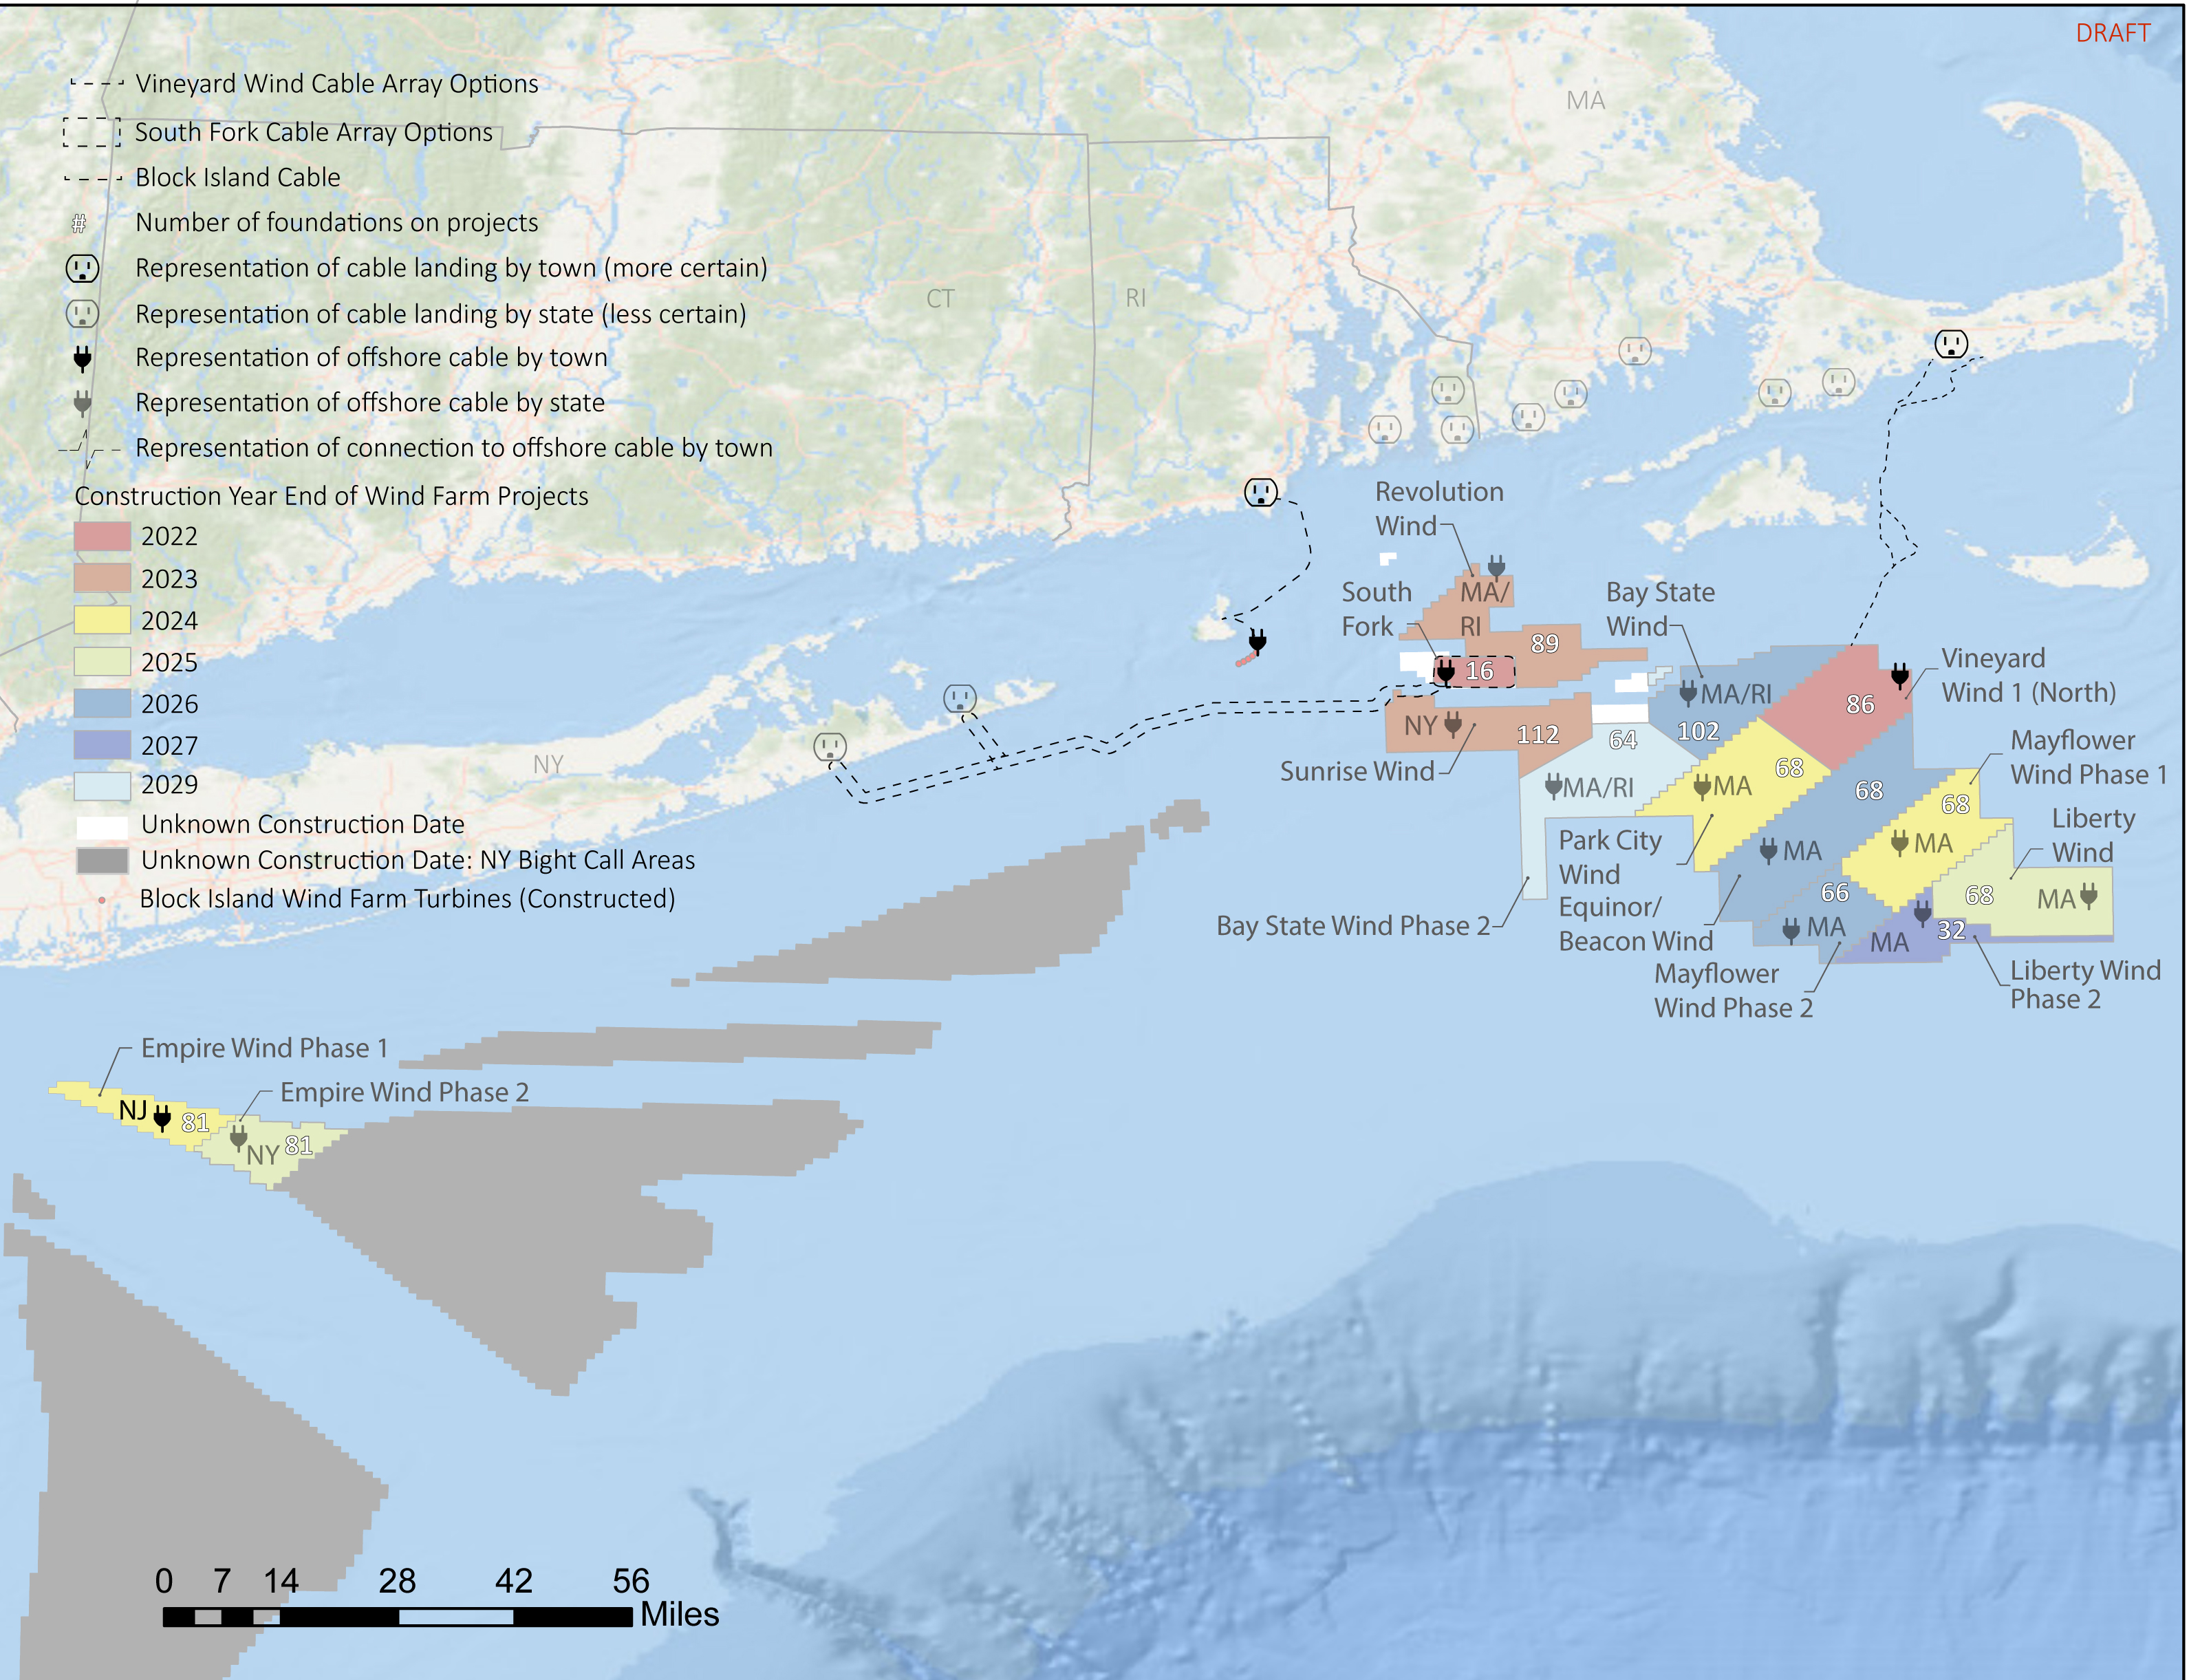 ] ] --- ## SOE in action .pull-left[ ### How is this being used to inform management? <br /> <br /> * Feedback from FMCs * Improvements for next year + Push to operationalize SOE + Standing up a subgroup * MAFMC risk assessment ] .pull-right[  <br /> *The IEA Loop<sup>1</sup>* .footnote[ [1] https://www.integratedecosystemassessment.noaa.gov/national/IEA-approach ] ] --- ## Risk assessent indicators and ranking criteria: Commercial revenue This element is applied at the ecosystem level. Revenue serves as a proxy for commercial profits. .table[ .pull-left[ <br /> | Risk Level | Definition | |:-------------------|:--------------------------------------------------------------------| | Low | No trend and low variability in revenue | | Low-Moderate | Increasing or high variability in revenue | | Moderate-High | Significant long term revenue decrease | | High | Significant recent decrease in revenue | ] ] .pull-right[ <img src="20210504_OneNOAA_Bastille_files/figure-html/unnamed-chunk-50-1.png" width="432" style="display: block; margin: auto;" /> .contrib[ Key: Black = Total Landings; <p style="color:#FF6A6A;">Red = Landings of MAFMC managed species</p> ] ] Ranked moderate-high risk due to the significant long term revenue decrease for Mid-Atlantic managed species --- background-image: url("EDAB_images/noaa-iea.png") background-size: 350px background-position: right bottom ## Contributors - THANK YOU! The New England and Mid-Atlantic SOEs made possible by (at least) 52 contributors from 10 institutions .pull-left[ .contrib[ Andy Beet<br> Kimberly Bastille<br> Ruth Boettcher (Virginia Department of Game and Inland Fisheries)<br> Mandy Bromilow (NOAA Chesapeake Bay Office)<br> Zhuomin Chen (Woods Hole Oceanographic Institute)<br> Joseph Caracappa<br> Doug Christel (GARFO)<br> Patricia Clay<br> Lisa Colburn<br> Jennifer Cudney (NMFS Atlantic HMS Management Division)<br> Tobey Curtis (NMFS Atlantic HMS Management Division)<br> Geret DePiper<br> Emily Farr (NMFS Office of Habitat Conservation)<br> Michael Fogarty<br> Paula Fratantoni<br> Kevin Friedland<br> Sarah Gaichas<br> Ben Galuardi (GARFO)<br> Avijit Gangopadhyay (School for Marine Science and Technology, University of Massachusetts Dartmouth)<br> James Gartland (Virginia Institute of Marine Science)<br> Glen Gawarkiewicz (Woods Hole Oceanographic Institution)<br> Sean Hardison<br> Kimberly Hyde<br> John Kocik<br> Steve Kress (National Audubon Society’s Seabird Restoration Program)<br> Young-Oh Kwon (Woods Hole Oceanographic Institute)<br> ] ] .pull-right[ .contrib[ Scott Large<br> Andrew Lipsky<br> Sean Lucey<br> Don Lyons (National Audubon Society’s Seabird Restoration Program)<br> Chris Melrose<br> Shannon Meseck<br> Ryan Morse<br> Kimberly Murray<br> Chris Orphanides<br> Richard Pace<br> Charles Perretti<br> CJ Pellerin (NOAA Chesapeake Bay Office)<br> Grace Roskar (NMFS Office of Habitat Conservation)<br> Grace Saba (Rutgers)<br> Vincent Saba<br> Chris Schillaci (GARFO)<br> Angela Silva<br> Emily Slesinger (Rutgers University)<br> Laurel Smith<br> Talya tenBrink (GARFO)<br> Bruce Vogt (NOAA Chesapeake Bay Office)<br> Ron Vogel (UMD Cooperative Institute for Satellite Earth System Studies and NOAA/NESDIS Center for Satellite Applications and Research)<br> John Walden<br> Harvey Walsh<br> Changhua Weng<br> Mark Wuenschel ] ] --- ## References .contrib[ <a name=bib-bastille_improving_2020></a>[Bastille, K. et al.](#cite-bastille_improving_2020) (2020). "Improving the IEA Approach Using Principles of Open Data Science". In: _Coastal Management_ 0.0. Publisher: Taylor & Francis \_ eprint: https://doi.org/10.1080/08920753.2021.1846155, pp. 1-18. ISSN: 0892-0753. DOI: [10.1080/08920753.2021.1846155](https://doi.org/10.1080%2F08920753.2021.1846155). URL: [https://doi.org/10.1080/08920753.2021.1846155](https://doi.org/10.1080/08920753.2021.1846155) (visited on Dec. 09, 2020). <a name=bib-depiper_operationalizing_2017></a>[DePiper, G. S. et al.](#cite-depiper_operationalizing_2017) (2017). "Operationalizing integrated ecosystem assessments within a multidisciplinary team: lessons learned from a worked example". En. In: _ICES Journal of Marine Science_ 74.8, pp. 2076-2086. ISSN: 1054-3139. DOI: [10.1093/icesjms/fsx038](https://doi.org/10.1093%2Ficesjms%2Ffsx038). URL: [https://academic.oup.com/icesjms/article/74/8/2076/3094701](https://academic.oup.com/icesjms/article/74/8/2076/3094701) (visited on Mar. 09, 2018). ] ## Additional resources .pull-left[ * [ecodata R package](https://github.com/noaa-edab/ecodata) * Visualizations: * [New England Human Dimensions indicators](http://noaa-edab.github.io/ecodata/human_dimensions_NE) * [New England Macrofauna indicators](http://noaa-edab.github.io/ecodata/macrofauna_NE) * [New England Lower trophic level indicators](https://noaa-edab.github.io/ecodata/LTL_NE) * [Mid-Atlantic Human Dimensions indicators](http://noaa-edab.github.io/ecodata/human_dimensions_MAB) * [Mid-Atlantic Macrofauna indicators](http://noaa-edab.github.io/ecodata/macrofauna_MAB) * [Mid-Atlantic Lower trophic level indicators](https://noaa-edab.github.io/ecodata/LTL_MAB) ] .pull-right[ * [SOE MAFMC 2021](https://apps-nefsc.fisheries.noaa.gov/rcb/publications/SOE-MAFMC-2021-508-Final.pdf) * [SOE NEFMC 2021](https://apps-nefsc.fisheries.noaa.gov/rcb/publications/SOE-NEFMC-2021-508-Final.pdf) * [SOE Technical Documentation](https://noaa-edab.github.io/tech-doc) * [Draft indicator catalog](https://noaa-edab.github.io/catalog/) .contrib[ * Slides available at https://noaa-edab.github.io/presentations * Contact: <kimberly.bastille@noaa.gov> ] ] --- background-image: url("EDAB_images/SOE_feature_image.png") background-size: 1200px background-position: center .right[ <br /> <br /> <br /> <br /> <br /> <br /> <br /> <br /> <br /> <br /> # Thank you! # Questions? ]