class: right, middle, my-title, title-slide # There is no I in EAFM: ## Adapting Integrated Ecosystem Assessment <br /> for Mid-Atlantic Fisheries Management ### Sarah Gaichas, Geret DePiper, Brandon Muffley, Richard Seagraves, Sean Lucey <br /> Northeast Fisheries Science Center, Mid-Atlantic Fishery Management Council --- class: top, left ## An integrated ecosystem assessment success story (in progress) Diverse stakeholders agreed that an ecosystem approach was necessary. Developing and implementing an ecosystem approach to fishery management was done in collaboration between managers, stakeholders, and scientists. .pull-left[ *Outline* - Mid-Atlantic Fishery Management Council Ecosystem Approach (EAFM) - Tailoring ecosystem reporting for fishery managers - Mid-Atlantic EAFM risk assessment - Mid-Atlantic EAFM conceptual modeling (towards MSE) - Improvements: open-source data and technical documentation ] .pull-right[ *Integrated Ecosystem Assessment*  .image-cap[ https://www.integratedecosystemassessment.noaa.gov/national/IEA-approach ] ] ??? --- ## The Mid-Atlantic Fishery Management Council .pull-left-30[  ] .pull-right-70[  ] Source: http://www.mafmc.org/fishery-management-plans --- ## Why an ecosystem approach? *"We rebuilt all the stocks, so why is everyone still pissed off?" --Rich Seagraves* in 2011, the Council asked: .pull-left[  ] .pull-right[  ] And many people answered, from commercial fishery, recreational fishery, environmental organization, and interested public perspectives. Visioning report: http://www.mafmc.org/s/MAFMC-stakeholder-input-report-p7b9.pdf --- ## Common themes among all stakeholder groups: >• There is a lack of confidence in the data that drive fishery management decisions. > >• Stakeholders are not as involved in the Council process as they can and should be. > >• Different jurisdictions and regulations among the many fishery management organizations result in complexity and inconsistency. > >• There is a need for increased transparency and communications in fisheries management. > >• The dynamics of the ecosystem and food web should be considered to a greater extent in fisheries management decisions. > >• Stakeholders are not adequately represented on the Council. > >• Pollution is negatively affecting the health of fish stocks. Visioning report, p. 3: http://www.mafmc.org/s/MAFMC-stakeholder-input-report-p7b9.pdf --- ## Mid-Atlantic Council Ecosystem Approach * 2016 Ecosystem Approach to Fishery Management (EAFM) Policy Guidance document: http://www.mafmc.org/s/EAFM-Doc-Revised-2019-02-08.pdf * Mid-Atlantic EAFM framework<sup>1</sup>: <img src="EDAB_images/Framework.png" width="60%" style="display: block; margin: auto;" /> Details on development, including workshop presentations and white papers: http://www.mafmc.org/eafm .footnote[ [1] Gaichas, S., Seagraves, R., Coakley, J., DePiper, G., Guida, V., Hare, J., Rago, P., et al. 2016. A Framework for Incorporating Species, Fleet, Habitat, and Climate Interactions into Fishery Management. Frontiers in Marine Science, 3. ] --- ## Examples illustrating the use of the framework .pull-left-40[ 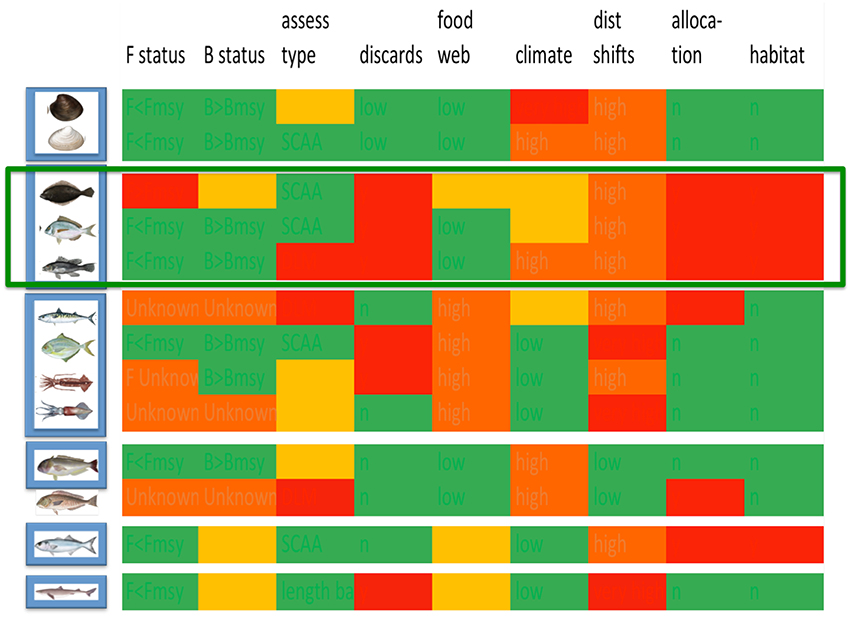 ] .pull-right-60[ Risk assessment highlights prority species/issues for more detailed evaluation A conceptual model maps out key interactions for high risk fisheries, specifies quantitative management strategy evaluation ] -- <img src="EDAB_images/fmars-03-00105-g011.jpg" width="78%" style="display: block; margin: auto 0 auto auto;" /> ??? The conceptual model is used to specify quantitative management strategy evaluation --- background-image: url("EDAB_images/IMG_2246.jpg") background-size: cover ## <center>But where will the risk assessment indicators come from?</center> --- ## Meanwhile, scientists were improving ecosystem reports: *"So what?" --John Boreman, September 2016* 1. Clear linkage of ecosystem indicators with management objectives 1. Synthesis across indicators for big picture 1. Objectives related to human-well being placed first in report 1. Short (< 30 pages), non-technical (but rigorous) text 1. Emphasis on reproducibility <img src="EDAB_images/nes-components-abstracted.png" width="60%" style="display: block; margin: auto;" /> ??? In 2016, we began taking steps to address these common critiques of the ESR model --- ## Revised ecosystem status reporting .pull-left[ ### Report structure 0. Synthetic overview 1. Human dimensions 2. Protected species 3. Fish and invertebrates (managed and otherwise) 4. Habitat quality and ecosystem productivity ] .pull-right[ .table[ <table class="table" style="width: 50; margin-left: auto; margin-right: auto;"> <caption>Ecosystem-scale objectives and indicators on the Northeast US shelf</caption> <thead> <tr> <th style="text-align:left;font-weight: bold;"> Objective Categories </th> <th style="text-align:left;font-weight: bold;"> Indicators </th> </tr> </thead> <tbody> <tr> <td style="text-align:left;"> Seafood Production </td> <td style="text-align:left;"> Landings by feeding guild </td> </tr> <tr> <td style="text-align:left;"> Profits </td> <td style="text-align:left;"> Revenue by feeding guild </td> </tr> <tr> <td style="text-align:left;"> Recreation </td> <td style="text-align:left;"> Number of anglers and trips; recreational catch </td> </tr> <tr> <td style="text-align:left;"> Stability </td> <td style="text-align:left;"> Diversity indices (fishery and species) </td> </tr> <tr> <td style="text-align:left;"> Social & Cultural </td> <td style="text-align:left;"> Commercial and recreational reliance </td> </tr> <tr> <td style="text-align:left;"> Biomass </td> <td style="text-align:left;"> Biomass or abundance by feeding guild from surveys </td> </tr> <tr> <td style="text-align:left;"> Productivity </td> <td style="text-align:left;"> Condition and recruitment of managed species </td> </tr> <tr> <td style="text-align:left;"> Trophic structure </td> <td style="text-align:left;"> Relative biomass of feeding guilds, primary productivity </td> </tr> <tr> <td style="text-align:left;"> Habitat </td> <td style="text-align:left;"> Estuarine and offshore habitat conditions </td> </tr> </tbody> </table> ] ] --- ## Indicator spatial scales--already Mid-Atlantic specific <img src="EDAB_images/SOE_Map.jpg" width="70%" style="display: block; margin: auto;" /> .footnote[ https://noaa-edab.github.io/tech-doc/epu.html ] ??? Indicators --- ## Risk assessent indicators and ranking criteria: Commercial revenue This element is applied at the ecosystem level. Revenue serves as a proxy for commercial profits. .table[ .pull-left[ | Risk Level | Definition | |:-------------------|:--------------------------------------------------------------------| | Low | No trend and low variability in revenue | | Low-Moderate | Increasing or high variability in revenue | | Moderate-High | Significant long term revenue decrease | | High | Significant recent decrease in revenue | ] ] .pull-right[ 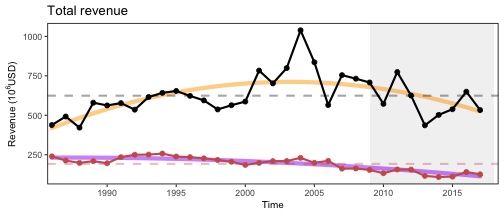<!-- --> 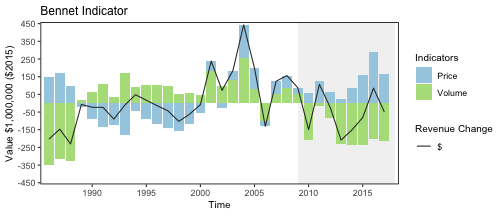<!-- --> ] Ranked moderate-high risk due to the significant long term revenue decrease for Mid-Atlantic managed species (red points in top plot) --- ## Risk assessent indicators and ranking criteria: Climate This element is applied at the species level. Risks to species productivity (and therefore to achieving optimum yield) due to projected climate change in the Northeast US were evaluated in a comprehensive assessment<sup>1</sup>. .table[ .pull-left[ | Risk Level | Definition | |:-------------------|:--------------------------------------------------------------------| | Low | Low climate vulnerability ranking | | Low-Moderate | Moderate climate vulnerability ranking | | Moderate-High | High climate vulnerability ranking | | High | Very high climate vulnerability ranking | ] ] .pull-right[ <img src="EDAB_images/journal.pone.0146756.g003.PNG" width="100%" /> .image-cap[https://journals.plos.org/plosone/article?id=10.1371/journal.pone.0146756.] ] .footnote[ [1] Hare, J. A., Morrison, W. E., Nelson, M. W., Stachura, M. M., Teeters, E. J., Griffis, R. B., Alexander, M. A., et al. 2016. A Vulnerability Assessment of Fish and Invertebrates to Climate Change on the Northeast U.S. Continental Shelf. PLOS ONE, 11: e0146756. ] Each species ranked according to position/color in the plot on the right --- ## Risk assessment results *Species and Sector level risk elements<sup>1</sup>* <img src="EDAB_images/mgttable2019.png" width="85%" style="display: block; margin: auto;" /> .footnote[ [1] Gaichas, S. K., DePiper, G. S., Seagraves, R. J., Muffley, B. W., Sabo, M., Colburn, L. L., and Loftus, A. L. 2018. Implementing Ecosystem Approaches to Fishery Management: Risk Assessment in the US Mid-Atlantic. Frontiers in Marine Science, 5. ] --- ## Risk assessment results updated with 2019 indicators *Species level risk elements* <img src="EDAB_images/sptable2019.png" width="95%" style="display: block; margin: auto;" /> *Ecosystem level risk elements* <img src="EDAB_images/ecotable2019.png" width="95%" style="display: block; margin: auto;" /> --- ## How are they using the risk assessment? What's next? .pull-left[ * Based on risk assessment, the Council selected summer flounder as high-risk fishery for conceptual modeling <img src="EDAB_images/Framework.png" width="90%" style="display: block; margin: auto;" /> ] .pull-right[ * Working group of habitat, biology, stock assessment, management, economic and social scientists developed: * draft conceptual models of high risk elements, linkages * dataset identification and gap analysis for each element and link * draft questions that the Council could persue with additional work ] * Final conceptual model and supporting information at December 2019 Council meeting * Council may then elect to proceed with management strategy evaluation (MSE) using the information from conceptual modeling as a basis --- <div id="htmlwidget-5fad0449038876187a99" style="width:710px;height:710px;" class="chorddiag html-widget"></div> <script type="application/json" data-for="htmlwidget-5fad0449038876187a99">{"x":{"matrix":[[0,0,0,0,0,0,0,0,0,0,0,0,0,0,0,0,0,0,0,0,0,0,0,0,0,0,0,0,0,0,0,0,0,0,0,0,0,0,0,0,0,0,0,0,0,0,0,0,0,0,0,0,0,0,0],[0,0,0,0,0,0,0,0,0,0,0,0,0,0,0,0,0,0,0,0,0,0,0,0,0,0,0,0,0,0,0,0,0,0,0,0,0,0,0,0,0,0,1,0,0,0,1,0,0,0,0,0,0,0,0],[0,0,0,0,0,0,0,0,0,0,0,0,0,0,0,0,0,0,0,0,0,0,0,0,0,0,0,0,0,0,0,0,0,0,0,0,0,0,0,0,0,0,0,0,0,0,0,0,0,1,0,0,1,1,0],[0,0,0,0,0,0,0,0,0,0,0,0,0,0,0,0,0,0,0,0,0,0,0,0,0,0,0,0,0,0,0,0,0,0,0,0,0,0,0,0,0,0,1,0,0,0,0,0,0,0,0,0,0,0,0],[0,0,0,0,0,0,0,0,0,0,0,0,0,0,0,0,0,0,0,0,0,0,0,0,0,0,0,0,0,0,0,0,0,0,0,0,0,0,0,0,0,0,1,0,0,0,0,0,0,0,0,0,0,0,0],[0,0,0,0,0,0,0,0,0,0,0,0,0,0,0,0,0,0,0,0,0,0,0,0,0,0,0,0,0,0,0,0,0,0,0,0,0,0,0,0,0,0,0,0,0,0,1,0,0,0,0,0,0,0,0],[0,0,0,0,0,0,0,0,0,0,0,0,0,0,0,0,0,0,0,0,0,0,0,0,0,0,0,0,0,0,0,0,0,0,0,0,0,0,0,0,0,0,0,0,0,0,1,0,0,0,0,0,0,0,0],[0,0,0,0,0,0,0,0,0,0,0,0,0,0,0,0,0,0,0,0,0,0,0,0,0,0,0,0,0,0,1,0,0,0,0,0,0,0,0,0,0,0,0,0,0,0,0,0,0,0,0,0,0,0,0],[0,0,0,0,0,0,0,0,0,0,0,0,0,0,0,0,0,0,0,1,0,0,0,0,0,0,0,0,0,0,0,0,0,0,0,0,0,0,0,0,0,0,0,0,0,0,0,0,0,0,0,0,1,0,0],[0,0,0,0,0,0,0,0,0,0,0,0,0,0,0,0,0,0,0,0,0,0,0,0,0,0,0,0,0,0,0,0,0,0,0,0,0,0,0,0,0,0,0,0,0,0,0,0,0,0,0,0,1,0,0],[0,0,0,0,0,0,0,0,0,0,0,0,0,0,0,0,0,0,0,0,0,0,0,0,0,0,0,0,0,0,1,0,0,0,0,0,0,0,0,0,0,0,1,0,0,0,1,0,0,0,0,0,0,0,0],[0,0,0,0,0,0,0,0,0,0,0,0,0,0,0,0,0,0,0,0,0,0,0,0,0,0,0,0,0,0,0,0,0,0,0,0,0,0,0,0,0,0,1,0,0,0,0,0,0,0,0,0,0,0,0],[0,0,0,0,0,0,0,0,0,0,0,0,0,0,0,0,0,0,0,0,0,0,0,1,0,0,0,0,0,0,0,0,0,0,0,0,0,0,0,0,0,0,0,0,0,0,0,0,0,0,0,0,0,0,0],[0,0,0,0,0,0,0,0,0,0,0,0,0,0,0,0,0,1,0,0,0,0,0,0,0,0,0,0,0,0,0,0,1,0,0,0,0,0,0,0,0,0,0,0,0,0,0,0,0,0,0,0,0,1,0],[0,0,0,0,0,0,0,0,0,0,0,0,0,1,0,1,1,0,0,0,0,0,0,0,0,0,0,0,0,0,0,0,0,0,0,0,0,0,0,0,0,0,0,0,0,0,0,0,0,0,0,0,0,0,0],[0,0,0,0,0,0,0,0,0,0,0,0,0,0,0,0,0,1,0,0,0,0,0,0,0,0,0,0,0,0,0,0,0,0,0,0,0,0,0,0,0,0,0,0,0,0,0,0,0,0,0,0,0,1,0],[0,0,0,0,0,0,0,0,0,0,0,0,0,0,0,1,0,0,0,0,0,0,0,0,0,0,0,0,0,0,0,0,0,0,0,0,0,0,0,0,0,0,0,0,0,0,0,0,0,0,0,0,0,0,0],[0,0,0,0,0,0,0,0,0,0,0,0,0,0,0,0,0,0,0,0,0,0,0,0,0,0,0,0,0,0,0,0,0,0,0,0,0,0,0,0,0,0,0,0,0,0,0,0,0,1,0,0,1,1,0],[0,0,0,0,0,0,0,0,0,0,0,0,1,0,0,0,0,0,0,0,0,0,0,0,0,0,0,0,0,0,0,0,0,0,0,0,0,0,0,0,0,0,0,0,0,0,0,0,0,0,0,0,0,0,0],[0,0,0,0,0,0,0,0,0,0,0,0,0,1,0,0,0,0,0,0,0,0,0,0,0,0,1,0,0,0,0,0,0,0,0,0,0,0,0,0,0,0,0,0,0,0,0,0,0,1,0,0,0,0,0],[0,0,0,0,0,0,0,0,0,0,0,0,0,1,1,1,1,0,0,0,0,0,0,0,0,0,1,0,0,0,0,0,0,0,0,0,0,0,0,0,0,0,0,0,0,0,0,0,0,1,0,0,1,0,0],[0,0,0,0,0,0,0,0,0,0,0,0,0,0,0,0,0,0,0,1,0,0,0,0,0,0,0,0,0,0,0,0,0,0,0,0,0,0,0,0,0,0,0,0,0,0,0,0,0,0,0,0,0,0,0],[0,0,0,0,0,0,0,0,0,0,0,0,0,0,0,0,0,0,0,0,0,0,0,1,0,0,0,0,0,0,0,0,0,0,0,0,0,0,0,0,0,0,0,0,0,0,0,0,0,0,0,0,0,0,0],[0,0,0,0,0,0,0,0,0,0,0,0,0,1,0,0,0,1,0,1,1,0,0,0,0,0,1,1,0,0,0,0,0,0,0,0,0,0,1,0,0,0,0,0,0,0,0,0,0,1,0,0,1,0,0],[0,0,0,0,0,0,0,0,0,0,0,0,0,0,0,0,0,0,0,0,0,0,0,0,0,0,1,0,0,0,0,0,0,0,0,0,0,0,0,0,0,0,0,0,0,0,0,0,0,0,0,0,0,0,0],[0,0,0,0,0,0,0,0,0,0,0,0,0,0,0,1,1,0,0,0,0,0,0,0,0,0,0,0,0,0,0,0,0,0,0,0,0,0,0,0,0,0,0,0,0,0,0,0,0,0,0,0,0,0,0],[0,0,0,0,0,0,0,0,0,0,0,0,1,0,0,0,0,0,1,1,0,1,0,0,0,0,0,0,0,0,0,0,0,0,0,0,0,0,0,0,0,0,0,0,0,0,0,0,0,1,0,0,1,0,0],[0,0,0,0,0,0,0,0,0,0,0,0,0,0,0,0,0,1,0,0,0,0,0,0,0,0,0,0,0,0,0,0,0,0,0,0,0,0,0,0,0,0,0,0,0,0,0,0,0,0,0,0,0,0,0],[0,0,0,0,0,0,0,0,0,0,0,0,0,0,0,0,0,0,0,0,0,0,0,0,0,0,0,0,0,0,0,0,1,0,0,0,0,0,0,0,0,0,0,0,0,0,0,0,0,0,0,0,0,0,0],[0,0,0,0,0,0,0,0,0,0,0,0,0,0,0,0,0,0,0,0,0,0,0,0,0,0,0,0,0,0,1,0,1,0,0,0,0,0,0,0,0,0,0,0,0,0,0,0,0,0,0,0,0,0,0],[0,0,0,0,0,0,0,0,0,0,0,0,0,1,0,1,1,1,0,1,1,0,0,0,0,0,0,0,0,0,0,0,1,0,0,0,0,0,0,0,1,0,0,0,0,0,0,0,0,1,0,0,1,0,0],[0,0,0,0,0,0,0,0,0,0,0,0,0,1,0,0,0,0,0,0,0,0,0,0,0,0,0,0,0,0,1,0,1,0,0,0,0,0,0,0,0,0,0,0,0,0,0,0,0,0,0,0,0,0,0],[0,0,0,0,0,0,0,0,0,0,0,0,0,0,0,0,0,1,0,0,1,0,0,0,0,0,0,0,0,0,1,0,0,0,0,0,0,0,0,0,1,0,0,0,0,0,0,0,0,1,0,0,1,0,0],[0,0,0,0,0,0,0,0,0,0,0,0,0,0,0,0,0,0,0,0,0,0,0,0,0,0,0,0,0,0,0,0,1,0,0,0,0,0,0,0,0,0,0,0,0,0,0,0,0,0,0,0,0,0,0],[0,0,0,0,0,0,0,0,0,0,0,0,0,0,0,0,0,0,0,0,0,0,0,0,0,0,0,0,0,0,0,0,1,0,0,0,0,0,0,0,0,0,0,0,0,0,0,0,0,0,0,0,0,0,0],[0,0,0,0,0,0,0,0,0,0,0,0,0,0,0,0,0,0,0,0,0,0,0,0,0,0,0,0,0,0,1,0,1,0,0,0,0,0,0,0,0,0,1,0,0,0,0,0,0,0,0,0,0,0,0],[0,0,0,0,0,0,0,0,0,0,0,0,0,0,0,0,0,0,0,0,0,0,0,0,0,0,0,0,0,0,0,0,1,0,0,0,0,0,0,0,0,0,0,0,0,0,0,0,0,0,0,0,0,0,0],[0,0,0,0,0,0,0,0,0,0,0,0,0,0,0,0,0,0,0,0,0,0,0,0,0,0,0,0,0,0,0,0,0,0,0,0,0,0,0,0,0,0,0,0,0,0,0,0,0,0,0,0,0,0,0],[0,0,0,0,0,0,0,0,0,0,0,0,0,0,0,0,0,0,0,0,1,0,0,0,0,0,1,0,0,0,0,0,0,0,0,0,0,0,0,0,1,0,0,0,0,0,0,0,0,0,0,0,0,0,0],[0,0,0,0,0,0,0,0,0,0,0,0,0,0,0,0,0,0,0,0,0,0,0,1,0,0,0,0,0,0,0,0,0,0,0,0,0,0,0,0,0,0,0,0,0,0,0,0,0,0,0,0,0,0,0],[0,0,0,0,0,0,0,0,0,0,0,0,0,0,0,0,0,0,0,0,0,0,0,1,0,0,0,1,0,0,0,0,0,0,0,0,0,1,0,0,0,0,0,0,0,0,0,0,0,0,0,0,0,0,0],[0,0,0,0,0,0,0,0,0,0,0,0,0,0,0,0,0,0,0,0,0,0,0,0,0,0,0,0,0,0,0,0,0,0,0,0,0,0,0,0,0,0,1,0,0,0,0,0,0,0,0,0,0,0,0],[0,0,0,0,0,0,0,0,0,0,0,0,0,0,0,0,0,0,0,0,0,0,0,0,0,0,0,0,0,0,1,1,1,0,0,0,0,0,0,0,0,0,0,0,0,0,0,0,0,0,0,0,0,0,0],[0,0,0,0,0,0,0,0,0,0,0,0,0,0,0,0,0,0,0,0,0,0,0,0,0,0,0,0,0,0,1,0,1,0,0,0,0,0,0,0,0,0,1,0,0,0,1,0,0,0,0,0,0,0,0],[0,0,0,0,0,0,0,0,0,0,0,0,0,0,0,0,0,0,0,0,0,0,0,0,0,0,0,0,0,0,0,0,0,0,0,0,0,0,0,0,0,0,1,0,0,0,1,0,0,0,0,0,0,0,0],[0,0,0,0,0,0,0,0,0,0,0,0,0,0,0,0,0,0,0,0,0,0,0,0,0,0,0,0,0,0,0,0,0,0,0,0,0,0,0,0,0,0,1,0,0,0,0,0,0,0,0,0,0,0,0],[0,0,0,0,0,0,0,0,0,0,0,0,0,0,0,0,0,0,0,0,0,0,0,0,0,0,0,0,0,0,1,0,1,0,0,0,0,0,0,0,0,0,0,0,0,0,0,0,0,0,0,0,0,0,0],[0,0,0,0,0,0,0,0,0,0,0,0,0,0,0,0,0,0,0,0,0,0,0,0,0,0,0,0,0,0,0,0,0,0,0,0,0,0,0,0,0,0,1,0,0,0,1,0,0,0,0,0,0,0,0],[0,0,0,0,0,0,0,0,0,0,0,0,0,0,0,0,0,0,0,0,0,0,0,0,0,0,0,0,0,0,0,0,0,0,0,0,0,0,0,0,0,0,1,0,0,0,0,0,0,0,0,0,0,0,0],[1,0,0,0,0,0,0,0,0,0,0,0,1,0,1,1,1,0,0,0,0,0,0,0,0,0,0,0,0,0,0,0,0,0,0,0,0,0,0,0,0,0,0,0,0,0,0,0,0,0,0,0,0,0,0],[0,0,0,0,0,0,0,0,0,0,0,0,0,0,0,0,0,0,0,0,0,0,0,0,0,0,0,0,0,0,0,0,0,0,0,0,0,0,0,0,0,0,0,0,0,0,0,0,0,0,0,0,1,0,0],[0,0,0,0,0,0,0,0,0,0,0,0,0,0,0,0,0,0,0,0,0,0,0,0,0,0,0,0,0,0,0,0,0,0,0,0,0,0,0,0,0,0,0,0,0,0,0,0,0,0,0,0,1,0,0],[0,0,0,0,0,0,0,0,0,0,0,0,0,1,0,0,0,0,0,0,0,0,0,0,0,0,0,0,0,0,0,0,0,0,0,0,0,0,0,0,0,0,0,0,0,0,0,0,0,0,0,0,0,0,0],[0,0,0,0,0,0,0,0,0,0,0,0,0,0,0,0,0,0,0,0,0,0,0,0,0,0,0,0,0,0,0,0,0,0,0,0,0,0,0,0,0,0,0,0,0,0,0,0,0,0,1,0,1,0,0],[0,0,0,0,0,0,0,0,1,0,0,0,0,0,0,0,0,0,0,1,0,0,0,0,0,0,0,0,0,0,0,0,0,0,0,0,0,0,0,0,0,0,0,0,0,0,0,0,0,0,0,0,0,0,0]],"options":{"type":"directional","width":710,"height":710,"margin":130,"showGroupnames":true,"groupNames":["Community Vulnerability","Dissolved Oxygen","Economic Drivers","Freshwater Influx","Nutrient Influx","Ocean Acidification","Ocean Features","Oceanographic Transport","Other Species Ditributional Shifts","Shifts in Preferences","Temperature","Water Diversion","Compliance","Discards","Fishery Distributional Shift","Fishery Resilience","Fleet Diversity","Landings","Perceived Inequity","Technical Interactions","Allocation","Communication","Enforcement","Management Control","Other Regulations","Permit Access","Regulatory Complexity","Risk Buffering","Adults & Spawners","Age & Size Structure","Fluke Distributional Shift","Fluke Recruitment","Fluke SSB","Growth","Maturation","Natural Mortality","Sex Ratio","Assessment Process","Data Quality","Predictability of Recreational Fishing","Stock Assessment","Aquatic Vegetation","Estuarine Habitat","Food Web Changes","Habitat Alteration","Loose Inert Substrate","Offshore Habitat","Salinity","Water Clarity","Commercial Profits","Consumer Surplus","Recreational Profits","Recreational Value","Seafood","Protected Species"],"groupColors":["#1B9E77","#1B9E77","#1B9E77","#1B9E77","#1B9E77","#1B9E77","#1B9E77","#1B9E77","#1B9E77","#1B9E77","#1B9E77","#1B9E77","#666666","#666666","#666666","#666666","#666666","#666666","#666666","#666666","#66A61E","#66A61E","#66A61E","#66A61E","#66A61E","#66A61E","#66A61E","#66A61E","#7570B3","#7570B3","#7570B3","#7570B3","#7570B3","#7570B3","#7570B3","#7570B3","#7570B3","#A6761D","#A6761D","#A6761D","#A6761D","#D95F02","#D95F02","#D95F02","#D95F02","#D95F02","#D95F02","#D95F02","#D95F02","#E6AB02","#E6AB02","#E6AB02","#E6AB02","#E6AB02","#E7298A"],"groupThickness":0.1,"groupPadding":0.0174532925199433,"groupnamePadding":[10,10,10,10,10,10,10,10,10,10,10,10,10,10,10,10,10,10,10,10,10,10,10,10,10,10,10,10,10,10,10,10,10,10,10,10,10,10,10,10,10,10,10,10,10,10,10,10,10,10,10,10,10,10,10],"groupnameFontsize":12,"groupedgeColor":["#1B9E77","#1B9E77","#1B9E77","#1B9E77","#1B9E77","#1B9E77","#1B9E77","#1B9E77","#1B9E77","#1B9E77","#1B9E77","#1B9E77","#666666","#666666","#666666","#666666","#666666","#666666","#666666","#666666","#66A61E","#66A61E","#66A61E","#66A61E","#66A61E","#66A61E","#66A61E","#66A61E","#7570B3","#7570B3","#7570B3","#7570B3","#7570B3","#7570B3","#7570B3","#7570B3","#7570B3","#A6761D","#A6761D","#A6761D","#A6761D","#D95F02","#D95F02","#D95F02","#D95F02","#D95F02","#D95F02","#D95F02","#D95F02","#E6AB02","#E6AB02","#E6AB02","#E6AB02","#E6AB02","#E7298A"],"chordedgeColor":["#1B9E77","#1B9E77","#1B9E77","#1B9E77","#1B9E77","#1B9E77","#1B9E77","#1B9E77","#1B9E77","#1B9E77","#1B9E77","#1B9E77","#666666","#666666","#666666","#666666","#666666","#666666","#666666","#666666","#66A61E","#66A61E","#66A61E","#66A61E","#66A61E","#66A61E","#66A61E","#66A61E","#7570B3","#7570B3","#7570B3","#7570B3","#7570B3","#7570B3","#7570B3","#7570B3","#7570B3","#A6761D","#A6761D","#A6761D","#A6761D","#D95F02","#D95F02","#D95F02","#D95F02","#D95F02","#D95F02","#D95F02","#D95F02","#E6AB02","#E6AB02","#E6AB02","#E6AB02","#E6AB02","#E7298A"],"categoryNames":null,"categorynamePadding":100,"categorynameFontsize":28,"showTicks":false,"tickInterval":0.1,"ticklabelFontsize":10,"fadeLevel":0.1,"showTooltips":true,"showZeroTooltips":true,"tooltipNames":["Community Vulnerability","Dissolved Oxygen","Economic Drivers","Freshwater Influx","Nutrient Influx","Ocean Acidification","Ocean Features","Oceanographic Transport","Other Species Ditributional Shifts","Shifts in Preferences","Temperature","Water Diversion","Compliance","Discards","Fishery Distributional Shift","Fishery Resilience","Fleet Diversity","Landings","Perceived Inequity","Technical Interactions","Allocation","Communication","Enforcement","Management Control","Other Regulations","Permit Access","Regulatory Complexity","Risk Buffering","Adults & Spawners","Age & Size Structure","Fluke Distributional Shift","Fluke Recruitment","Fluke SSB","Growth","Maturation","Natural Mortality","Sex Ratio","Assessment Process","Data Quality","Predictability of Recreational Fishing","Stock Assessment","Aquatic Vegetation","Estuarine Habitat","Food Web Changes","Habitat Alteration","Loose Inert Substrate","Offshore Habitat","Salinity","Water Clarity","Commercial Profits","Consumer Surplus","Recreational Profits","Recreational Value","Seafood","Protected Species"],"tooltipFontsize":12,"tooltipUnit":"","tooltipGroupConnector":" ▶ ","precision":"null","clickAction":null,"clickGroupAction":null}},"evals":[],"jsHooks":[]}</script> --- ## Conclusions Integrated ecosystem assessment is a valuable framework for the general implementation of ecosystem approaches to natural resource management * The Council’s rapid progress in implementing EAFM resulted from positive collaboration between managers, stakeholders, and scientists. Collaboration is essential to IEA and to the success of EAFM. * Ecosystem indicators and reporting can be tailored to specific regional objectives. * Risk assessment is a rapid, familiar, scaleable, and transparent method to move forward with EAFM within a real-world operational fishery management context. * This EAFM process highlights certain species and certain management issues as posing higher cumulative risks to meeting Council-derived management objectives when considering a broad range of ecological, social, and economic factors. * Conceptual modeling links the key factors for high risk fisheries and scopes more detailed integrated analysis and management strategy evaluation. ??? The Council foresees refining the process so that ecosystem indicators monitor risks to achieving ecological, social, and economic fishery objectives, which can then be mitigated through management action. --- ## Footnote: Improvements to reproducibility and provenance * Reporting the information is not enough * Managers appreciate the concise format, but back-end critical for describing collection, analyses, and processing * Streamlined workflow allowed scientists to meet management deadlines 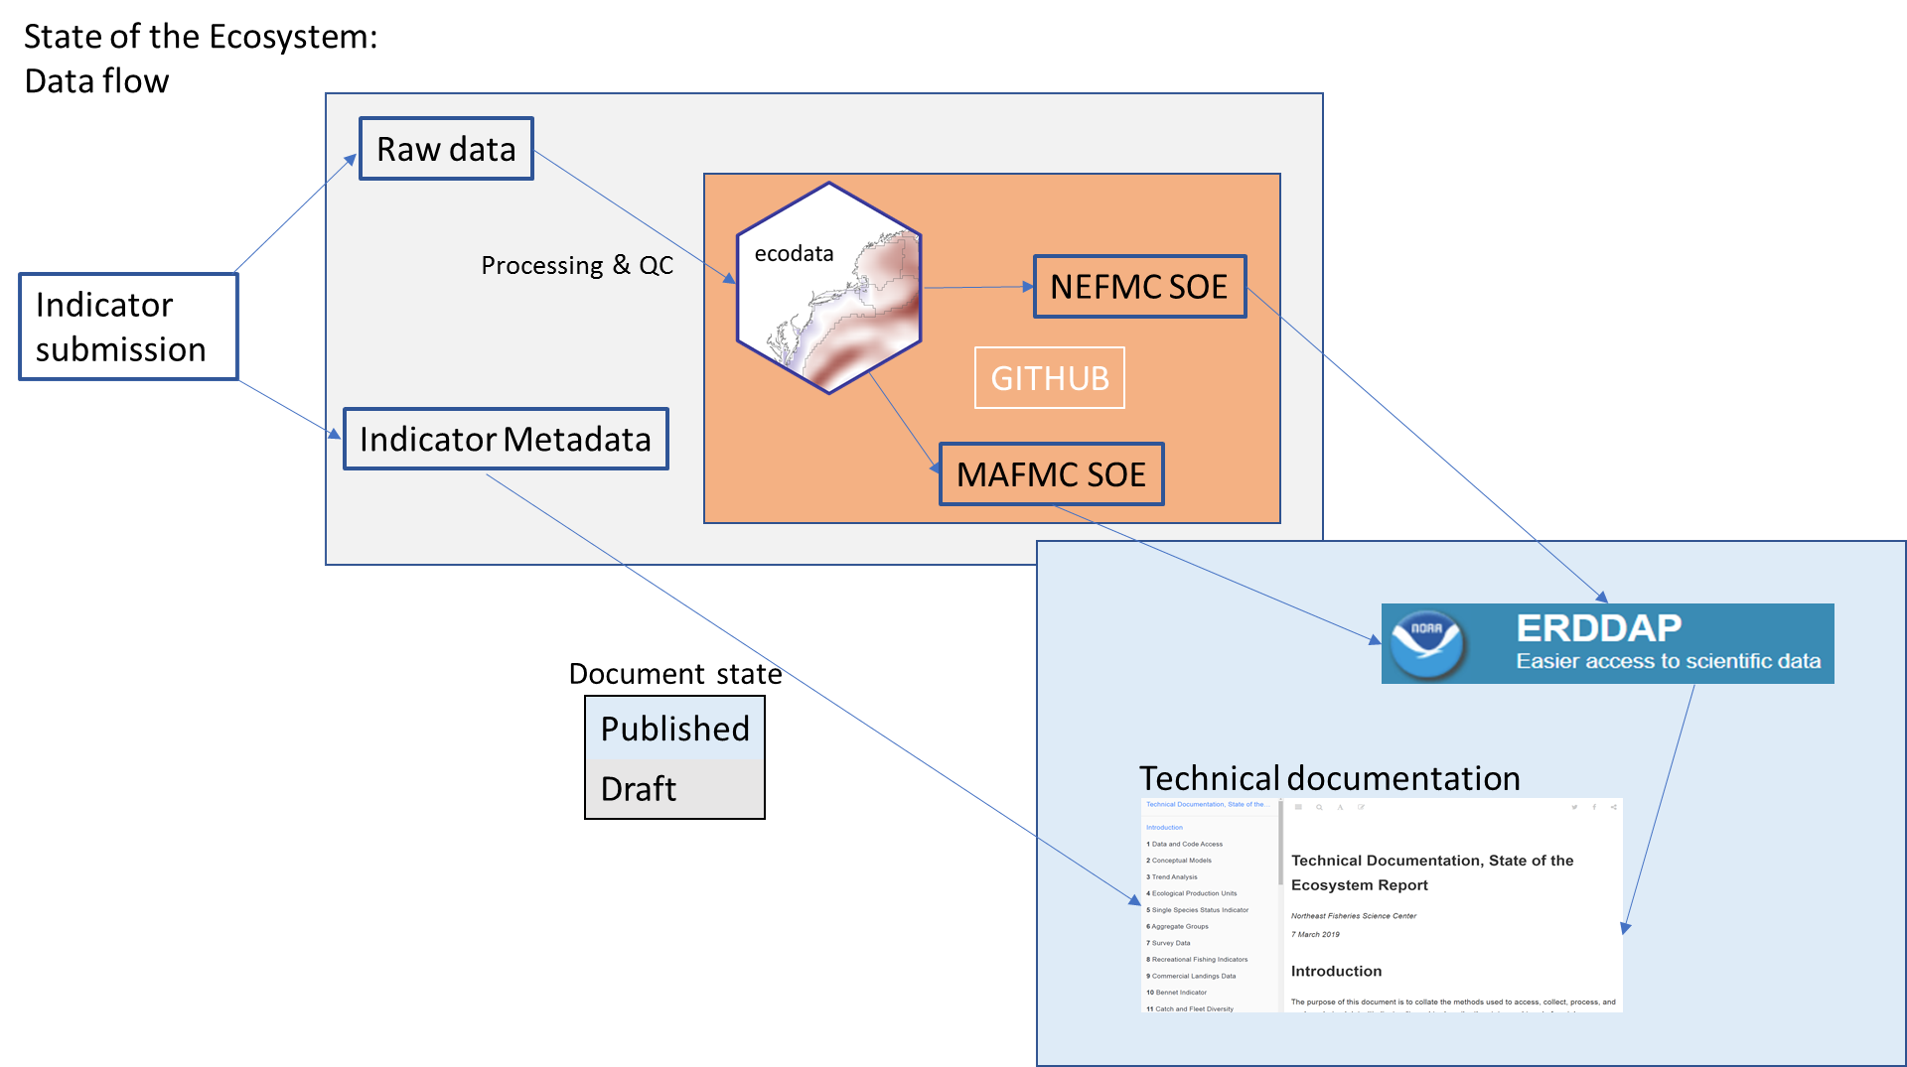 ??? This workflows also ensures that there's no information lost between SOE cycles. We know exactly how a data set was analyzed and handled so that the data can be updated for next year's reports. --- ## If you want **all** the details * [Mid-Atlantic Council EAFM paper](https://www.frontiersin.org/articles/10.3389/fmars.2016.00105/full) * [Mid-Atlantic Council Risk Assessment paper](https://www.frontiersin.org/articles/10.3389/fmars.2016.00105/full) * [Mid-Atlantic Council Summer Flounder conceptual model and support tables](https://gdepiper.github.io/Summer_Flounder_Conceptual_Models/sfconsmod_riskfactors_subplots.html) * [2019 Mid-Atlantic State of the Ecosystem report](http://www.mafmc.org/s/SOE-MAFMC-2019.pdf) * [State of the Ecosystem Technical Documentation](https://noaa-edab.github.io/tech-doc) * [ecodata R package](https://github.com/noaa-edab/ecodata) * [Macrofauna indicators](http://noaa-edab.github.io/ecodata/macrofauna) * [Human Dimensions indicators](http://noaa-edab.github.io/ecodata/human_dimensions) * [Lower trophic level indicators](http://noaa-edab.github.io/ecodata/LTL) * Slides available at https://noaa-edab.github.io/presentations --- ## Contributors - THANK YOU! The New England and Mid-Atlantic Ecosystem reports made possible by (at least) 38 contributors from 8 institutions .pull-left[ .contrib[ Donald Anderson (Woods Hole Oceanographic Institute) <br> Amani Bassyouni (Virginia Department of Health)<br> Lisa Calvo (Rutgers)<br> Matthew Camisa (MA Division of Marine Fisheries) <br> Patricia Clay<br> Lisa Colburn<br> Geret DePiper<br> Deb Duarte<br> Michael Fogarty<br> Paula Fratantoni <br> Kevin Friedland<br> Sarah Gaichas<br> James Gartland (Virginia Institute of Marine Science)<br> Heather Haas<br> Sean Hardison <br> Kimberly Hyde<br> Terry Joyce (Woods Hole Oceanographic Institute)<br> John Kosik<br> Steve Kress (National Audubon Society)<br> Scott Large ] ] .pull-right[ .contrib[ Don Lyons (National Audubon Society)<br> Loren Kellogg<br> David Kulis (Woods Hole Oceanographic Institute)<br> Sean Lucey<br> Chris Melrose<br> Ryan Morse<br> Kimberly Murray<br> Chris Orphanides<br> Richard Pace<br> Charles Perretti<br> Karl Roscher (Maryland Department of Natural Resources)<br> Vincent Saba<br> Laurel Smith<br> Mark Terceiro<br> John Walden<br> Harvey Walsh<br> Mark Wuenschel<br> Qian Zhang (Unversity of Maryland and US EPA Chesapeake Bay Program) ] ] <img src="EDAB_images/noaa-iea.png" width="50%" style="display: block; margin: auto;" /> --- # Extra Slides --- ## Standardized indicator visualization in reports Status (short-term) and trend (long-term) of components are measured as **indicators** and plotted in a standardized way Indicators are selected to 1. Be broadly informative about a component in a management context<sup>1-3</sup> 1. Minimize redundancy of information 1. Be responsive to ecosystem change <img src="20191104_CERF_Gaichas_files/figure-html/doc-orientation-1.png" style="display: block; margin: auto;" /> .footnote[ [1] Rice J. C.Rochet M. J. "A framework for selecting a suite of indicators for fisheries management." ICES Journal of Marine Science 62 (2005): 516–527. [2] Link J. 2010. Ecosystem-Based Fisheries Management: Confronting Tradeoffs . Cambridge University Press, New York. [3] Zador, Stephani G., et al. "Ecosystem considerations in Alaska: the value of qualitative assessments." ICES Journal of Marine Science 74.1 (2017): 421-430. ] --- ## Risk assessent indicators and ranking criteria: System productivity This element is applied at the ecosystem level, and ranks the risk of not achieving optimum yield due to changes in ecosystem productivity at the base of the food web. Four indicators are used together to assess risk of changing ecosystem productivity: primary production, zooplankton abundance, fish condition and fish recruitment. .table[ | Risk Level | Definition | |:-------------------|:--------------------------------------------------------------------| | Low | No trends in ecosystem productivity | | Low-Moderate | Trend in ecosystem productivity (1-2 measures, increase or decrease) | | Moderate-High | Trend in ecosystem productivity (3+ measures, increase or decrease) | | High | Decreasing trend in ecosystem productivity, all measures | ] ??? We examine trends in total primary production, zooplankton abundance for a key Mid-Atlantic species, and two aggregate fish productivity measures: condition factor (weight divided by length of individual fish) and a survey based "recruitment" (small fish to large fish) index. --- ## Risk assessent indicators and ranking criteria: System productivity .pull-left[ <!-- --> <img src="EDAB_images/MAFMC_Fish_Condition_2019.jpg" width="2109" style="display: block; margin: auto;" /> ] .pull-right[ <!-- --> <!-- --> ] Ranked low-moderate risk due to the significant long term trends in zooplankton abundance for major species (top right plot)