All of the buoys hosted by the NDBC (and available on ERDDAP) can be quickly viewed from the bundled data set buoy_data which along with the buoys ID, NAME, LAT and LON contain other metadata such as the years of operation, the date/time of the last recorded measurement, and the owners of the buoy
buoydata::buoy_data |>
  dplyr::as_tibble()
#> # A tibble: 1,331 × 17
#>    ID       Y1    YN nYEARS lastMeasurement        LAT    LON STATION_LOC  TTYPE
#>    <chr> <dbl> <dbl>  <int> <dttm>               <dbl>  <dbl> <chr>        <chr>
#>  1 0Y2W3  2012  2015      4 2015-08-18 11:40:00  44.8   -87.3 "Sturgeon B… Weat…
#>  2 18CI3  2014  2015      2 2015-09-21 13:25:00  41.7   -86.9 "Michigan C… Weat…
#>  3 20CM4  2014  2015      2 2015-09-20 16:55:00  42.1   -86.5 "St. Joseph… Weat…
#>  4 23020  2008  2010      3 2010-12-18 11:50:00  22.2    38.5 "Red Sea"    Buoy
#>  5 31201  2005  2005      1 2005-08-19 15:00:00 -27.7   -48.1 "Floripa, B… Wave…
#>  6 32012  2007  2018     12 2018-04-09 11:50:00 -19.6   -85.4 "Woods Hole… 2.4-…
#>  7 32301  1984  1986      3 1986-07-12 16:00:00  -9.9  -105.  ""           3-me…
#>  8 32302  1986  1995     10 1995-04-03 12:00:00 -18     -85.1 ""           3-me…
#>  9 32487  2008  2010      3 2010-01-08 20:25:00   3.52  -77.7 "Buenaventu… Offs…
#> 10 32488  2008  2009      2 2009-10-16 02:10:00   6.26  -77.5 "Bahia Sola… Offs…
#> # ℹ 1,321 more rows
#> # ℹ 8 more variables: TIMEZONE <chr>, OWNER <chr>, OWNERNAME <chr>,
#> #   COUNTRY <chr>, HULL <chr>, PAYLOAD <chr>, FORECAST <chr>, NOTE <chr>
This data frame can be used to filter out stations of interest
Variables
Each buoy measures a different set of variables. A list of the
possible variables can be found using the get_variables()
function
buoydata::get_variables()#> variable_name data_type actual_range description
#> 1 apd float 0.0, 95.0 Wave Period, Average
#> 2 atmp float -153.4, 50.0 Air Temperature
#> 3 bar float 800.7, 1198.8 Air Pressure
#> 4 dewp float -99.9, 48.7 Dewpoint Temperature
#> 5 dpd float 0.0, 64.0 Wave Period, Dominant
#> 6 gst float 0.0, 75.5 Wind Gust Speed
#> 7 latitude float -55.0, 71.758 Latitude
#> 8 longitude float -177.75, 179.001 Longitude
#> 9 mwd short 0, 359 Wave Direction
#> 10 ptdy float -15.0, 14.7 Pressure Tendency
#> 11 station String Station Identifier
#> 12 tide float -9.37, 6.15 Water Level
#> 13 time double 4910400.0, 1.7617581E9 Time
#> 14 vis float 0.0, 66.7 Station Visibility
#> 15 wd short 0, 359 Wind Direction
#> 16 wspd float 0.0, 96.0 Wind Speed
#> 17 wspu float -98.7, 97.5 Wind Speed, Zonal
#> 18 wspv float -98.7, 97.5 Wind Speed, Meridional
#> 19 wtmp float -98.7, 50.0 SST
#> 20 wvht float 0.0, 92.39 Wave HeightExample
Find all buoys located between latitude [41,43] and longitude [-71,-67] with a time series of at least 20 years. Then pull and process data from a single buoy.
buoydata::buoy_data |>
dplyr::filter(LAT > 41,LAT < 43) |>
dplyr::filter(LON > -71, LON < -69) |>
dplyr::filter(nYEARS >= 20)
#> # A tibble: 5 × 17
#> ID Y1 YN nYEARS lastMeasurement LAT LON STATION_LOC TTYPE
#> <chr> <dbl> <dbl> <int> <dttm> <dbl> <dbl> <chr> <chr>
#> 1 44013 1984 2026 43 2026-06-23 13:10:00 42.3 -70.7 BOSTON 16 NM E… 2.1-…
#> 2 44018 2002 2024 21 2024-08-30 18:10:00 41.3 -69.3 CAPE COD - 9 N… 3-me…
#> 3 BZBM3 2004 2026 23 2026-06-23 14:00:00 41.5 -70.7 8447930 - Wood… Wate…
#> 4 IOSN3 1984 2025 42 2025-09-14 03:00:00 43.0 -70.6 Isle of Shoals… C-MA…
#> 5 NTKM3 2005 2026 22 2026-06-23 15:18:00 41.3 -70.1 8449130 - Nant… Wate…
#> # ℹ 8 more variables: TIMEZONE <chr>, OWNER <chr>, OWNERNAME <chr>,
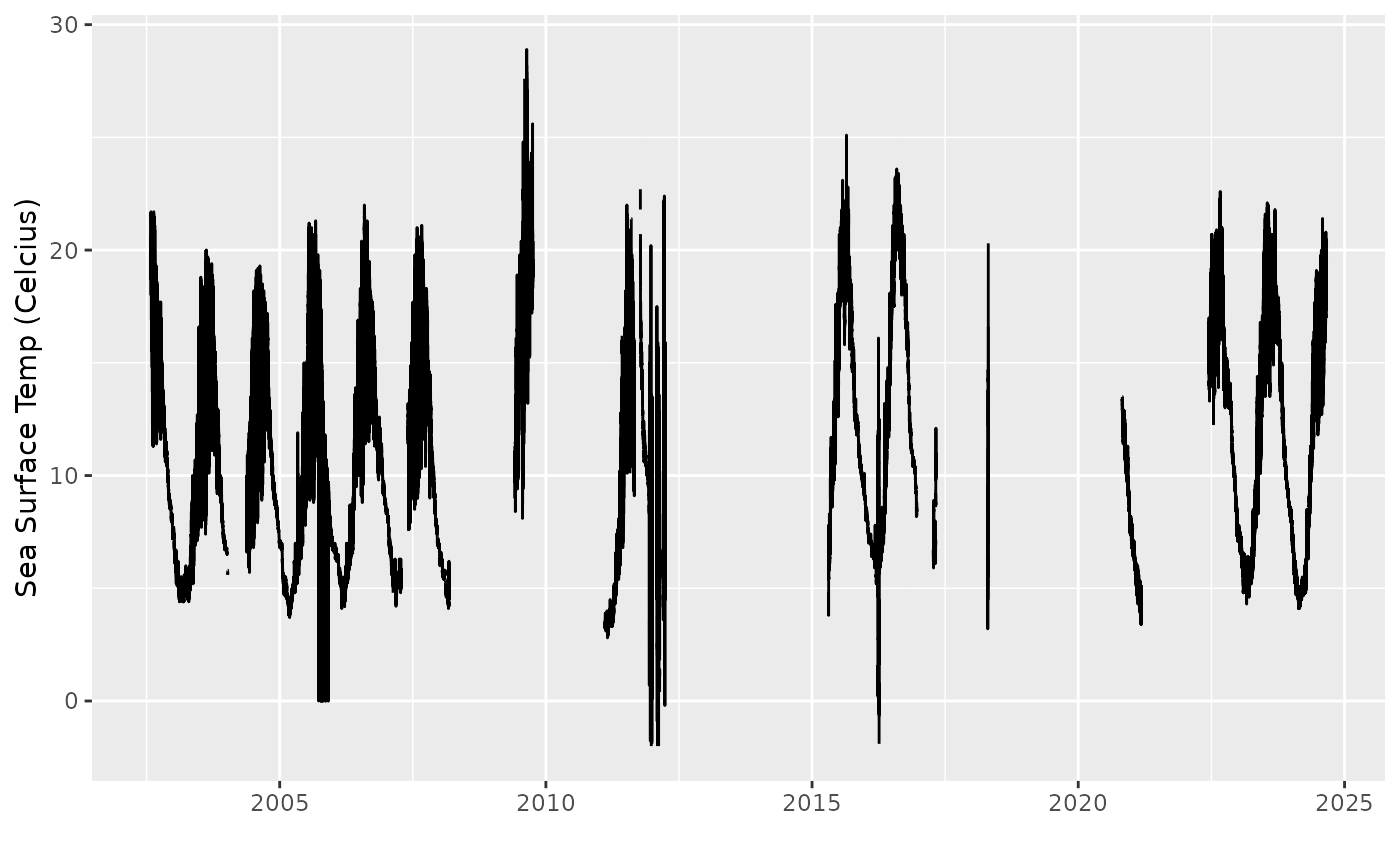
#> # COUNTRY <chr>, HULL <chr>, PAYLOAD <chr>, FORECAST <chr>, NOTE <chr>Lets pull the sea surface temperature (variable name, wtmp) from buoy 44018 - CAPE COD - 9 NM North of Provincetown, MA
buoy_44018 <- buoydata::get_buoy_data(buoyid="44018", var = "wtmp")Then plot the data
 p <- ggplot2::ggplot(buoy_44018) +
   ggplot2::geom_line(ggplot2::aes(x=time,y=wtmp)) +
   ggplot2::ylab("Sea Surface Temp (Celcius)") +
   ggplot2::xlab("")
print(p)