class: right, middle, my-title, title-slide # State of the Ecosystem 101 ## Crash course in all things SOE ### Kim Bastille --- class: top, left <style> p.caption { font-size: 0.6em; } </style> # State of the Ecosystem 101 .pull-left[ Presentation Overview - State of the Ecosystem (SOE) - Overview - Structure - Workflow - Data - Information Needed - Desired Structure - Delivery Pathways - Expectations - What we expect from Contributors - What Contributors can expect from us ] .pull-right[  ] --- # State of the Ecosystem Overview ## Integrated Ecosystem Assessment (IEA) .pull-left[ IEA Approach - Supports shift to ecosystem-based management - Iterative - Collaborative State of the Ecosystem as part of IEA loop - Develop indicators - Assess ecosystem ] .pull-right[ *The IEA Loop<sup>1</sup>* 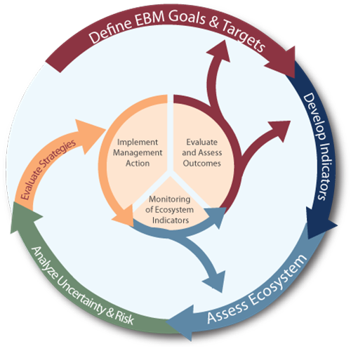 .footnote[ [1] https://www.integratedecosystemassessment.noaa.gov/national/IEA-approach ] ] --- # State of the Ecosystem Overview .pull-left[ ## Improving ecosystem information and synthesis for fishery managers - Two reports delivered to two fisheries management councils - New England - Mid Atlantic - Fishery-relevant subset of full Ecosystem Status Reports - Report evolving since 2016 - Contextual information - Ecosystem indicators linked to management objectives <a name=cite-depiper_operationalizing_2017></a>([DePiper, et al., 2017](https://academic.oup.com/icesjms/article/74/8/2076/3094701)) - Open science emphasis <a name=cite-bastille_improving_2020></a>([Bastille, et al., 2020](https://doi.org/10.1080/08920753.2021.1846155)) ] .pull-right[ 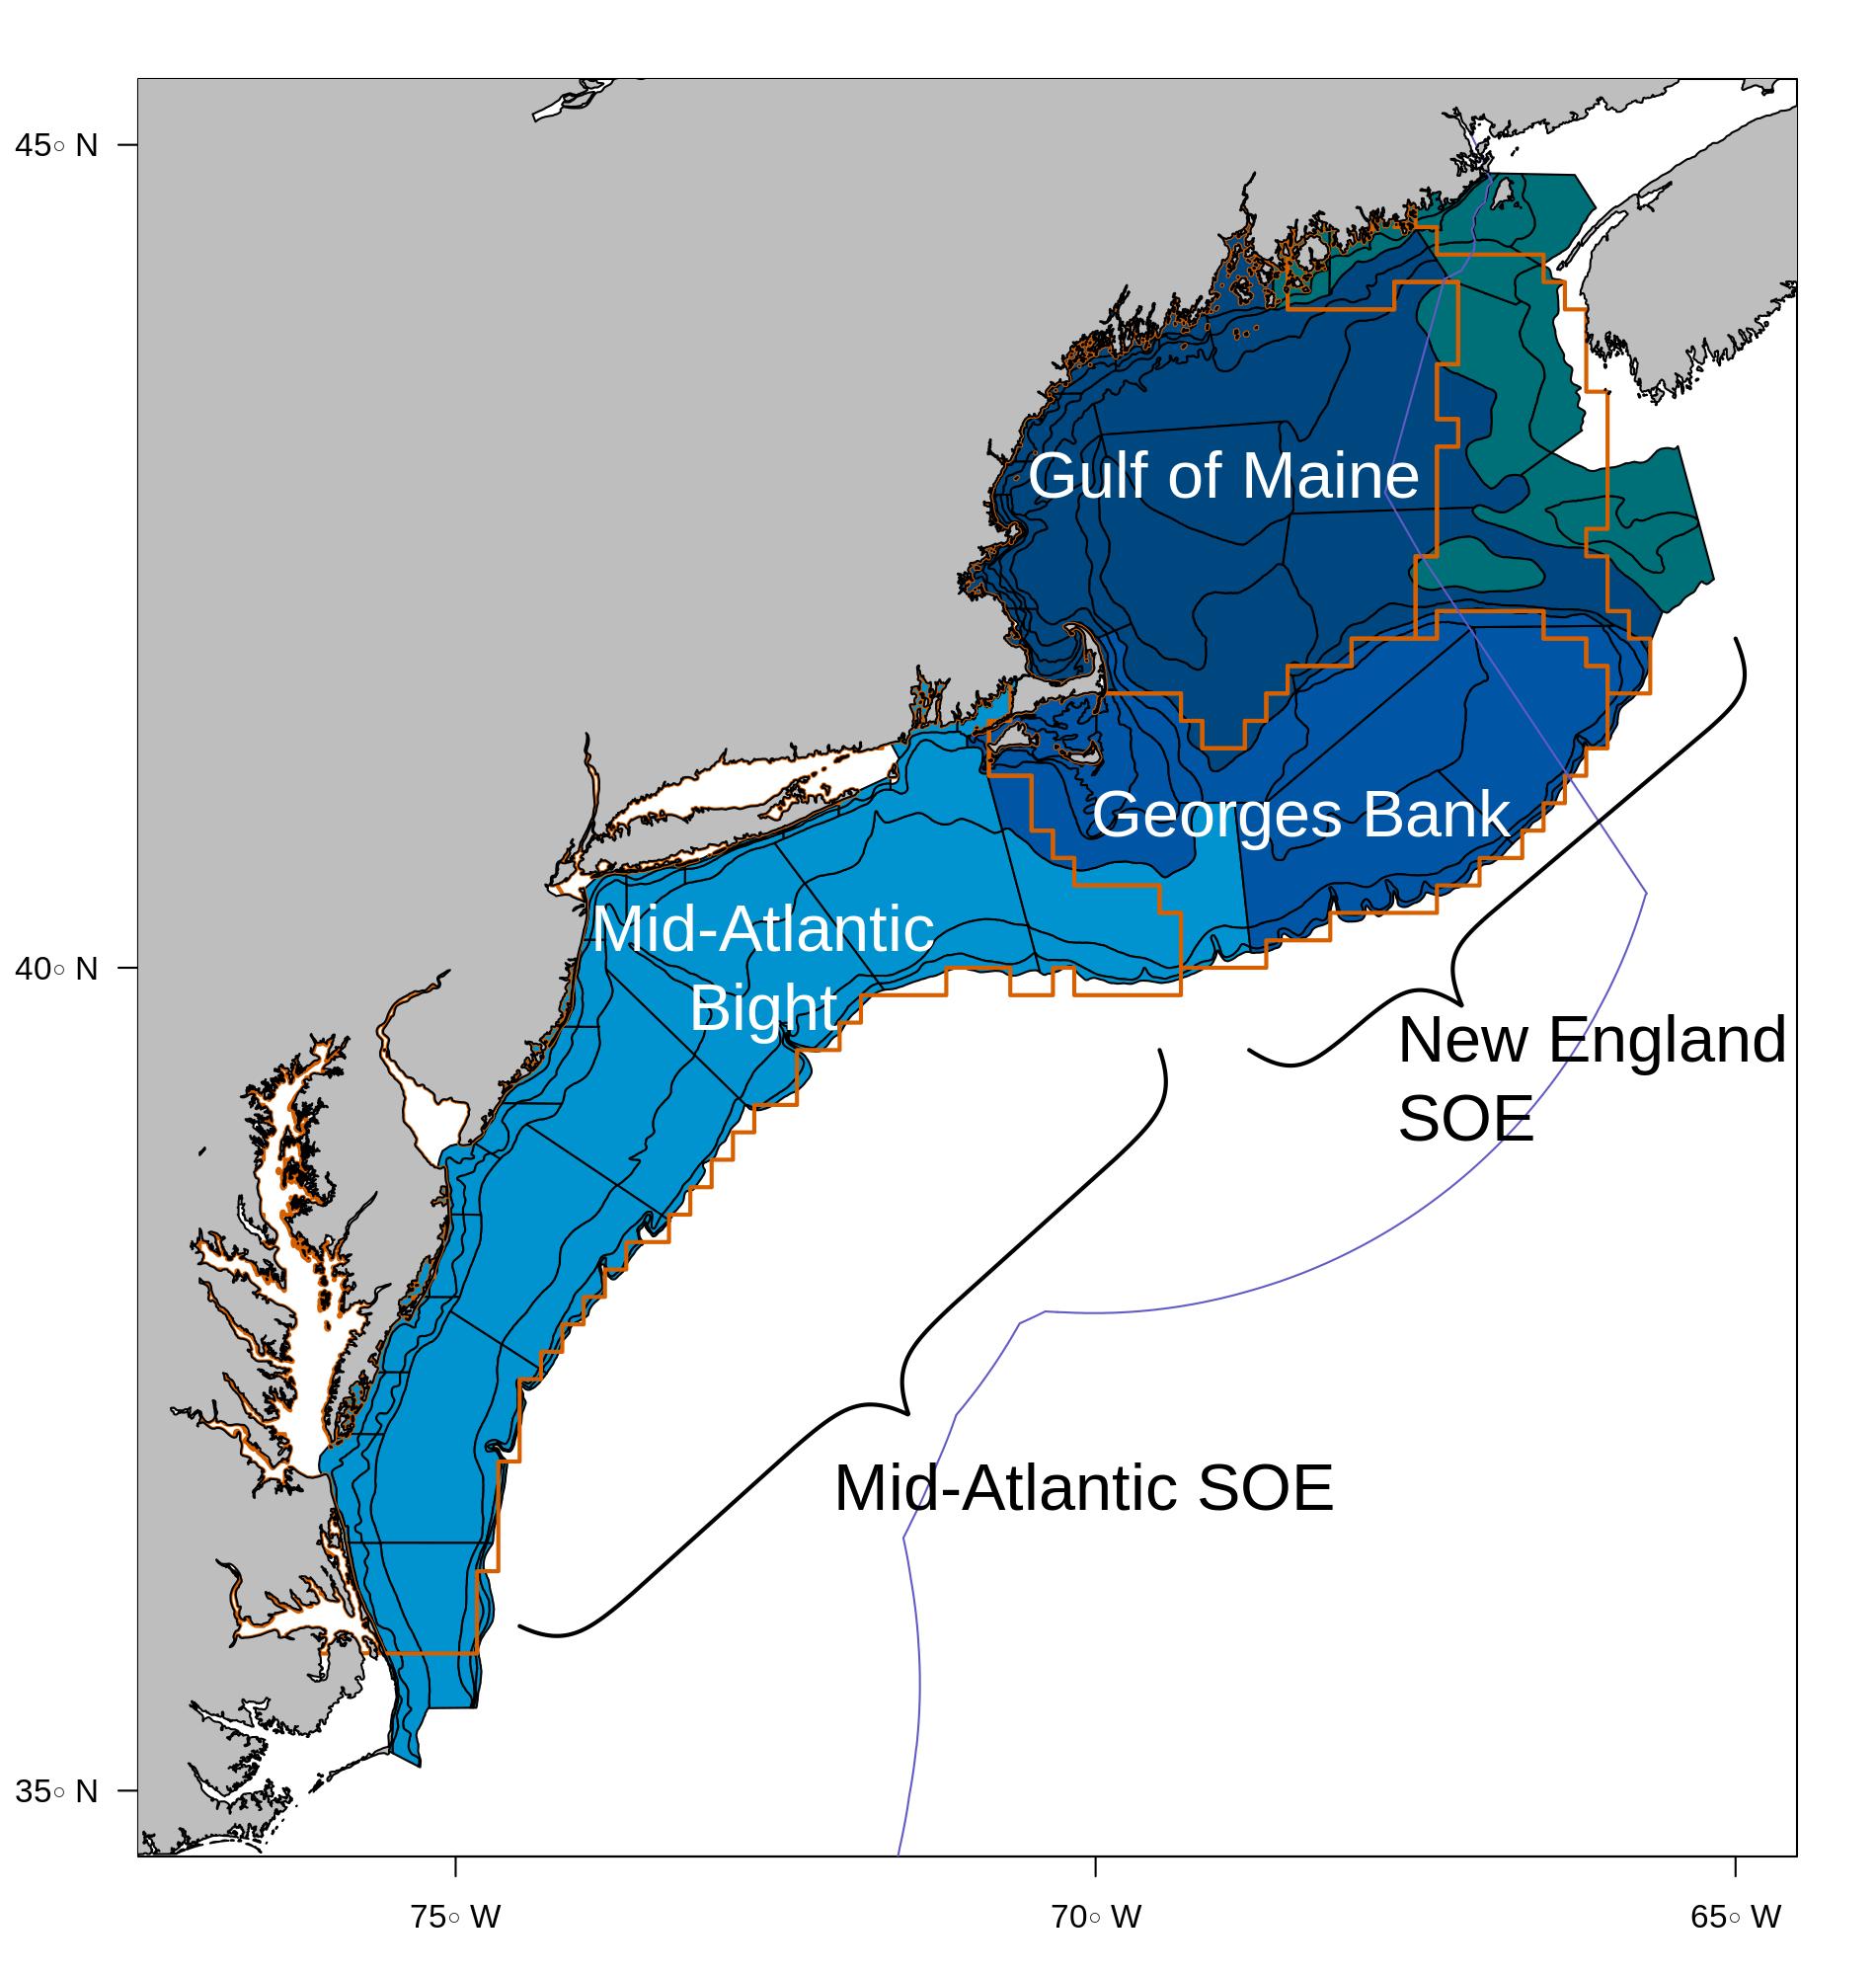 ] --- ## State of the Ecosystem Structure .pull-left[ ## Report Structure 1. Graphical summary 1. Performance relative to management objectives + -------------------------> 1. Risks to meeting management objectives + Climate + Wind Development ] .pull-right[ <table class="table" style="font-size: 14px; margin-left: auto; margin-right: auto;"> <caption style="font-size: initial !important;">Example ecosystem-scale fishery management objectives</caption> <thead> <tr> <th style="text-align:left;font-weight: bold;"> Objective Categories </th> <th style="text-align:left;font-weight: bold;"> Indicators reported here </th> </tr> </thead> <tbody> <tr grouplength="6"><td colspan="2" style="border-bottom: 1px solid;"><strong>Provisioning and Cultural Services</strong></td></tr> <tr> <td style="text-align:left;padding-left: 2em;" indentlevel="1"> Seafood Production </td> <td style="text-align:left;"> Landings; commercial total and by feeding guild; recreational harvest </td> </tr> <tr> <td style="text-align:left;padding-left: 2em;" indentlevel="1"> Profits </td> <td style="text-align:left;"> Revenue decomposed to price and volume </td> </tr> <tr> <td style="text-align:left;padding-left: 2em;" indentlevel="1"> Recreation </td> <td style="text-align:left;"> Days fished; recreational fleet diversity </td> </tr> <tr> <td style="text-align:left;padding-left: 2em;" indentlevel="1"> Stability </td> <td style="text-align:left;"> Diversity indices (fishery and ecosystem) </td> </tr> <tr> <td style="text-align:left;padding-left: 2em;" indentlevel="1"> Social & Cultural </td> <td style="text-align:left;"> Community engagement/reliance status </td> </tr> <tr> <td style="text-align:left;padding-left: 2em;" indentlevel="1"> Protected Species </td> <td style="text-align:left;"> Bycatch; population (adult and juvenile) numbers, mortalities </td> </tr> <tr grouplength="4"><td colspan="2" style="border-bottom: 1px solid;"><strong>Supporting and Regulating Services</strong></td></tr> <tr> <td style="text-align:left;padding-left: 2em;" indentlevel="1"> Biomass </td> <td style="text-align:left;"> Biomass or abundance by feeding guild from surveys </td> </tr> <tr> <td style="text-align:left;padding-left: 2em;" indentlevel="1"> Productivity </td> <td style="text-align:left;"> Condition and recruitment of managed species, Primary productivity </td> </tr> <tr> <td style="text-align:left;padding-left: 2em;" indentlevel="1"> Trophic structure </td> <td style="text-align:left;"> Relative biomass of feeding guilds, Zooplankton </td> </tr> <tr> <td style="text-align:left;padding-left: 2em;" indentlevel="1"> Habitat </td> <td style="text-align:left;"> Estuarine and offshore habitat conditions </td> </tr> </tbody> </table> ] --- # State of the Ecosystem Workflow  --- # Data Needed 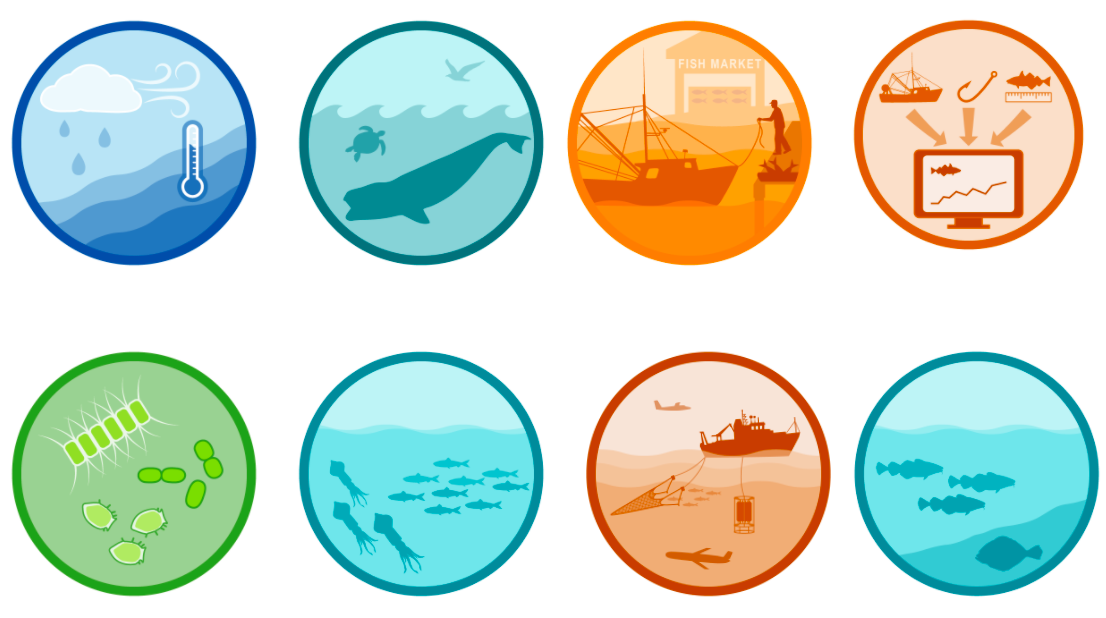 --- # Data Structure .pull-left[ [Desired data structure for delivery](https://noaa-edab.github.io/ecodata/data_guidelines) - Long format - Five Columns - Time - Var - Value - Units - EPU - [Metadata and Methods description](https://noaa-edab.github.io/tech-doc/right-whale-abundance.html) ] .pull-right[ Example North Atlantic Right Whale Adult Abundance and Calf Births - `ecodata::narw` ``` ## # A tibble: 6 x 5 ## Time Var Value Units EPU ## <dbl> <chr> <dbl> <chr> <chr> ## 1 1990 Lower95 261 n All ## 2 1990 Median 264 n All ## 3 1990 Upper95 267 n All ## 4 1990 Calves 12 n All ## 5 1991 Lower95 267 n All ## 6 1991 Median 271 n All ``` ] --- # Data Delivery Pathways 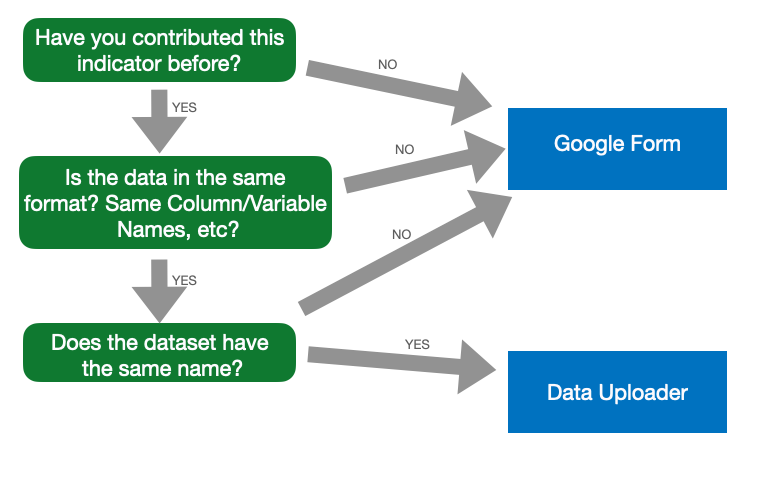 --- # Expectations ## What we expect of data contributors - Dataset - Format doesn't matter so much (.csv, .xls, .rda, .netcdf, etc) - metadata/methods - for technical documentation - participation in meetings relevant to your data and edits on that section of the final documents. ## What data contributors can expect from us - Credit for your work - Acknowledgments in SOEs - Authorship in Technical Documentation in NOAA Institutional Repository - Venue for presenting information to Councils/SSCs - Lots of emails :( --- ## References .contrib[ <a name=bib-bastille_improving_2020></a>[Bastille, K. et al.](#cite-bastille_improving_2020) (2020). "Improving the IEA Approach Using Principles of Open Data Science". In: _Coastal Management_ 0.0. Publisher: Taylor & Francis \_ eprint: https://doi.org/10.1080/08920753.2021.1846155, pp. 1-18. ISSN: 0892-0753. DOI: [10.1080/08920753.2021.1846155](https://doi.org/10.1080%2F08920753.2021.1846155). URL: [https://doi.org/10.1080/08920753.2021.1846155](https://doi.org/10.1080/08920753.2021.1846155) (visited on Dec. 09, 2020). <a name=bib-depiper_operationalizing_2017></a>[DePiper, G. S. et al.](#cite-depiper_operationalizing_2017) (2017). "Operationalizing integrated ecosystem assessments within a multidisciplinary team: lessons learned from a worked example". En. In: _ICES Journal of Marine Science_ 74.8, pp. 2076-2086. ISSN: 1054-3139. DOI: [10.1093/icesjms/fsx038](https://doi.org/10.1093%2Ficesjms%2Ffsx038). URL: [https://academic.oup.com/icesjms/article/74/8/2076/3094701](https://academic.oup.com/icesjms/article/74/8/2076/3094701) (visited on Mar. 09, 2018). ] ## Additional resources * [Notes page for meeting](https://docs.google.com/document/d/1f8ScxKfMVqeBLJyjk1DD8H8lRJyfSTyBXz9WfK4g9bs/edit) * [ecodata R package](https://github.com/noaa-edab/ecodata) * [SOE Technical Documentation](https://noaa-edab.github.io/tech-doc) * [Draft indicator catalog](https://noaa-edab.github.io/catalog/) .contrib[ * Slides available at https://noaa-edab.github.io/presentations * Contact: <kimberly.bastille@noaa.gov> ] ## Thank You!