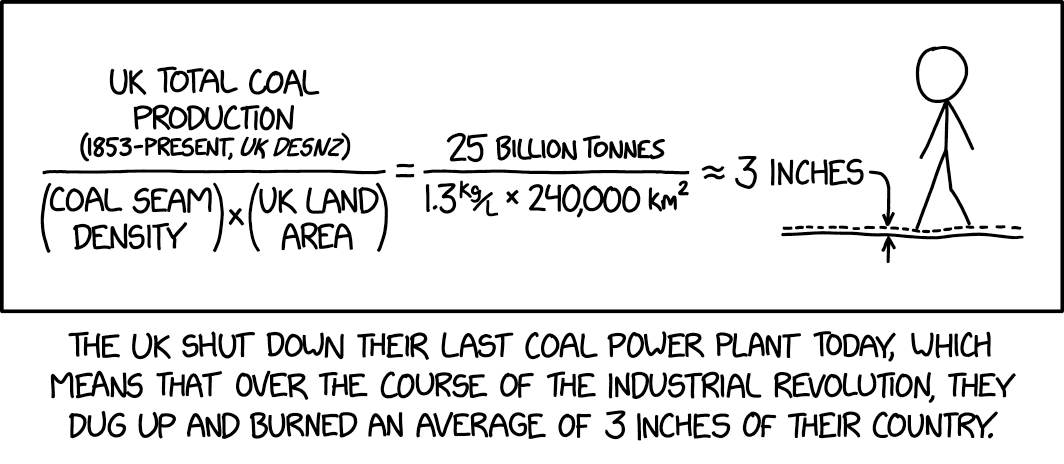
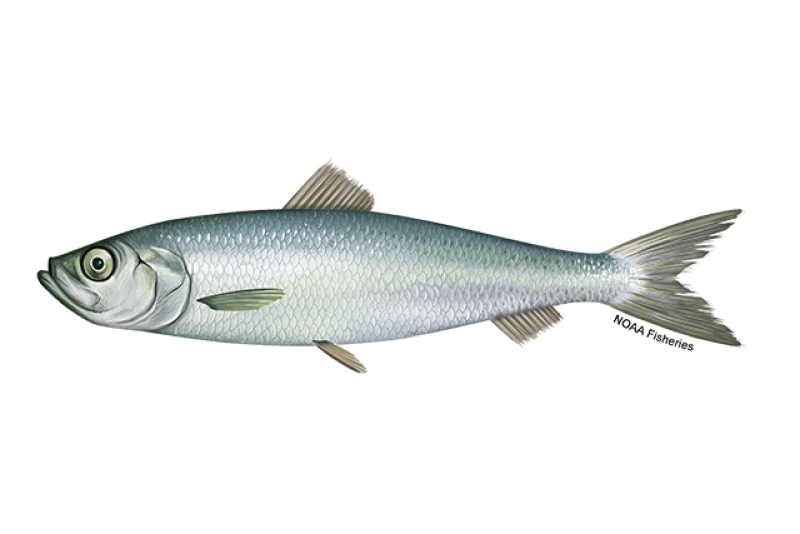
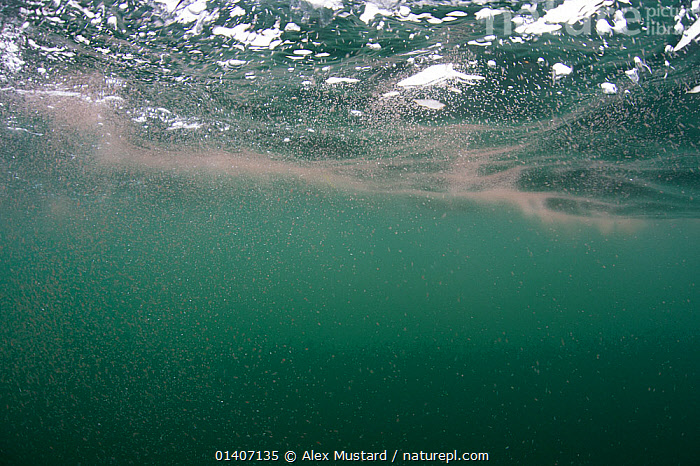
class: right, middle, my-title, title-slide .title[ # Multispecies models: US update ] .subtitle[ ## WGSAM ToR a, 7 October 2024 ] .author[ ### Sarah Gaichas, Presenter<br /><br /><br />Contributors: Alberto Rovellini, Andy Beet, Joe Caracappa, Gavin Fay (UMass Dartmouth),<br />Robert Gamble, Max Grezlik (UMass Dartmouth), Isaac Kaplan, Emily Liljestrand, Sean Lucey (RWE), Maria Cristina Perez (UMass Dartmouth), James Thorson, Sarah Weisberg (Stony Brook U and NOAA), Robert Wildermuth ] --- class: top, left # Updates .pull-left-40[ ## Since WGSAM 2023 * Atlantis climate and port integration, Northeast US (NEUS) * Atlantis ecosystem yield (Gulf of Alaska) * Rpath + Ascendancy and resilience + Portfolio management * EcoState * Single species applications + Stock assessment + Risk assessment ] .pull-right-60[  .right[.contrib[One week ago today; https://xkcd.com/2992/]] ] ??? Everyone loves an update --- background-image: url("https://github.com/NOAA-EDAB/presentations/raw/master/docs/EDAB_images/Balance_concept.png") background-size: 700px background-position: right # More Diverse uses of end to end and food web models ## Atlantis ↓ and Rpath → .pull-left[  ] .pull-right[] --- background-image: url("https://ars.els-cdn.com/content/image/1-s2.0-S030438002200148X-gr3_lrg.jpg") background-size: 500px background-position: right # Atlantis NEUSv2: ## Updates for climate scenario testing .pull-left[ ## Joe Carracappa, Andy Beet, Robert Gamble * Sensitivity to fishing scenarios (complete) * Integrating spatial fleets and ports of origin * Thermal thresholds project to integrate species temperature ranges * Climate projections using MOM-6 planned * Testing ecosystem overfishing indicators for the Northeast US .footnote[https://github.com/NOAA-EDAB/neus-atlantis] ] .pull-right[] --- background-image: url("https://github.com/NOAA-EDAB/presentations/raw/master/docs/EDAB_images/WGSAM24_GOA_Rovellini.png") background-size: contain ??? Albi Rovellini's ongoing work on evaluating GOA optimum yield with Atlantis. This is part of a study on multispecies fishing simulations under different climate regimes and fishing configurations. * Gulf of Alaska groundfish is managed with a multispecies ecosystem cap on annual catch allocations * Optimum Yield cap = 800,000 mt each year, sum of single-species ABC must be lower * Similar system in the Bering Sea, but higher cap (2M t) * Since 1987, the GOA OY cap has never constrained catch allocations (unlike the Bering Sea cap), suggesting that the OY cap may be too high for the productivity of GOA stocks * Given its history and projected climate change in the GOA, should we expect the OY cap to constrain GOA catches in the future? * Multispecies fishing simulations with Atlantis, 4 climate-fishing combinations: * Fishing: (1) all stocks fished at equal multipliers of FMSY; (2) same as (1) except arrowtooth flounder is only lightly exploited * Climate: from ROMS, (1) pre-heatwave 1999 cool conditions; (2) high CO2 emissions, end of century scenario Results: Underexploitation of key groundfish predator Arrowtooth flounder (right-hand column) leads to lower global yield, because arrowtooth predates on groundfish (mostly walleye pollock). Arrowtooth flounder is currently lightly exploited because it has limited commercial value Warmer climate (bottom row) leads to lower global yield, largely because of near collapse of Pacific cod under warm conditions mediated by recruitment failure TAKE HOME MESSAGE: The OY cap in the GOA is unlikely to constrain fishery allocations in the future --- background-image: url("https://raw.githubusercontent.com/NOAA-EDAB/presentations/master/docs/EDAB_images/Weisberg_PopDy_Poster_2023.png") background-size: 700px background-position: right ## Rpath: Relative ascendency for three adjacent food webs .pull-left-40[ Sarah Weisberg PhD thesis Highlight key groups within food webs and identify regime shifts * Ecological network analysis shows different potential resilience across MAB, GB, GOM, and regimes in Gulf of Maine food web efficiency/resilience. * Benthic vs pelagic groups across the three systems * Highly efficient food webs have lower resilience due to fewer trophic pathways decreasing redundancy. * The Gulf of Maine had low resilience in the 2000s, corresponding to poor fish condition .footnote[p.s. [Shiny GOM used in IEA course](https://connect.fisheries.noaa.gov/content/6c128564-f8b2-49c4-8afc-614f9e2e7a5b/)] ] .pull-right-60[] ??? *Advancing the Utility of Food Web-Derived Indicators to Support Ecosystem-Based Fisheries Management* --- background-image: url("https://raw.githubusercontent.com/NOAA-EDAB/presentations/master/docs/EDAB_images/WGSAM24_portfiolio_Grezlik.png") background-size: 720px background-position: right ## Rpath: Supporting Portfolio Theory Management of Georges Bank Fisheries .pull-left-40[ Max Grezlik PhD Thesis Efficiency frontiers quantify revenue and financial risk taken to achieve a given revenue. Red and blue lines compare an expanded groundfish complex to single species management of the same species. The point is the observed revenue and risk of forgone revenue for a given year. Preliminary results suggest the current, 13-species complex allows for some benefits beyond what single species management would achieve. The distance between observed and EBFM frontier suggests there is added economic benefit to expanding the current complex. ] .pull-right-60[ ] ??? Goal: demonstrate the utility of diversification of fishing portfolios in New England * NEFMC efforts toward climate-resilient fisheries. * Worked example: expanding Northeast Groundfish Complex. * Fishing portfolio diversification empowers fishers to find solutions to choke stocks which have threatened the sustainability and profitability of an historic fishery. Efficiency frontiers quantify revenue and financial risk taken to achieve a given revenue. Red and blue lines compare an expanded groundfish complex to single species management of the same species. The point is the observed revenue and risk of forgone revenue for a given year. Preliminary results suggest the current, 13-species complex allows for some benefits beyond what single species management would achieve. The distance between observed and EBFM frontier suggests there is added economic benefit to expanding the current complex. --- background-image: url(https://github.com/NOAA-EDAB/presentations/raw/master/docs/EDAB_images/work-in-progress.png) background-size: 150px background-position: bottom right ## [Georges Bank Keyrun Review](https://ices-library.figshare.com/articles/report/Working_Group_on_Multispecies_Assessment_Methods_WGSAM_outputs_from_2022_meeting_/22087292) and Work in progress .pull-left[ * Challenge of place based approach for stocks with substantial dynamics outside Georges Bank: "In that case, expanding the models outside the boundaries of the EPU, and/or explicitly accounting for the input/output of fish and energy across the boundaries will likely be needed" * Dedicated R packages for data positively reviewed * Standardize diet interactions and better quantify other food in estimation models using Rpath * Do model self-tests * Model specific structural and sensitivity recommendations ] .pull-right[ ## In progress * Self tests (4 species Hydra in progress by Cristina) * Model specific recommendations + Fleet changes done, 3 fleet being implemented by Emily L + Feeding parameters done * Testing stalled but hope to resume (ToR c) * Work continues on input datasets (landings and discards) ] --- ## EcoState: new state-space [dynamic food web model](https://james-thorson-noaa.github.io/EcoState/) Jim Thorson's Paper in review: https://ecoevorxiv.org/repository/view/7476/ <iframe width="1212" height="682" src="https://james-thorson-noaa.github.io/EcoState/articles/simulation.html" title="MS-keyrun simulated data" frameborder="0" allow="accelerometer; autoplay; clipboard-write; encrypted-media; gyroscope; picture-in-picture" style="width:100%; height:100%;" allowfullscreen></iframe> ??? ## [Simulation test](https://james-thorson-noaa.github.io/EcoState/articles/simulation.html) --- # Single species applications ## Time varying natural mortality for Atlantic mackerel ## Ecological drivers of recruitment for Atlantic herring --- background-image: url("https://raw.githubusercontent.com/NOAA-EDAB/presentations/master/docs/EDAB_images/WGSAM24_PPImackerel_Smith.png") background-size: contain Laurel Smith et al. --- ## Does food drive recruitment of Atlantic herring? Create zooplankton indices to evaluate changes in food for Atlantic herring larvae, juveniles, and adults over time and in space in the Northeast US continental shelf ecosystem. Two applications: 1. Addressing uncertainty in the stock assessment for Atlantic herring (*Clupea harengus*) 1. Describing zooplankton species and group trends for integrated ecosystem assessment .pull-left[  ] .pull-right[  .footnote[ https://www.naturepl.com/stock-photo-copepods-calanus-finmarchicus-aggregated-at-the-surface-reverse-diel-nature-image01407135.html ] ] --- background-image: url("https://github.com/NOAA-EDAB/presentations/raw/master/docs/EDAB_images/AherringConceptualMod.png") background-size: 1070px background-position: bottom ## Which indicators are relevant for recruitment? --- background-image: url("https://github.com/NOAA-EDAB/presentations/raw/master/docs/EDAB_images/AherringBRT_rec.png") background-size: 800px background-position: right ## Which indicators are potential covariates for recruitment? .pull-left-30[ Boosted regression tree (Molina 2024) investigated relationships between environmental indicators and Atlantic herring recruitment estimated in the assessment. Larval and juvenile food (zooplankton), egg predation, and temperature always highest influence ] .pull-right-70[ ] --- .pull-left[ ## How to include in the stock assessment? Zooplankton example  ] .pull-right[ *The inclusion of the zooplankton index improved model fit IN THE WRONG DIRECTION.*  Haddock egg predation and thermal habitat better ] ??? --- ## Risk assessment applications for fishery managers Example: Evaluate risks posed by prey availability to achieving OY for Council managed species .pull-left[ <img src="20241007_WGSAM_ToRa_USupdate_Gaichas_files/figure-html/unnamed-chunk-1-1.png" width="504" /> <img src="20241007_WGSAM_ToRa_USupdate_Gaichas_files/figure-html/unnamed-chunk-2-1.png" width="504" /> ] .pull-right[ <img src="20241007_WGSAM_ToRa_USupdate_Gaichas_files/figure-html/unnamed-chunk-3-1.png" width="504" /> <img src="20241007_WGSAM_ToRa_USupdate_Gaichas_files/figure-html/unnamed-chunk-4-1.png" width="504" /> ] ??? Council and Advisory Panel members recommended new elements addressing human dimensions (recreational access equity), new elements addressing cross-sectoral impacts (offshore wind impacts on biology and ecosystem as well as fishery access and scientific sampling), and transitions from static ecosystem indicators to time series indicators (prey availability, predation pressure, and fishing community vulnerability). New ecosystem science was required to support these requests. The process included development of new indicators of prey availability based on spatio-temporal modeling using ecological datasets (stomach contents, zooplankton), and new spatial analyses of habitat, revenue, and surveys relative to wind energy development areas. Development of potential risk criteria is ongoing; thresholds between low, moderate, and high risk that are essential to operational use are developed collaboratively with Council and Advisory Panel members. The slide shows a higher risk example (black sea bass, low recent condition correlated with recently declining prey) and a lower risk example (bluefish, despite a long term decline in forage fish prey. recent condition has been good)