class: right, middle, my-title, title-slide # Integrated Ecosystem Assessment and <br />Ecological Forecasting: Let’s Do This ## AFS 2021 <br />Ecological Forecasting: <br />Bridging fish, ecosystems, weather, water, climate and communities ### Sarah Gaichas, Vincent Saba, and Sean Lucey <br /> Ecosystem Dynamics and Assessment <br /> Northeast Fisheries Science Center --- class: top, left ## Talk outline: * Integrated Ecosystem Assessment (IEA): what is it? * Where would ecological forecasts fit? Management needs * How do we get there? * Work with managers to determine highest priority forecasts (example--bottom temperature) * Research connecting physics-fishery outcomes through complex pathways (example--habitat forecasts based on multiple attributes) * Improve and integrate regional forecasting capability (example--[Climate Fisheries Initiative](https://www.fisheries.noaa.gov/topic/climate-change#noaa-climate-and-fisheries-initiative)) .center[ 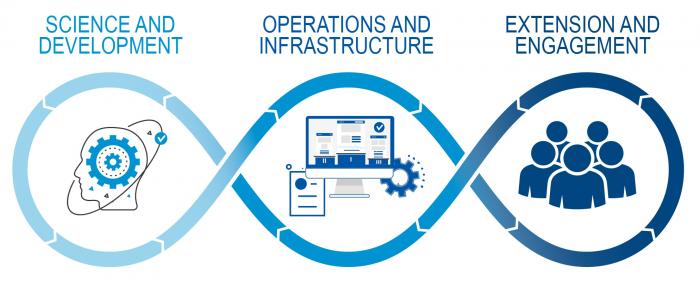 ] --- ## Integrated Ecosystem Assessment: what is it? .pull-left[ .center[ 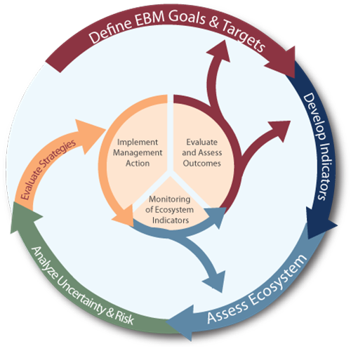 ] .footnote[ https://www.integratedecosystemassessment.noaa.gov/national/IEA-approach ] ] .pull-right[ 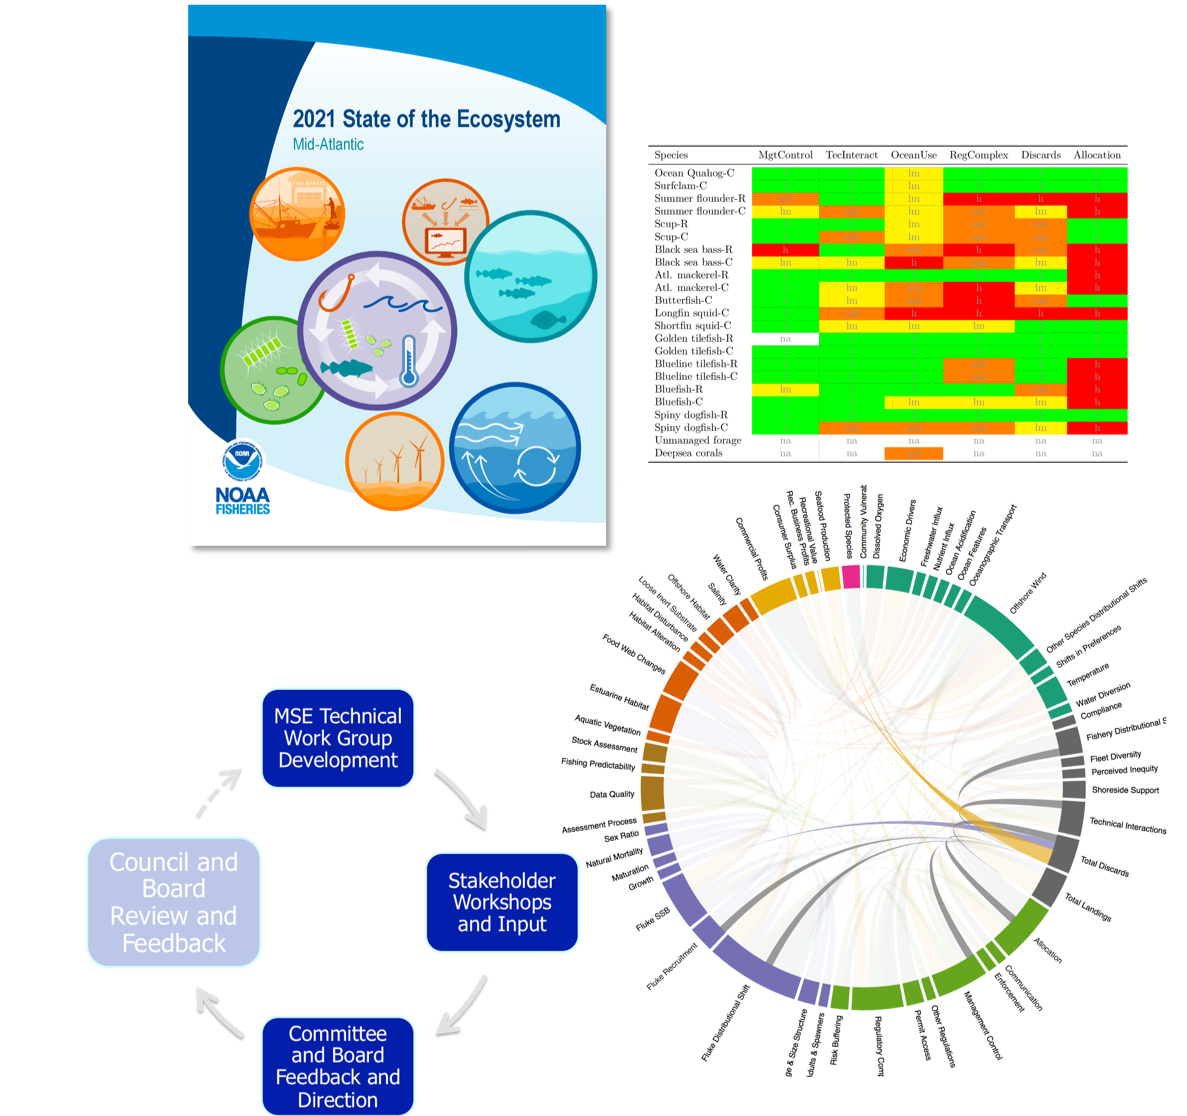 .footnote[ https://www.mafmc.org/eafm https://www.mafmc.org/actions/summer-flounder-mse ] ] ??? Integrated ecosystem assessment (IEA) is a collaborative process between managers, scientists, and stakeholders that uses multiple analyses and decision support tools to provide scientific advice for ecosystem-based management. The process begins with the definition of goals and objectives for management, then identifies information and indicators associated with these goals and objectives. Assessment of indicators relative to historical baselines or management thresholds gives information on current performance--status and trends--relative to management objectives. Indicators can also be used within risk assessment frameworks to identify and mitigate risks to meeting objectives. Indicator based assessments and risk analyses can also inform simulation-based management strategy evaluations that characterize potential performance of alternative management actions and tradeoffs between objectives associated with those actions. We illustrate the use of IEA in fisheries management with examples from the Northeast US. --- background-image: url("EDAB_images/ClimateFisheriesCover.png") background-size: 550px background-position: right ## Where would ecological forecasts fit? # Management needs - Real world examples - Immediately useful + Inseason management + Quota specification + Management strategy evaluation + Ecosystem based management ??? ??? While ecological forecasts would be extremely useful in IEA, current applications mainly rely on historical indicator trends because few marine fisheries ecological forecasts exist. The most useful ecological forecasts for fisheries management may be among the most difficult to achieve: seasonal to decadal ecological forecasts of multiple system attributes in particular regions. --- ## Subannual ecological forecasts: *Illex* squid fishery .pull-left[ .center[ 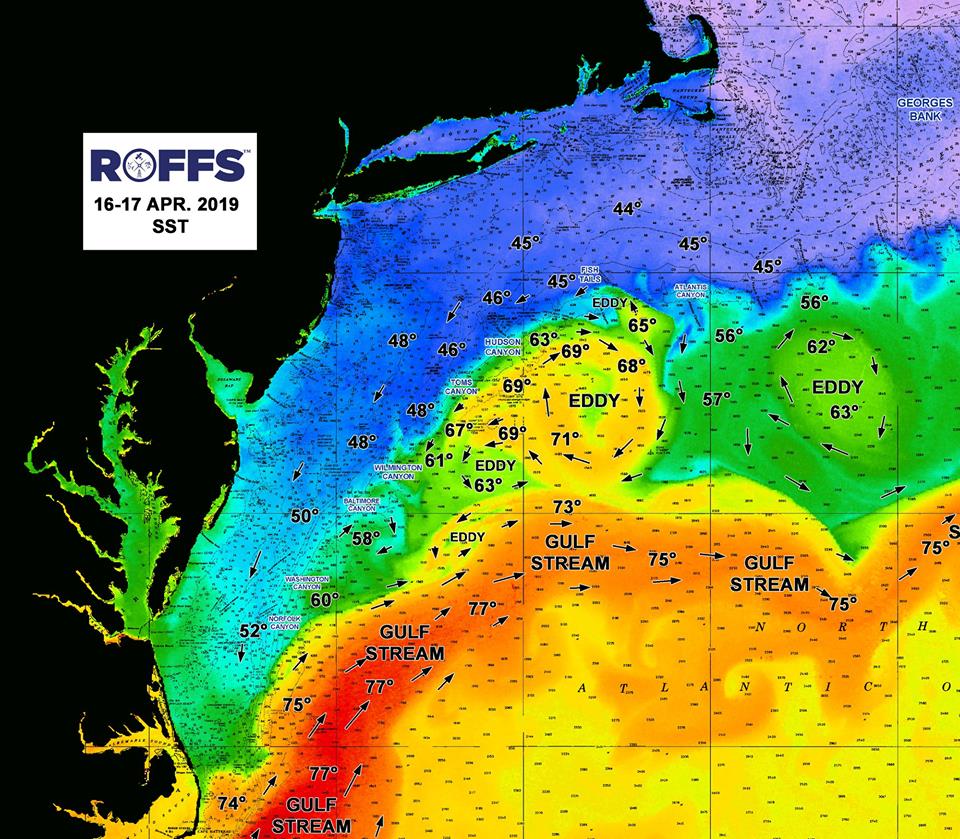 ] ] .pull-right[ .center[  ] ] .footnote[ Manderson, J. 2020. Summary report Northern shortfin squid (*Illex illecebrosus*) population ecology and the fishery Summit, November 25-26, 2019 Wakefield, Rhode Island, available [here](https://www.dropbox.com/s/k3x0v53kyhaoj2a/DraftSummary_NorthernShortfinSquidPopulationEcologyAndTheFisherySummit_03242020.pdf?dl=0). Tommasi, D., Stock, C.A., Pegion, K., Vecchi, G.A., Methot, R.D., Alexander, M.A., and Checkley, D.M. 2017. Improved management of small pelagic fisheries through seasonal climate prediction. Ecological Applications 27(2): 378–388. doi:10.1002/eap.1458. ] ??? --- ## 1-3 year forecasts: yellowtail flounder climate-informed assessment .pull-left[  ] .pull-right[  .contrib[ https://timjmiller.github.io/wham/articles/ex2_CPI_recruitment_SNEMA_yellowtail.html ] ] .footnote[ Lentz, S.J. 2017. Seasonal warming of the Middle Atlantic Bight Cold Pool. Journal of Geophysical Research: Oceans 122(2): 941–954. doi:10.1002/2016JC012201. Miller, T.J., Hare, J.A., and Alade, L.A. 2016. A state-space approach to incorporating environmental effects on recruitment in an age-structured assessment model with an application to southern New England yellowtail flounder. Can. J. Fish. Aquat. Sci. 73(8): 1261–1270. doi:10.1139/cjfas-2015-0339. ] ??? note: 1. the improved fits from including the cold pool index in the stock-recruit function 2. the increased uncertainty in projections as we no longer have cold pool index observations If we had good projections of the inputs to the cold pool index from a regional ocean model, WHAM could incorporate this modeled cold pool index into projections, addressing one of the issues for fishery management (fitting to an index in the past is great, but how do we project?). Brian Stock: "the lag between CPI and recruitment means the CPI doesn't need to be projected as far as you'd think at first. In this case you could use 3-4 month projected CPI to project 2 years of recruitment. The CPI uses Sept-Oct bottom temp data from the fall trawl survey, and the assessment is done ~Sept. Since the 2019 assessment uses fish data thru 2018, to use a projected 2019 CPI you'd only need to forecast Sept-Oct temps from ~July. And the 1st year of projected recruitment (2019) would use an observed CPI (fall 2018), don't even need a projection." --- ## 1-3 year forecasts: yellowtail flounder climate-informed assessment .pull-left[  ] .pull-right[  ] .footnote[ Chen, Z., Curchitser, E., Chant, R., and Kang, D. 2018. Seasonal Variability of the Cold Pool Over the Mid-Atlantic Bight Continental Shelf. Journal of Geophysical Research: Oceans 123(11): 8203–8226. doi:10.1029/2018JC014148. ] ??? One regional ocean model compared with observations from a glider demonstrates that regional ocean modeling capability exists, and the point of the new NOAA Climate and Fisheries Initiative would be to bring such capability together with assessments using tools like WHAM --- ## Forecasts and projections: management strategy evaluation .center[  ] .footnote[ Lisa A. Kerr, Sam Truesdell, Gavin Fay, Jonathan Cummings, Ashley Weston, Steven X. Cadrin, Sarah Gaichas, Min-Yang Lee, Anna Birkenbach, Andrew Pershing. Evaluating the Performance of Northeast Groundfish Fisheries Management in a Changing Climate (funded by NOAA COCA:NA17OAR4310272, 7/1/17-6/30/20) ] --- ## Forecasts and projections: ecosystem based fishery management .pull-left[ .center[  ] Bering Sea FEP Action Module 1: Evaluate short- and long-term effects of climate change on fish and fisheries, and develop management considerations ] .pull-right[ .center[ 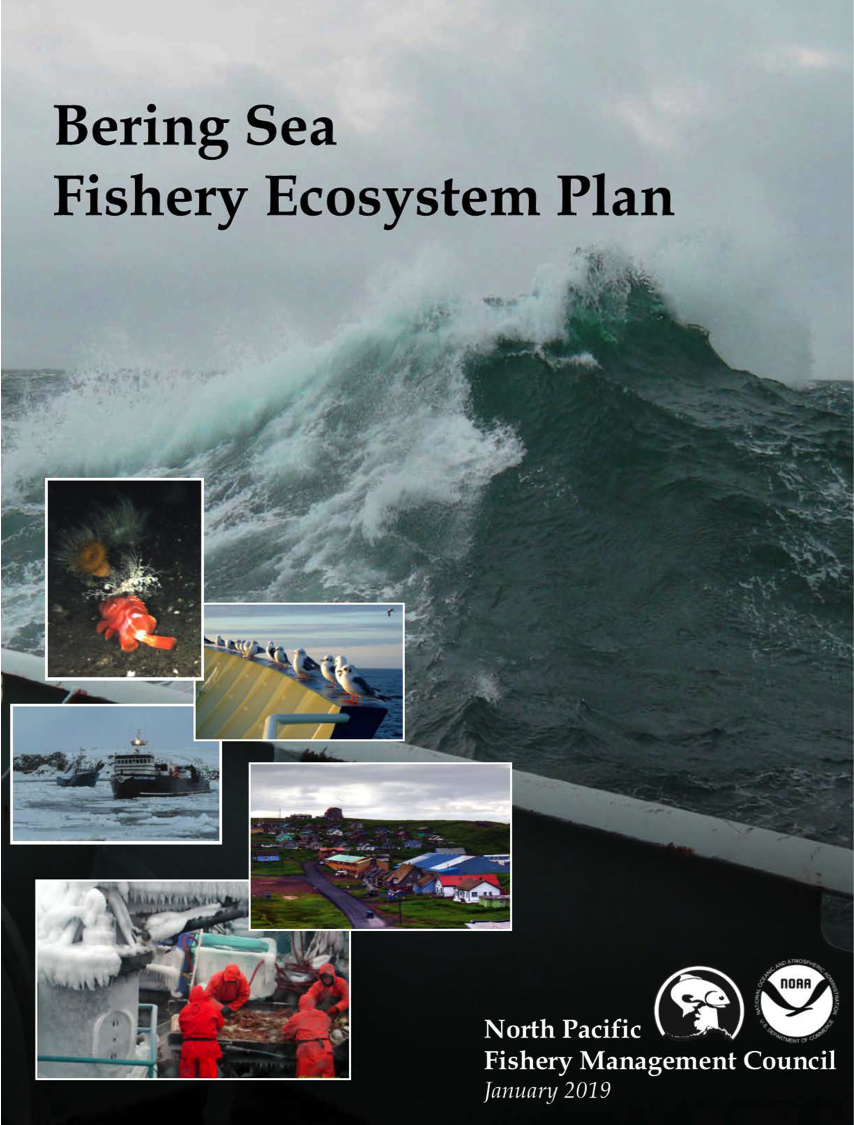 ] ] ??? Objectives: (1) coordinate to synthesize results of various ongoing and completed climate change research projects; (2) evaluate the scope of impacts on priority species identified in initial studies; and (3) strategically revaluate management strategies every 5-7 years; (4) include synthesis to evaluate climate-resilient management tools. The climate change Action Module team will work with the Council to iteratively identify and assess the performance of potential short-term, medium and long-term management actions for climate adaptation (i.e., derive alternative strategies for MSEs). --- ## Ecosystem status--improve with forecasts .pull-left[ .center[ 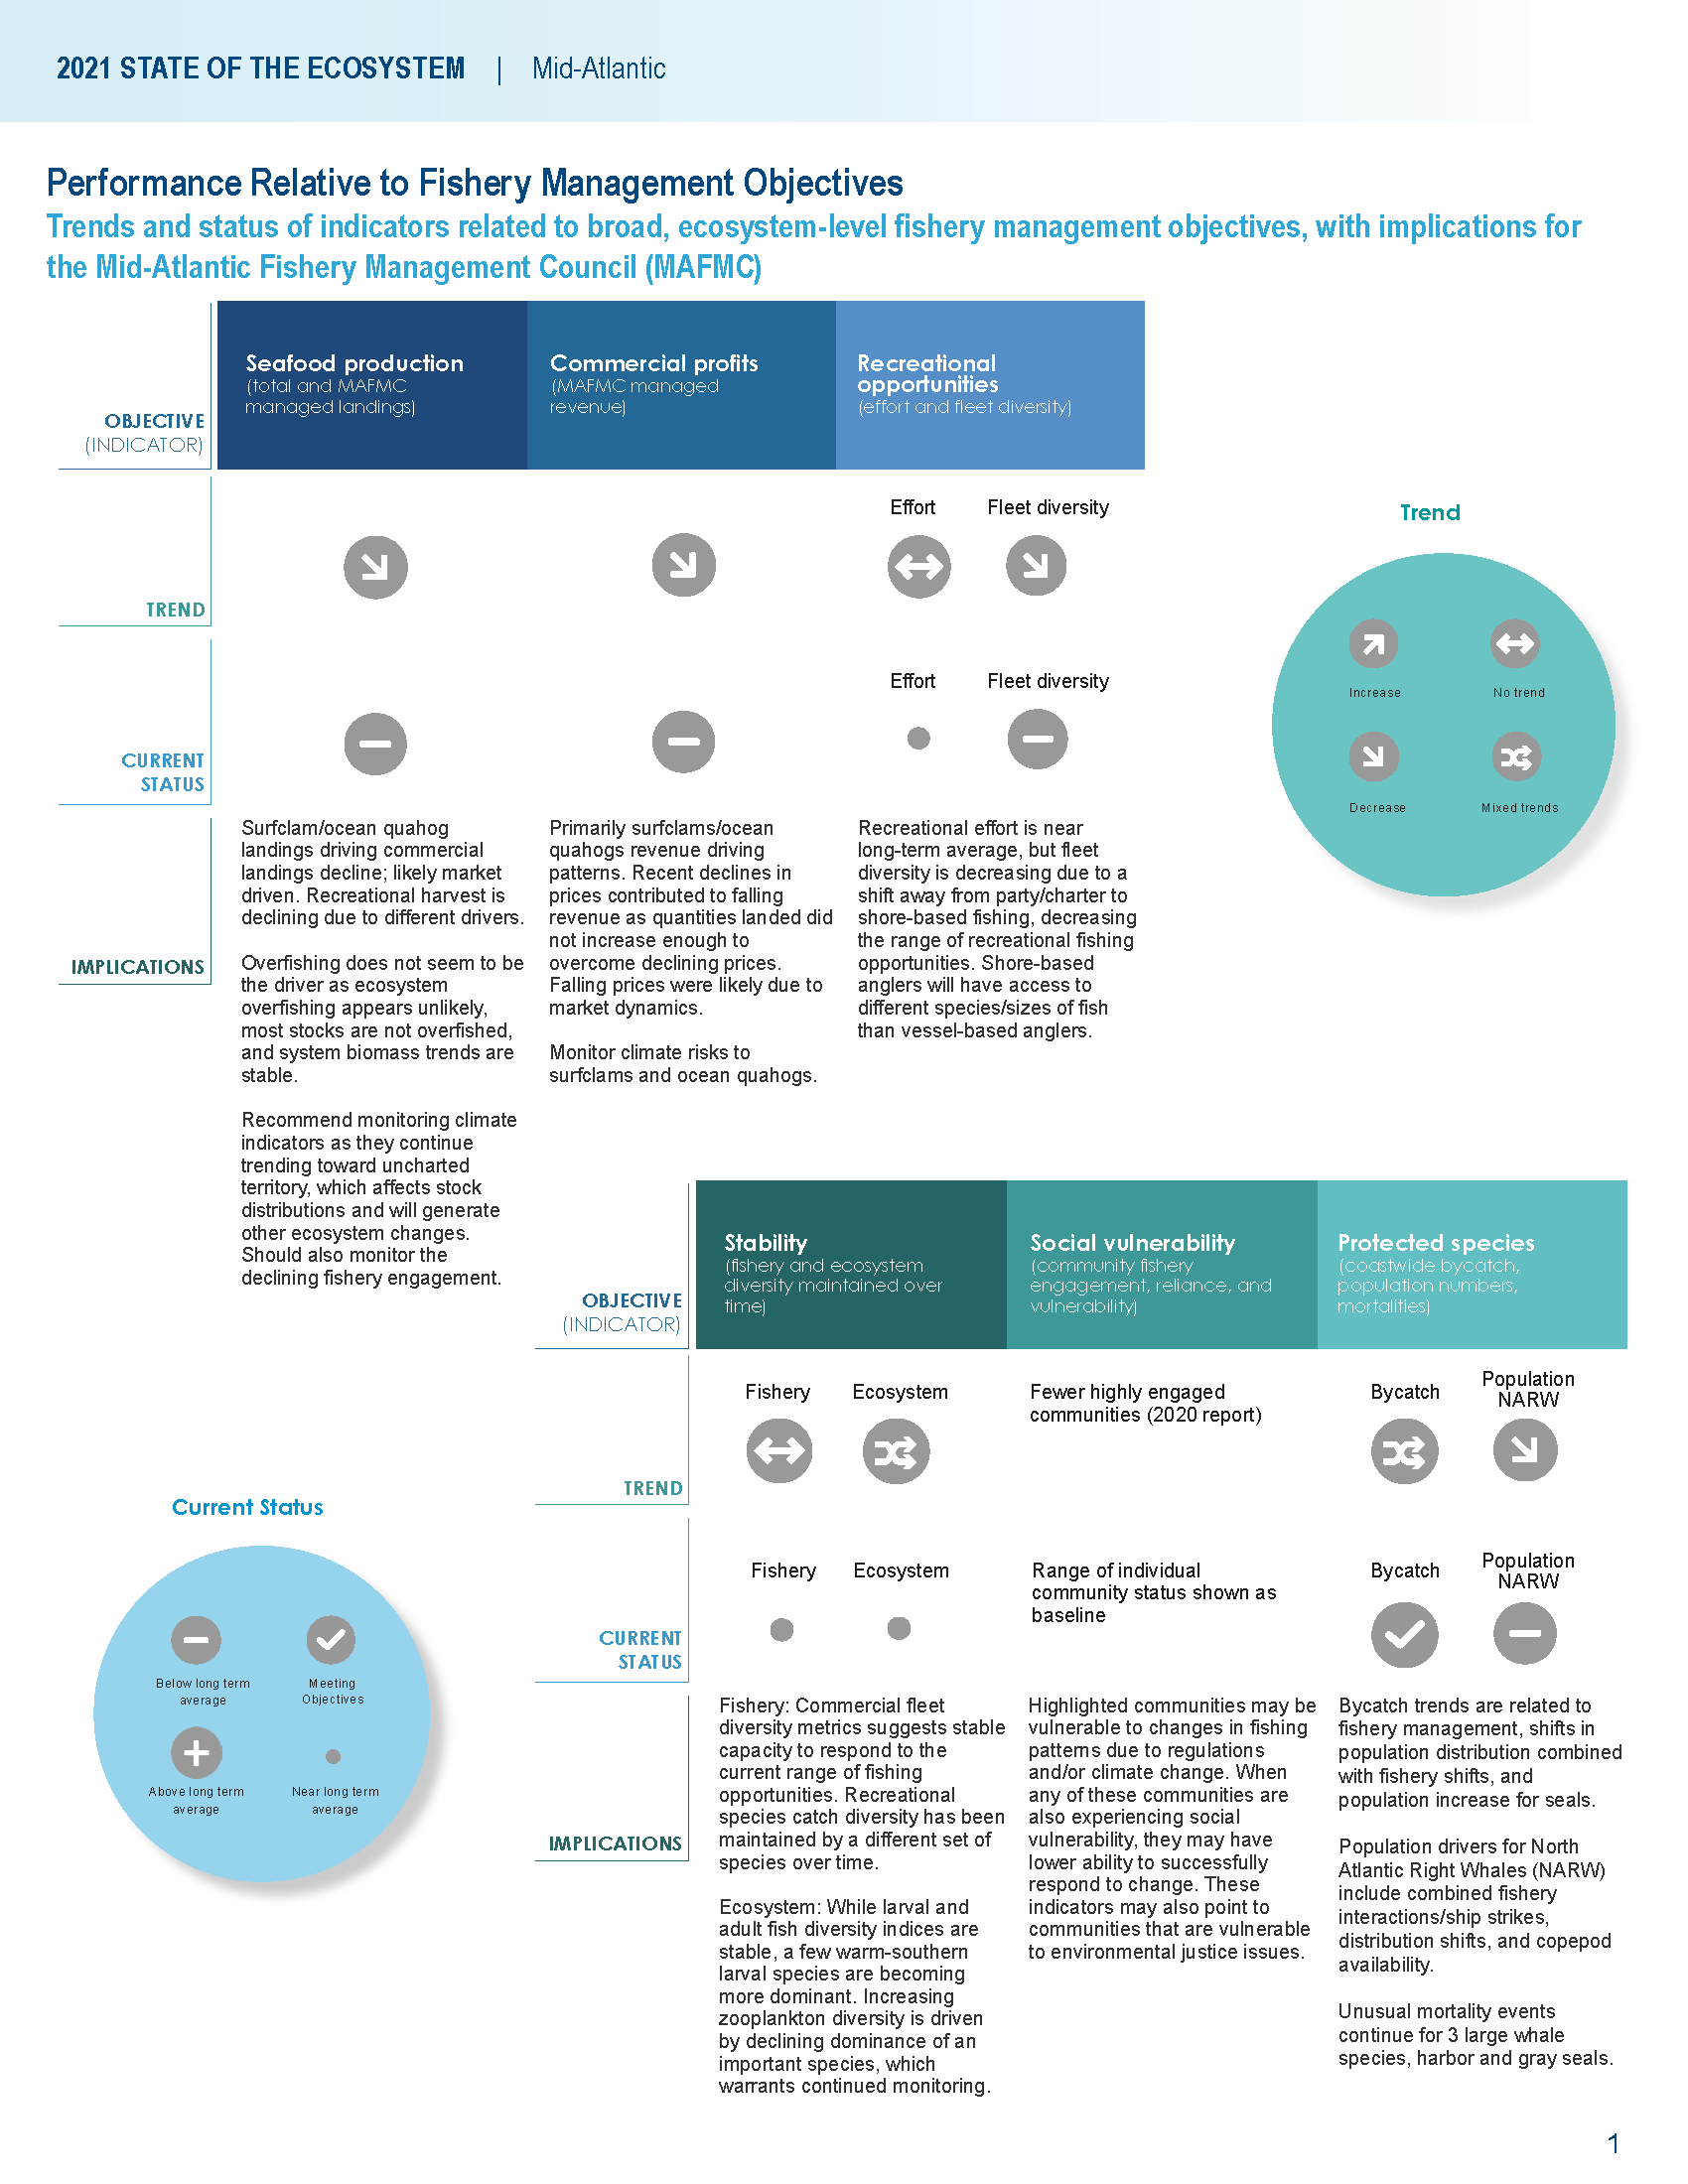 ] ] .pull-right[ .center[ 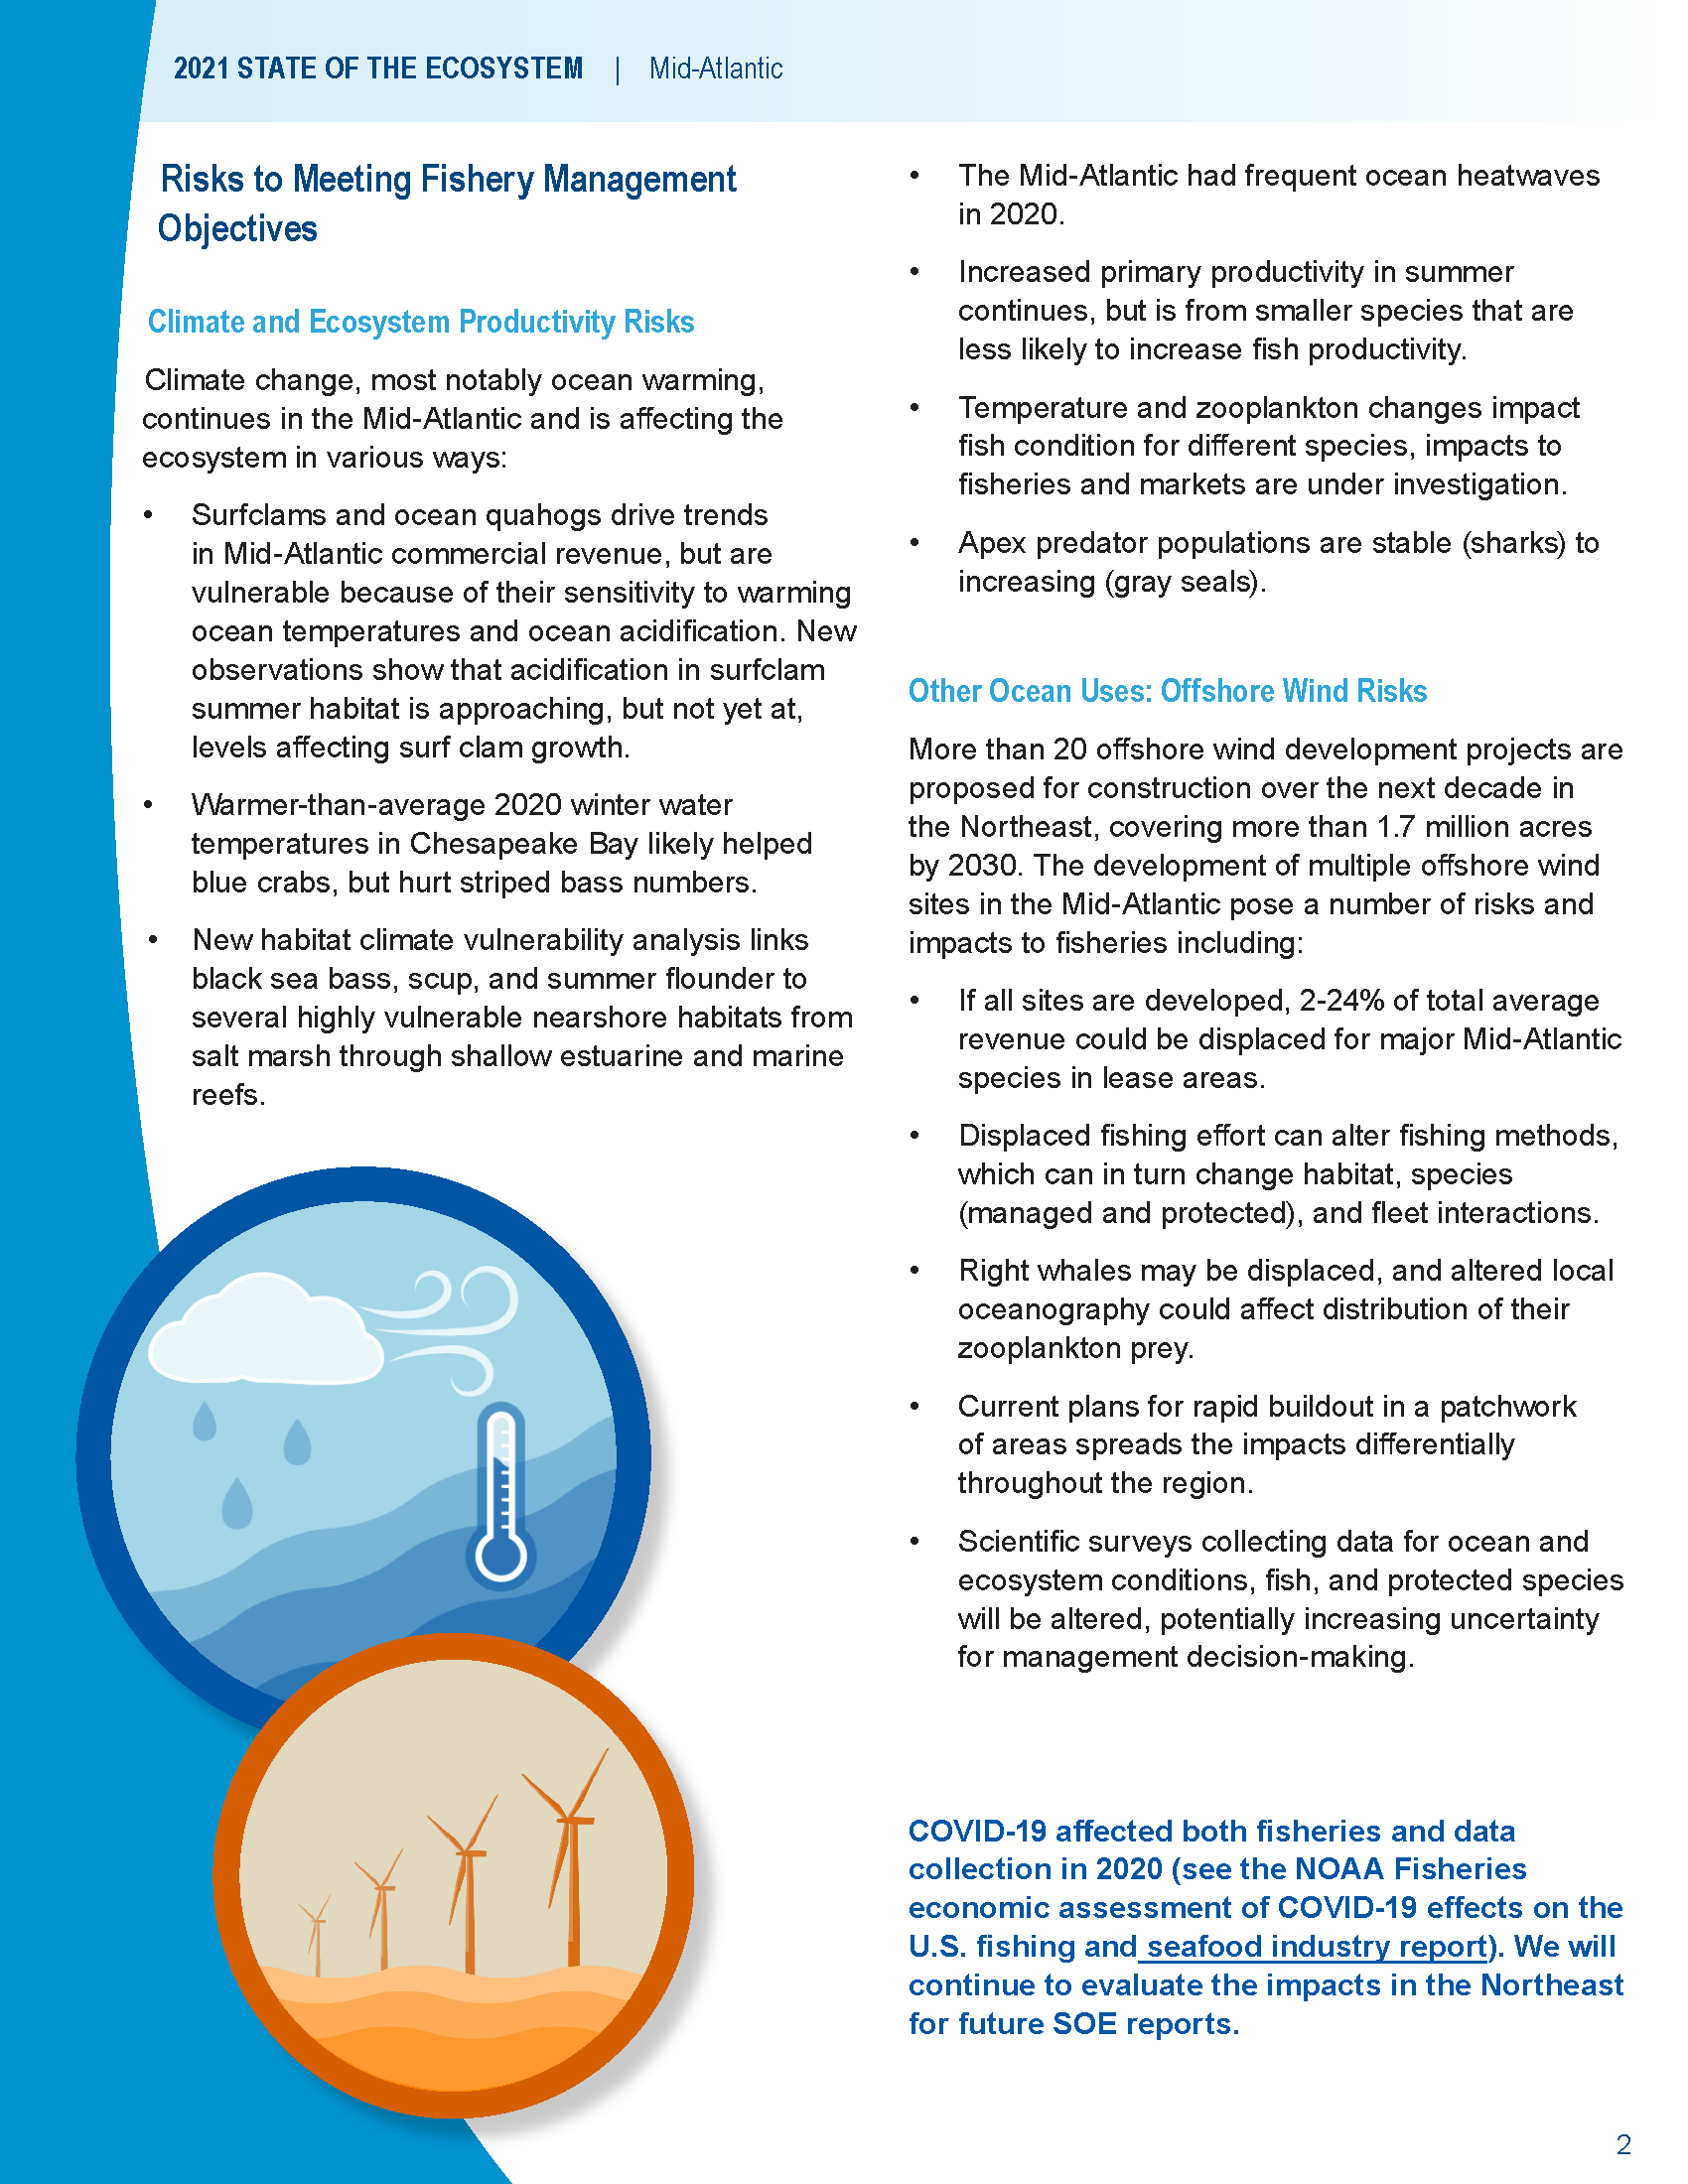 ] ] --- ## How do we get there? 1. Integrate data sources .pull-left[ 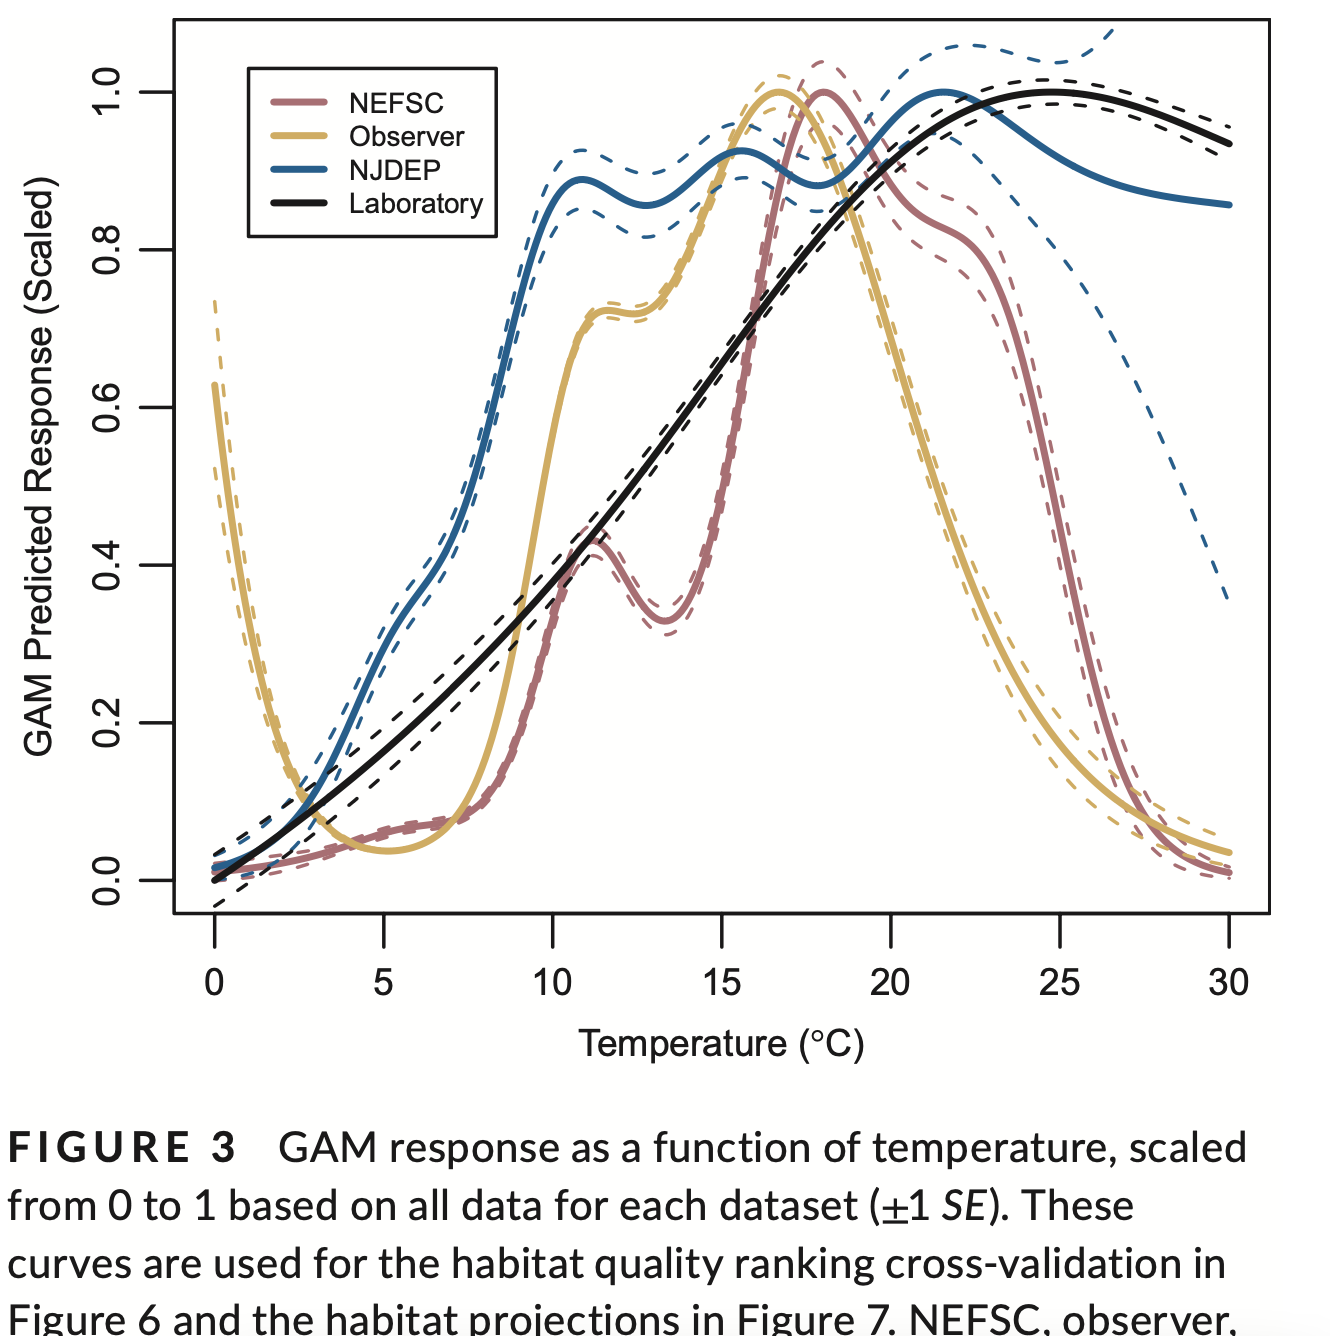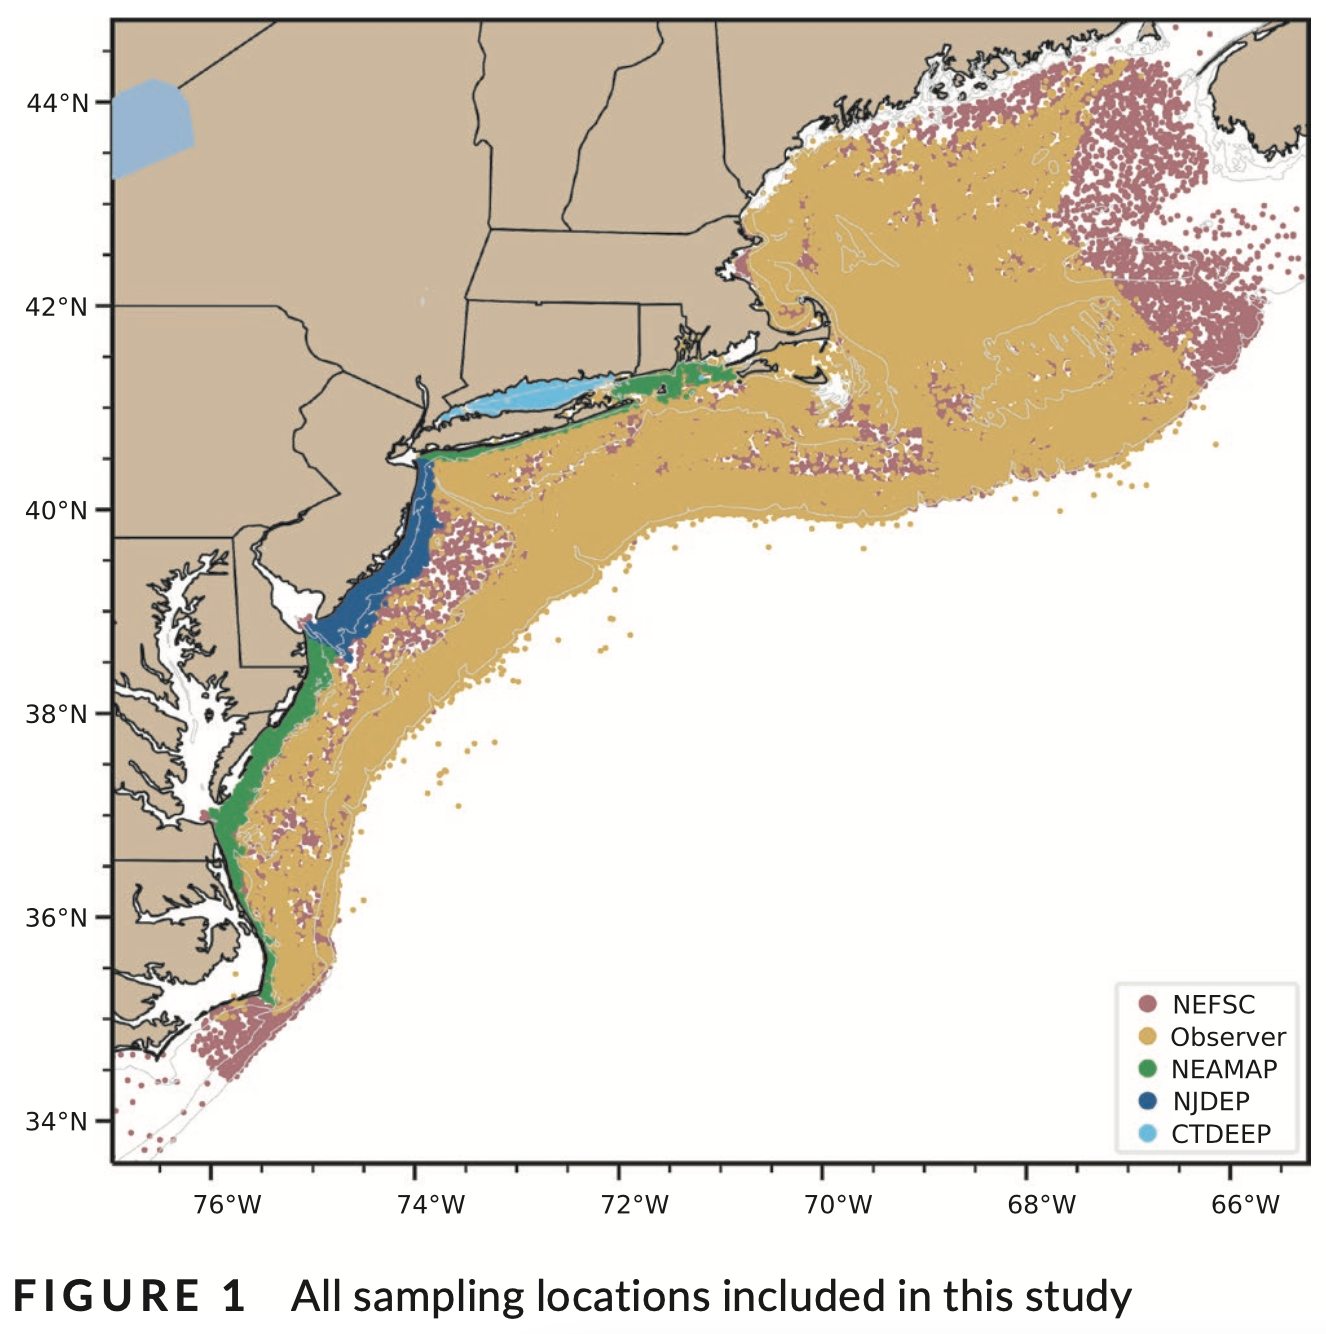 Black sea bass thermal habitat: Spring (left column) and Fall (right column) * NEFSC trawl survey (top) * Fishery observers (center) * Lab experiments (bottom) ] .pull-right[ 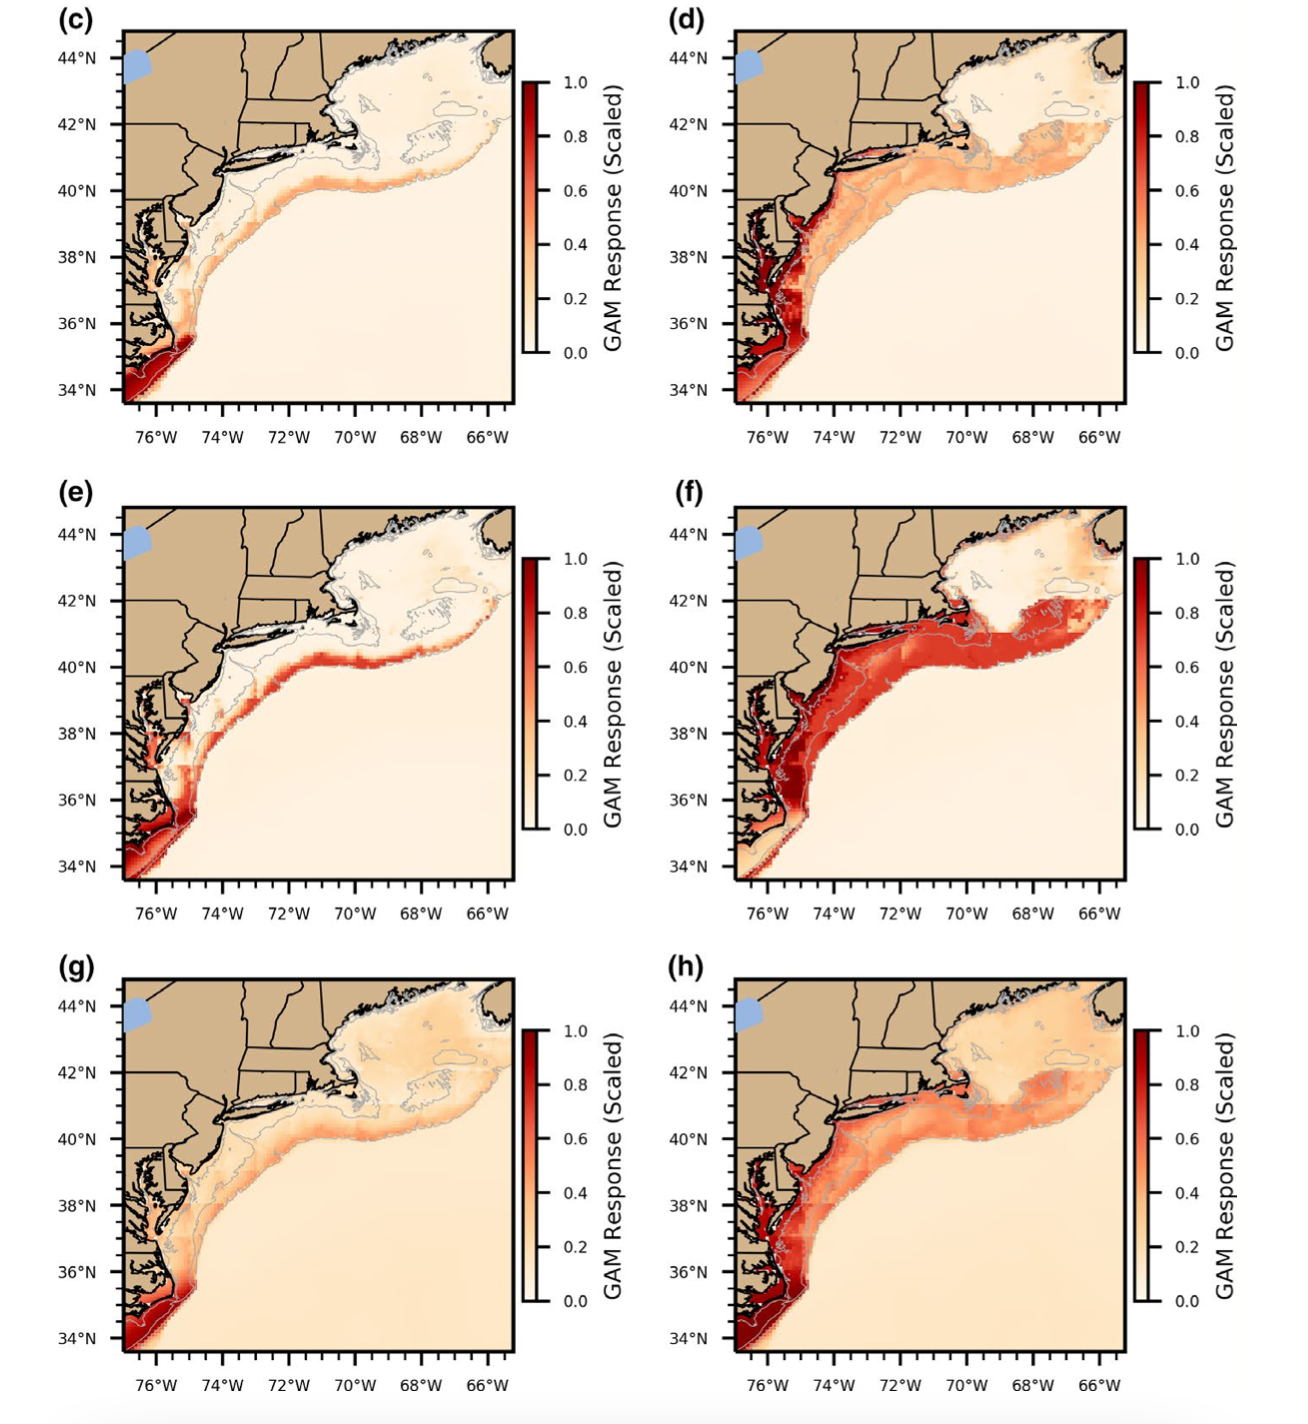 ] .footnote[ Nazzaro, L., E. Slesinger, J. Kohut, G. K. Saba, and V. S. Saba. 2021. Sensitivity of marine fish thermal habitat models to fishery data sources. Ecology and Evolution 11(19):13001–13013. ] ??? Process-based research connecting biophysical variables to managed species physiology and population dynamics is in progress. --- ## How do we get there? 2. Evaluate skill .pull-left[ *Observed bottom temperature* <img src="20211029_AFSEcoforecasting_Gaichas_files/figure-html/unnamed-chunk-2-1.png" width="360" style="display: block; margin: auto;" /> 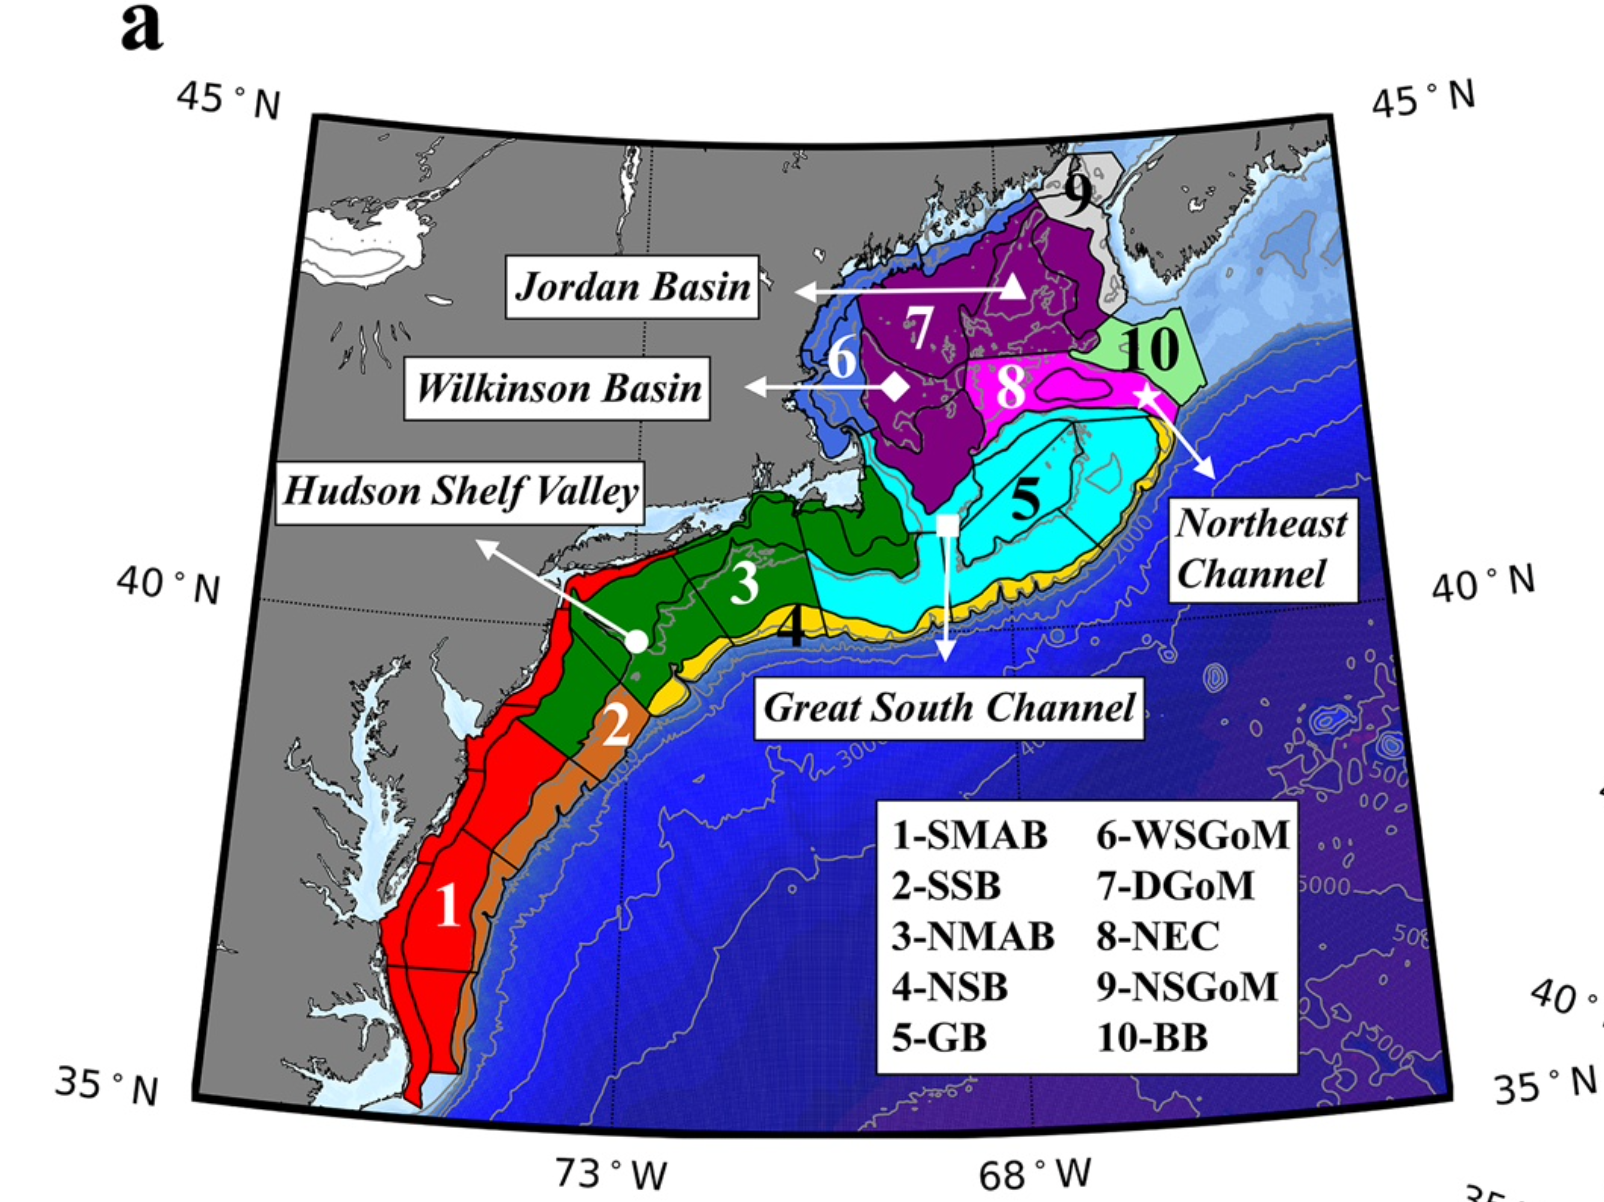 ] .pull-right[ *Bottom temperature forecast skill* 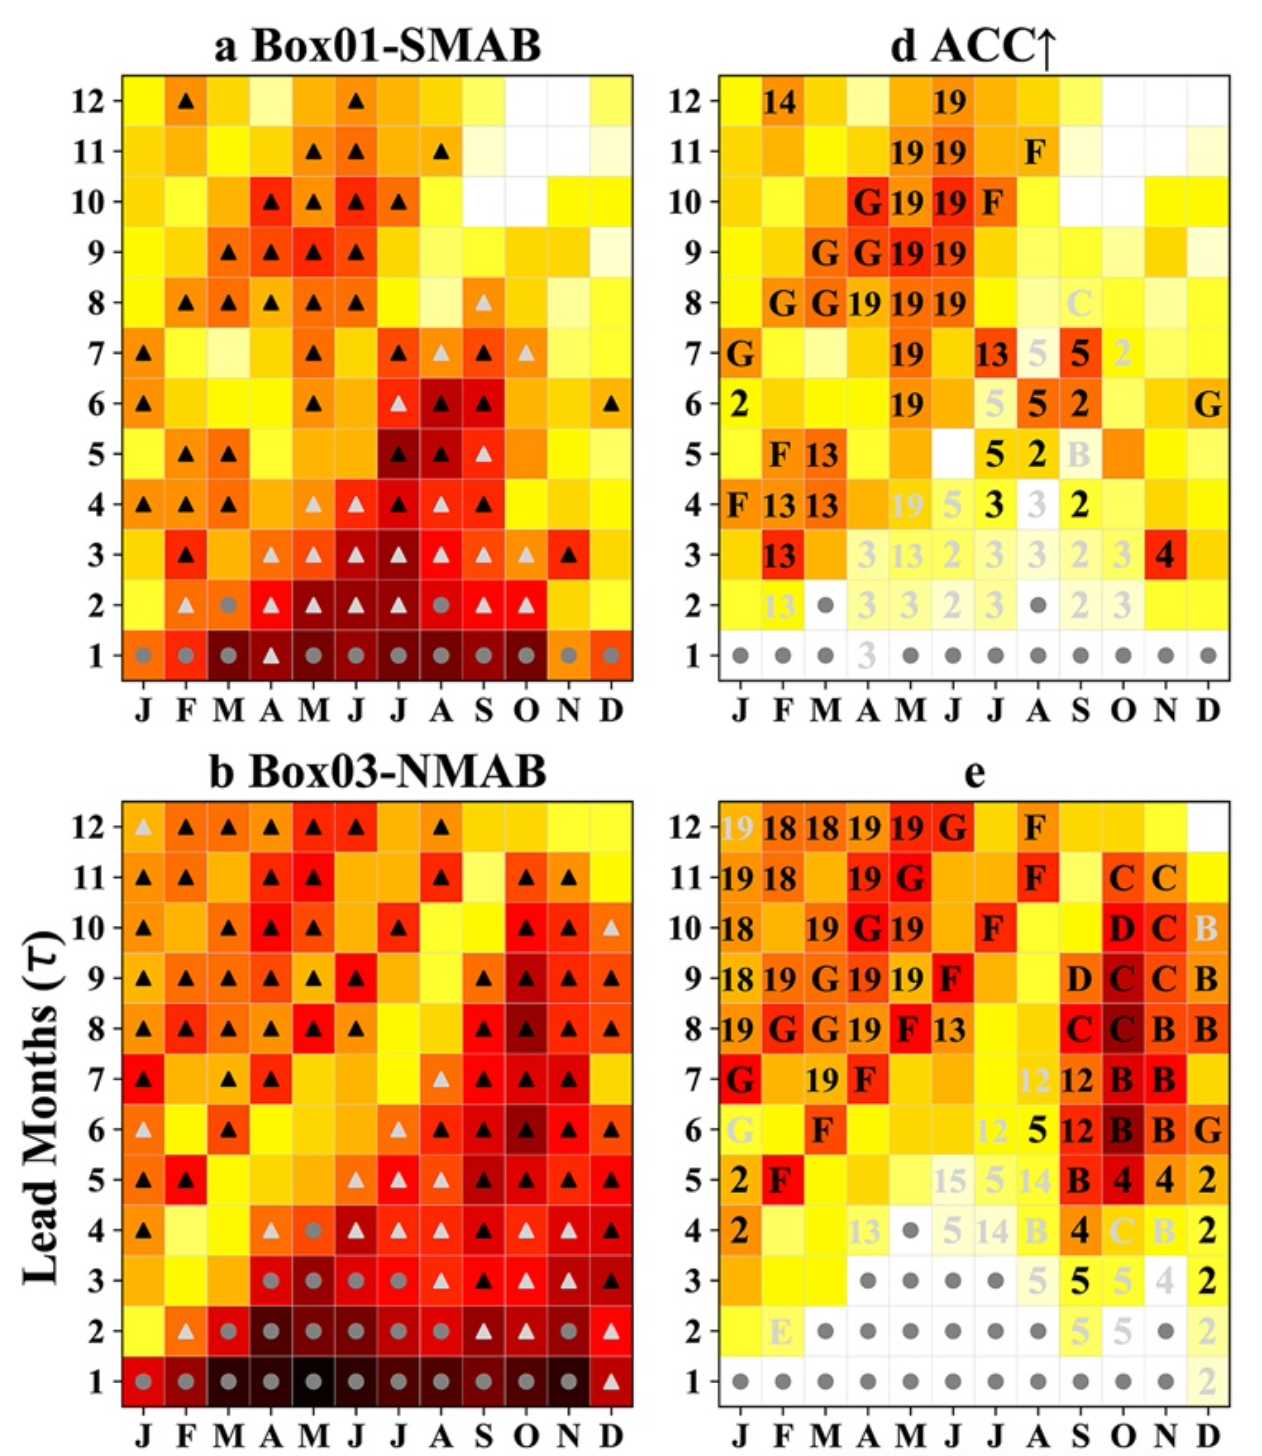 ] .footnote[ Chen, Z., Y.-O. Kwon, K. Chen, P. Fratantoni, G. Gawarkiewicz, T. M. Joyce, T. J. Miller, J. A. Nye, V. S. Saba, and B. C. Stock. 2021. Seasonal Prediction of Bottom Temperature on the Northeast U.S. Continental Shelf. Journal of Geophysical Research: Oceans 126(5):e2021JC017187. ] ??? Further, both statistical and dynamical forecasts of marine habitat are in development. --- ## How do we get there? 3. Collaborate and iterate together .pull-left-40[  ] .pull-right-60[    ] .footnote[ https://www.mafmc.org/climate-change-scenario-planning ] ??? A Climate Fisheries Initiative within NOAA aims to improve regional ocean modeling capabilities and develop interdisciplinary communities of practice--including managers--that will be essential to operational ecological forecasts. Finally, the iterative, collaborative IEA process itself provides opportunities to prioritize which ecological forecasts to develop. --- class: inverse, bottom background-image: url("EDAB_images/IMG_2809.jpg") background-size: cover .pull-left[Slides: https://noaa-edab.github.io/presentations/] .pull-right[Contact: <sarah.gaichas@noaa.gov>]