class: right, middle, my-title, title-slide # State of the Ecosystem <br /> Product Development Workflow ## Openscapes<br /> 15 October 2021 ### Kim Bastille <br /> <a href="mailto:kimberly.bastille@noaa.gov" class="email">kimberly.bastille@noaa.gov</a> <br /> Github: <span class="citation">@kimberly-bastille</span> <br /> Twitter: <span class="citation">@swimbastille</span> --- class: top, left # Presentation Overview .pull-left[ ### State of the Ecosystem Overview ### Workflow Structure ### Cool technique for propagating plots throughout workflow ] .pull-right[ 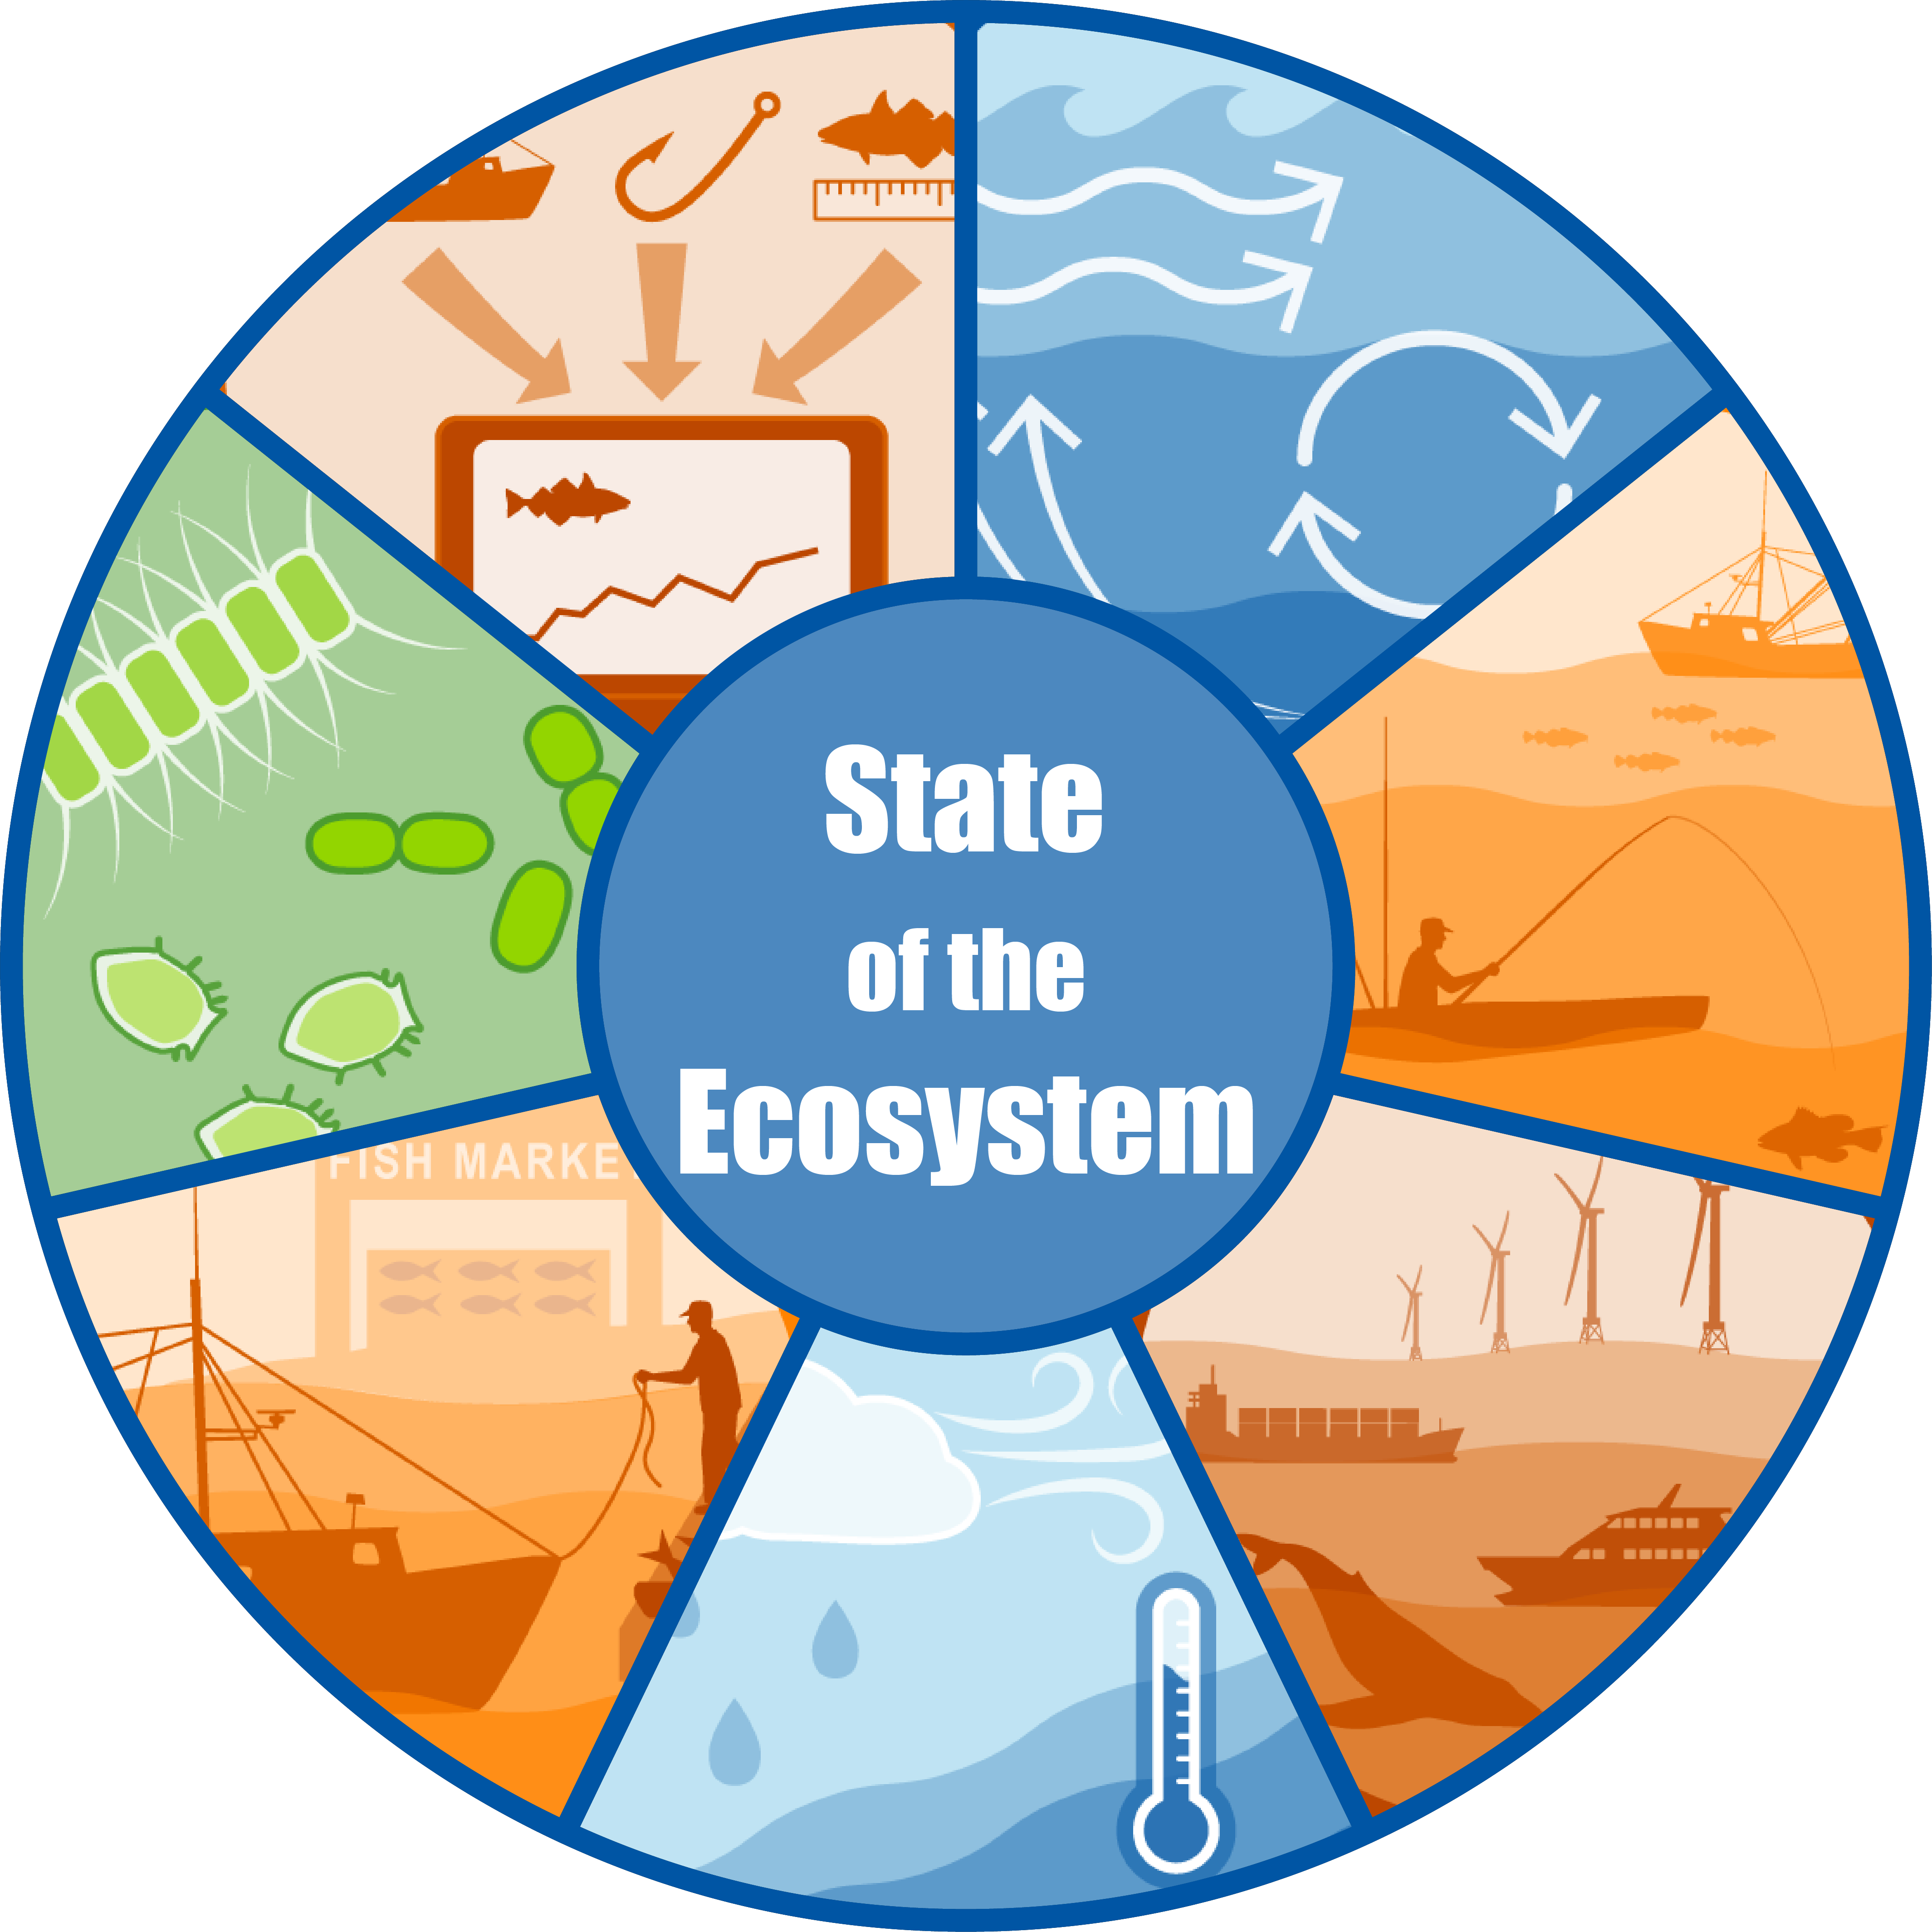 ] --- # SOE Overview ## State of the Ecosystem Reports .pull-left[ * 2 Annual reports that give ecosystem context to fisheries managers. * 2 councils, 3 Ecological Production Units * ~50 Indicator datasets, Over 60 data contributors * Evolving since 2016 * Supporting products * [Technical Documentation](https://github.com/NOAA-EDAB/tech-doc) * [Response Memo](https://github.com/NOAA-EDAB/memos/tree/master/SOE-response-memo) * [Presentations](https://github.com/NOAA-EDAB/presentations), etc. .contrib[ [State of the Ecosystem 2021, Mid-Atlantic](https://apps-nefsc.fisheries.noaa.gov/rcb/publications/SOE-MAFMC-2021-508-Final.pdf) [State of the Ecosystem 2021, New England](https://apps-nefsc.fisheries.noaa.gov/rcb/publications/SOE-NAFMC-2021-508-Final.pdf) ] ] .pull-right[ 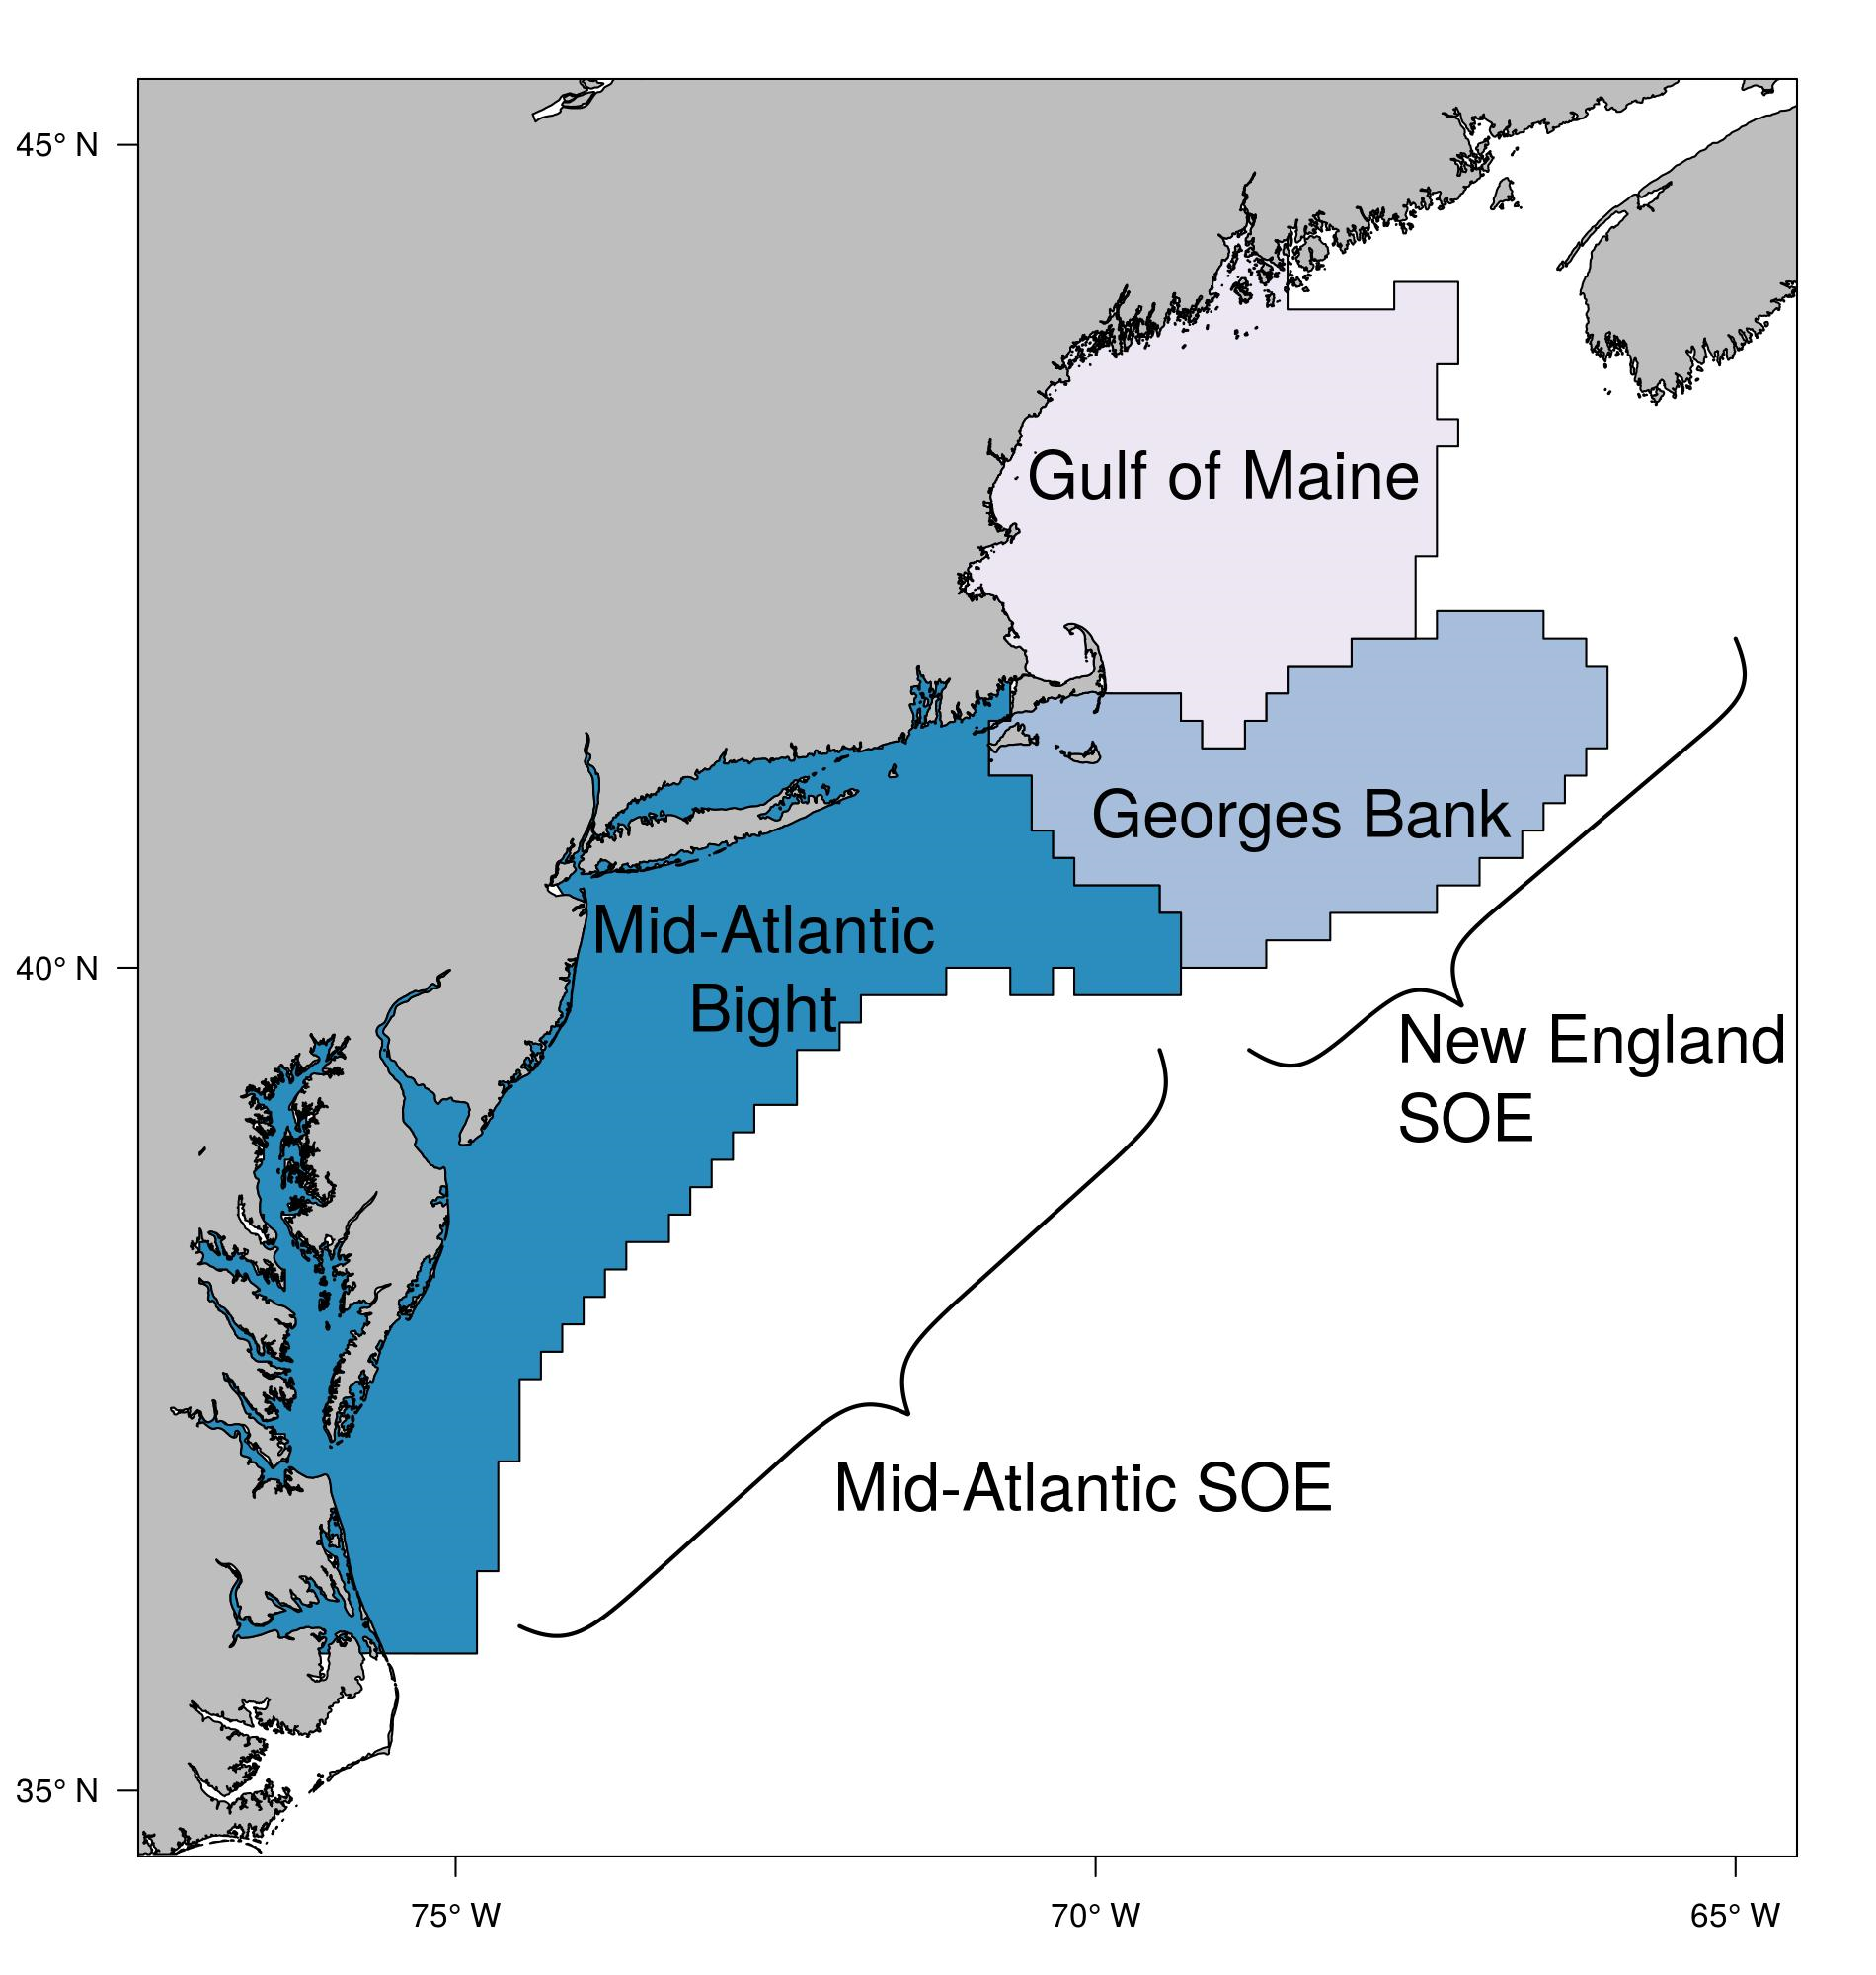 ] --- # SOE Workflow Structure ## State of the Ecosystem workflow tree 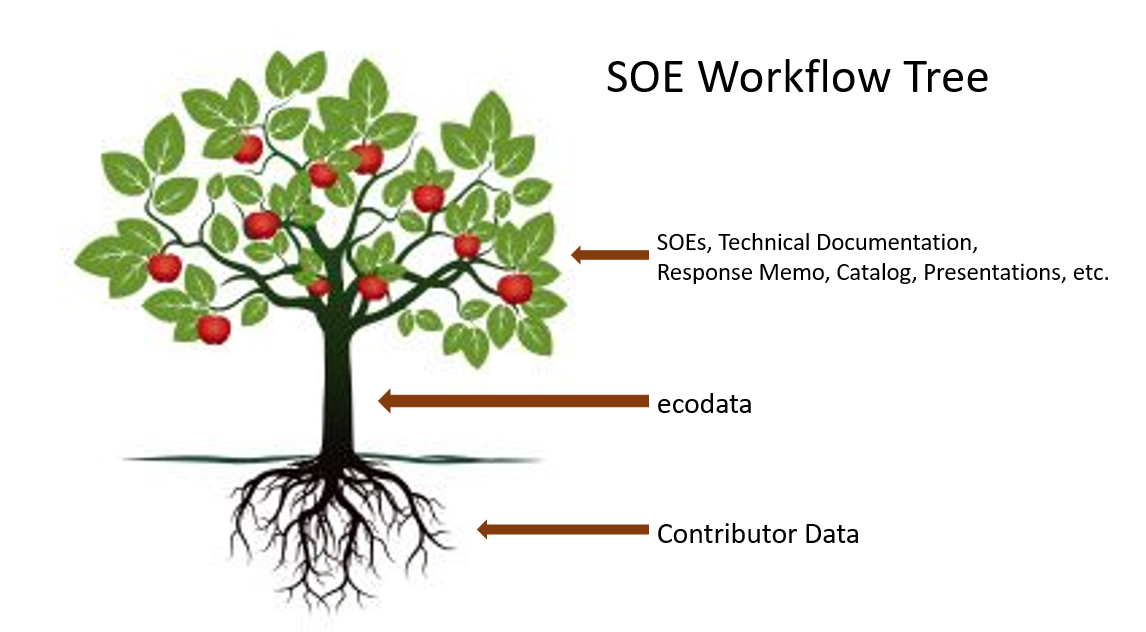 --- # ecodata - R package .pull-left[ 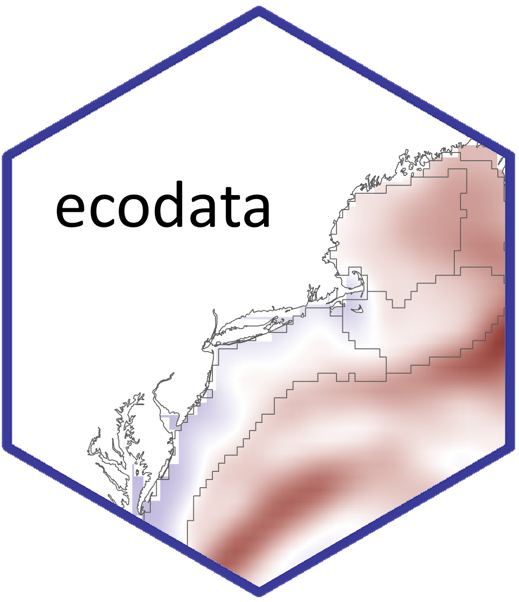 .contrib[ https://github.com/NOAA-EDAB/ecodata ] ] .pull-right[ ## ecodata package purpose * Data Processing * Data Sharing * Data Visualization ### Data Processing * Rscipts that format contributor data ### Data Sharing * Data saved in `data` folder * Can be lazyloaded with package * mtcars ] --- ## Data Visualization and Propagation 1) Plots built in Visualization.Rmd <img src="20211015_Openscapes_Bastille_files/figure-html/unnamed-chunk-1-1.png" width="864" /> .contrib[ https://noaa-edab.github.io/ecodata/macrofauna_MAB#Forage_Anomaly ] --- ## Data Visualization and Propagation 2) Rmd Code Chunks converted to Individual R scripts 3) Rscripts stored on github  .contrib[ * https://github.com/NOAA-EDAB/ecodata/blob/master/data-raw/code_chunks_to_scripts.R * https://github.com/NOAA-EDAB/ecodata/tree/master/chunk-scripts ] --- ## Data Visualization and Propagation 4) use `code = readLines` in Rmd 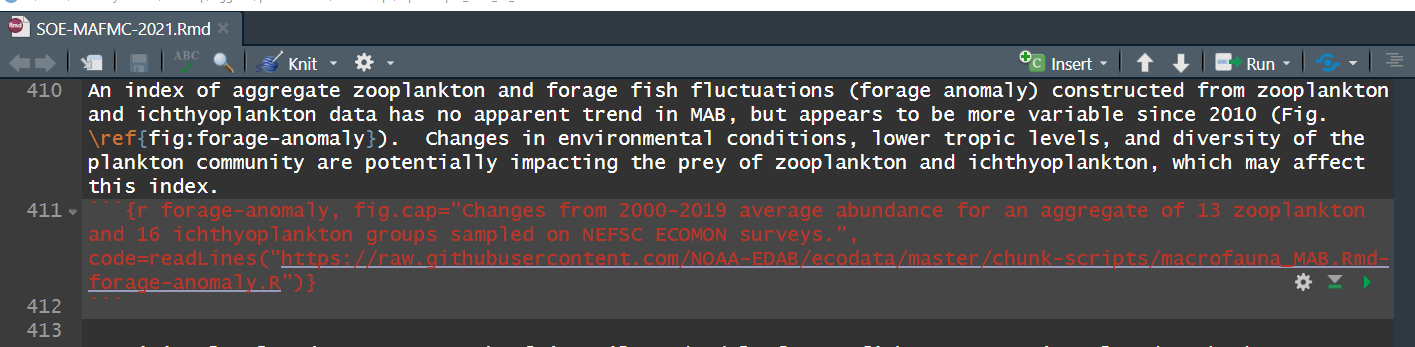 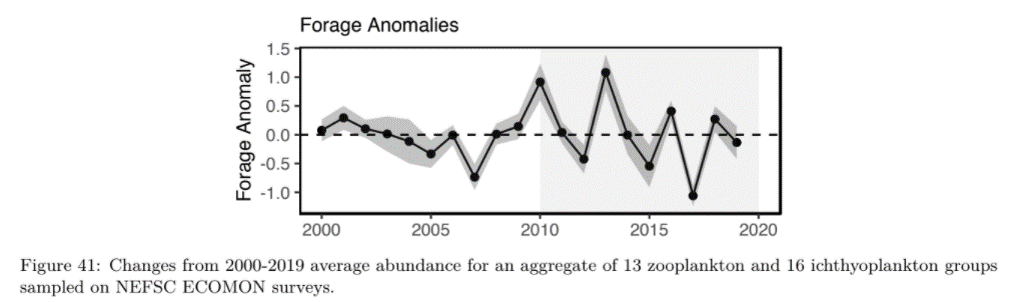 --- # Benefits .pull-left[  ] .pull-right[ ## Cool Visualization technique * No copy/paste errors * All associated products get most up-to-date figure * Clearly defined tasks for individuals * Easier to maintain 100+ plots * Easy to set up and update ## Workflow as a whole * Keeps code and data all in one place * Processed data available to public * Can be maintained by anyone ] --- # Questions?? .center[  ]