class: right, middle, my-title, title-slide # How is our ocean doing? ## Data, statistics, and modeling<br /> for management advice ### Sarah Gaichas<br /> Northeast Fisheries Science Center --- class: top, left .pull-left[ # Outline * My background * What is NOAA? * What we do * Challenges with what we do * Addressing challenges * What do I do? 1. Integrated ecosystem assessment 1. Modeling management strategies ] .pull-right[ .center[  https://xkcd.com/242/ ] ] --- background-image: url("EDAB_images/EnglishLitArt.png") background-size: 85% ## My (circuitous) path to NOAA -- .pull-left[ 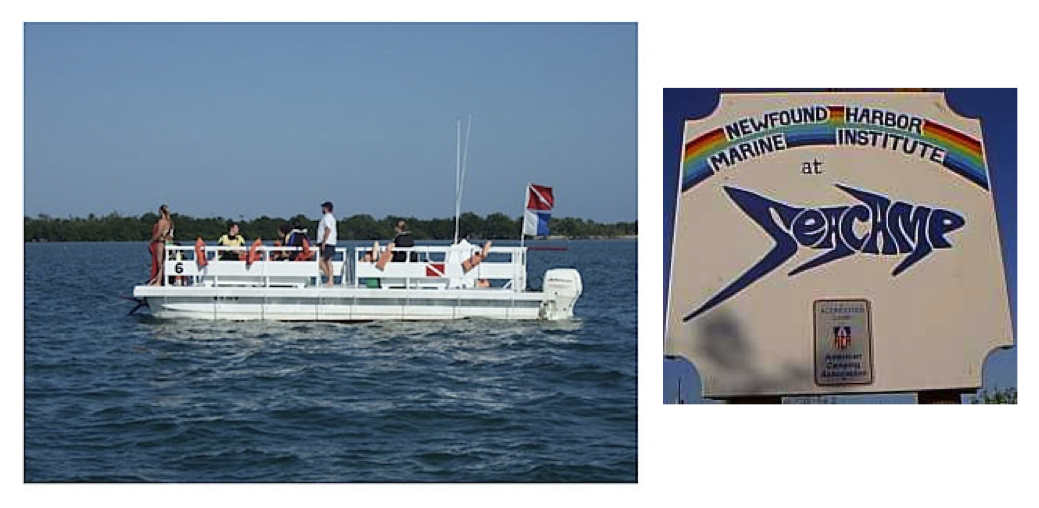 .center[ 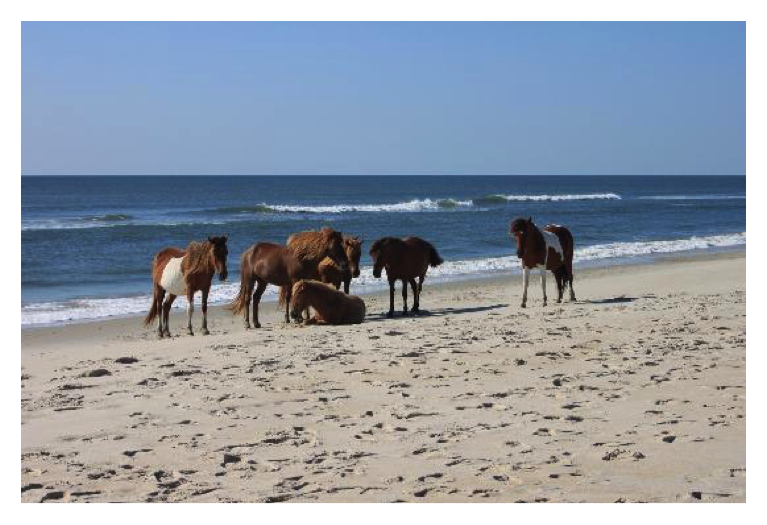 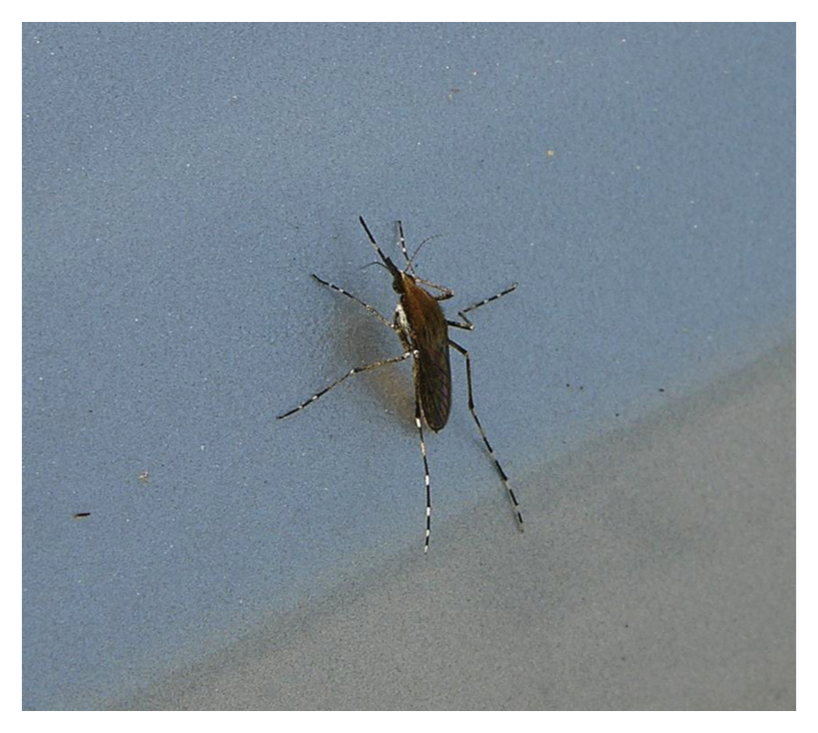 ] ] -- .pull-right[   ] --- background-image: url("EDAB_images/NOAAtable.png") background-size: 95% 95% ## What is NOAA? -- .center[  ] --- .pull-left[ ## Working at NOAA Fisheries  ] .pull-right[ Alaska: * Observer program analyst * Stock assessment + PhD at UW * Ecosystem modeling  Northeast: * Integrated ecosystem assessment, management strategy evaluation  ] --- ## Fisheries: what do we need to know? **How many fish can be caught sustainably?** .pull-left[ * How many are caught right now? * How many were caught historically? * How many are there right now? * How many were there historically? * How productive are they (growth, reproduction)? ] .pull-right[  ] .bluetext[ * <span style="color:blue">What supports their productivity?</span> * <span style="color:blue">What does their productivity support, besides fishing?</span> * <span style="color:blue">How do they interact with other fish, fisheries, marine animals?</span> * <span style="color:blue">How do environmental changes affect them?</span> * <span style="color:blue">What is their ecological, economic, and social value to people?</span> ] --- ## Challenges, how we address them .pull-left[ * We don’t live in the ocean; can’t see or directly count what we manage * We know only basic biological properties of species; data are expensive * Catch coming to land is not the only fishing effect .bluetext[ * <span style="color:blue">We manage species separately but they interact</span> ] .bluetext[ * <span style="color:blue">Different laws govern different species, activities</span> ] .bluetext[ * <span style="color:blue">People depend on these estimates for livelihoods</span> ] ] -- .pull-right[ .greentext[ * <span style="color:green">Statistical design of surveys, sampling and estimation</span> * <span style="color:green">Observation models for data</span> * <span style="color:green">Sampling and estimation</span> * <span style="color:green">Model structure and parameterization</span> * <span style="color:green">Discarded catch estimation, habitat and other alterations</span> * <span style="color:green">Multispecies and integrated assessment</span> * <span style="color:green">Integrated assessment, management strategy evaluation</span> * <span style="color:green">Validation, quality control, transparency</span> ] ] --- ## What do I do? 1. Integrated ecosystem assessment .pull-left[ - Establish objectives - Develop indicators - Assess ecosystem - Risk assessment - Management strategy evaluation - Evaluate and iterate ] .pull-right[ *The IEA Loop<sup>1</sup>*  ] .footnote[ [1] https://www.integratedecosystemassessment.noaa.gov/national/IEA-approach ] ??? --- ## State of the Ecosystem Report .pull-left[ - Ecosystem indicators linked to management objectives - Open science emphasis - Used within Mid-Atlantic Fishery Management Council's Ecosystem Process ## 2021 Report 1. Graphical summary + Page 1 report card re: objectives → + Page 2 risk summary bullets + Page 3 synthesis themes 1. Performance relative to management objectives 1. Risks to meeting management objectives ] .pull-right[ <table class="table" style="font-size: 14px; margin-left: auto; margin-right: auto;"> <caption style="font-size: initial !important;">Ecosystem-scale fishery management objectives</caption> <thead> <tr> <th style="text-align:left;font-weight: bold;"> Objective Categories </th> <th style="text-align:left;font-weight: bold;"> Indicators reported here </th> </tr> </thead> <tbody> <tr grouplength="6"><td colspan="2" style="border-bottom: 1px solid;"><strong>Provisioning and Cultural Services</strong></td></tr> <tr> <td style="text-align:left;padding-left: 2em;" indentlevel="1"> Seafood Production </td> <td style="text-align:left;"> Landings; commercial total and by feeding guild; recreational harvest </td> </tr> <tr> <td style="text-align:left;padding-left: 2em;" indentlevel="1"> Profits </td> <td style="text-align:left;"> Revenue decomposed to price and volume </td> </tr> <tr> <td style="text-align:left;padding-left: 2em;" indentlevel="1"> Recreation </td> <td style="text-align:left;"> Days fished; recreational fleet diversity </td> </tr> <tr> <td style="text-align:left;padding-left: 2em;" indentlevel="1"> Stability </td> <td style="text-align:left;"> Diversity indices (fishery and ecosystem) </td> </tr> <tr> <td style="text-align:left;padding-left: 2em;" indentlevel="1"> Social & Cultural </td> <td style="text-align:left;"> Community engagement/reliance status </td> </tr> <tr> <td style="text-align:left;padding-left: 2em;" indentlevel="1"> Protected Species </td> <td style="text-align:left;"> Bycatch; population (adult and juvenile) numbers, mortalities </td> </tr> <tr grouplength="4"><td colspan="2" style="border-bottom: 1px solid;"><strong>Supporting and Regulating Services</strong></td></tr> <tr> <td style="text-align:left;padding-left: 2em;" indentlevel="1"> Biomass </td> <td style="text-align:left;"> Biomass or abundance by feeding guild from surveys </td> </tr> <tr> <td style="text-align:left;padding-left: 2em;" indentlevel="1"> Productivity </td> <td style="text-align:left;"> Condition and recruitment of managed species, Primary productivity </td> </tr> <tr> <td style="text-align:left;padding-left: 2em;" indentlevel="1"> Trophic structure </td> <td style="text-align:left;"> Relative biomass of feeding guilds, Zooplankton </td> </tr> <tr> <td style="text-align:left;padding-left: 2em;" indentlevel="1"> Habitat </td> <td style="text-align:left;"> Estuarine and offshore habitat conditions </td> </tr> </tbody> </table> ] --- ## State of the Ecosystem summary .pull-left[ .center[ 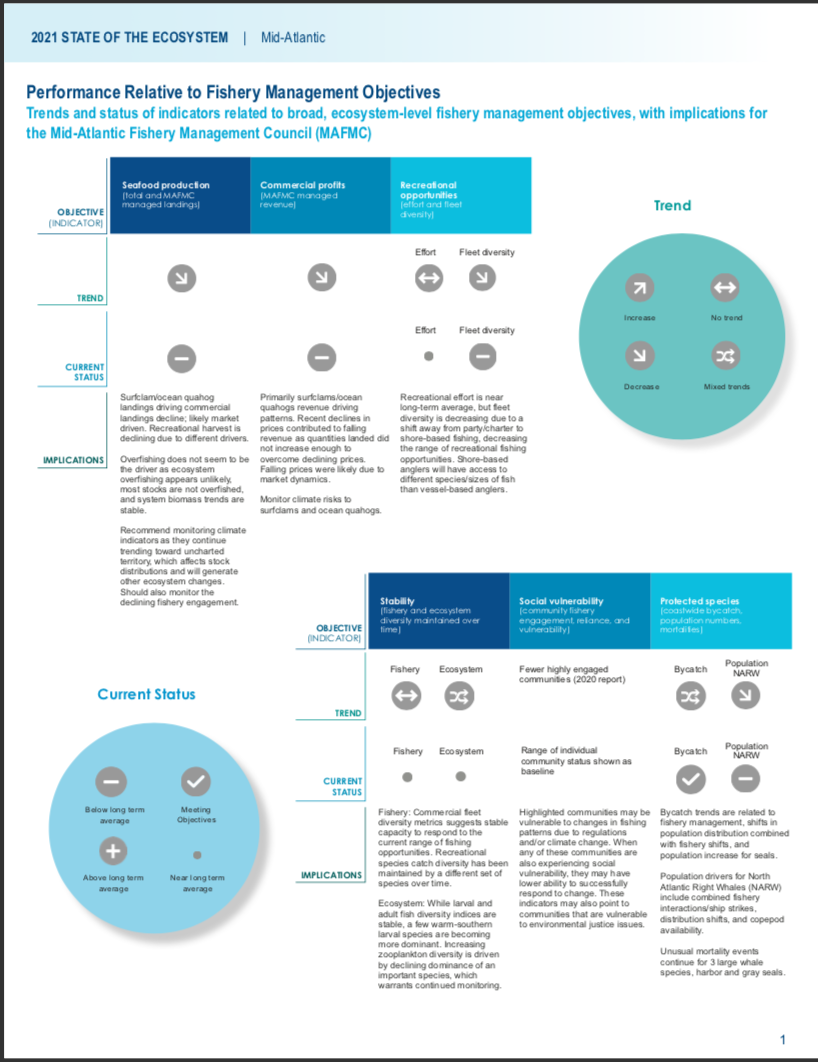 ] ] .pull-right[ .center[ 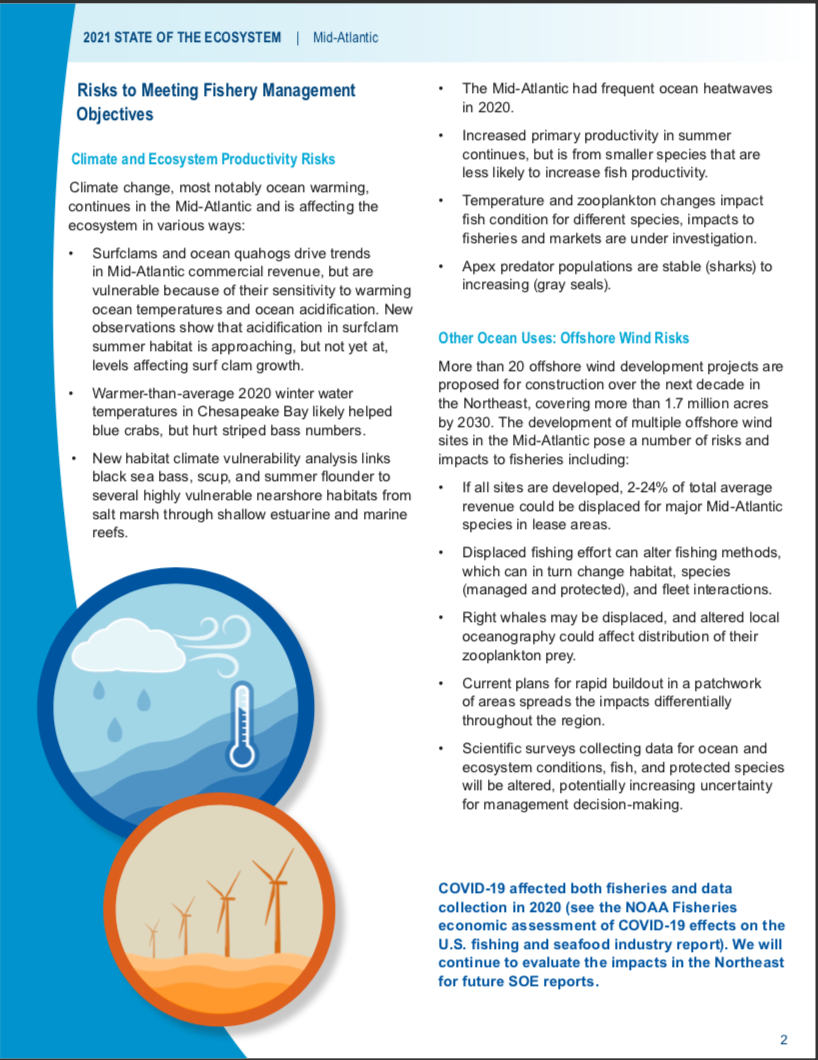 ] ] --- ## Ecosystem synthesis themes Characterizing ecosystem change for fishery management * Societal, biological, physical and chemical factors comprise the **multiple system drivers** that influence marine ecosystems through a variety of different pathways. * Changes in the multiple drivers can lead to **regime shifts** — large, abrupt and persistent changes in the structure and function of an ecosystem. * Regime shifts and changes in how the multiple system drivers interact can result in **ecosystem reorganization** as species and humans respond and adapt to the new environment. .pull-left[ 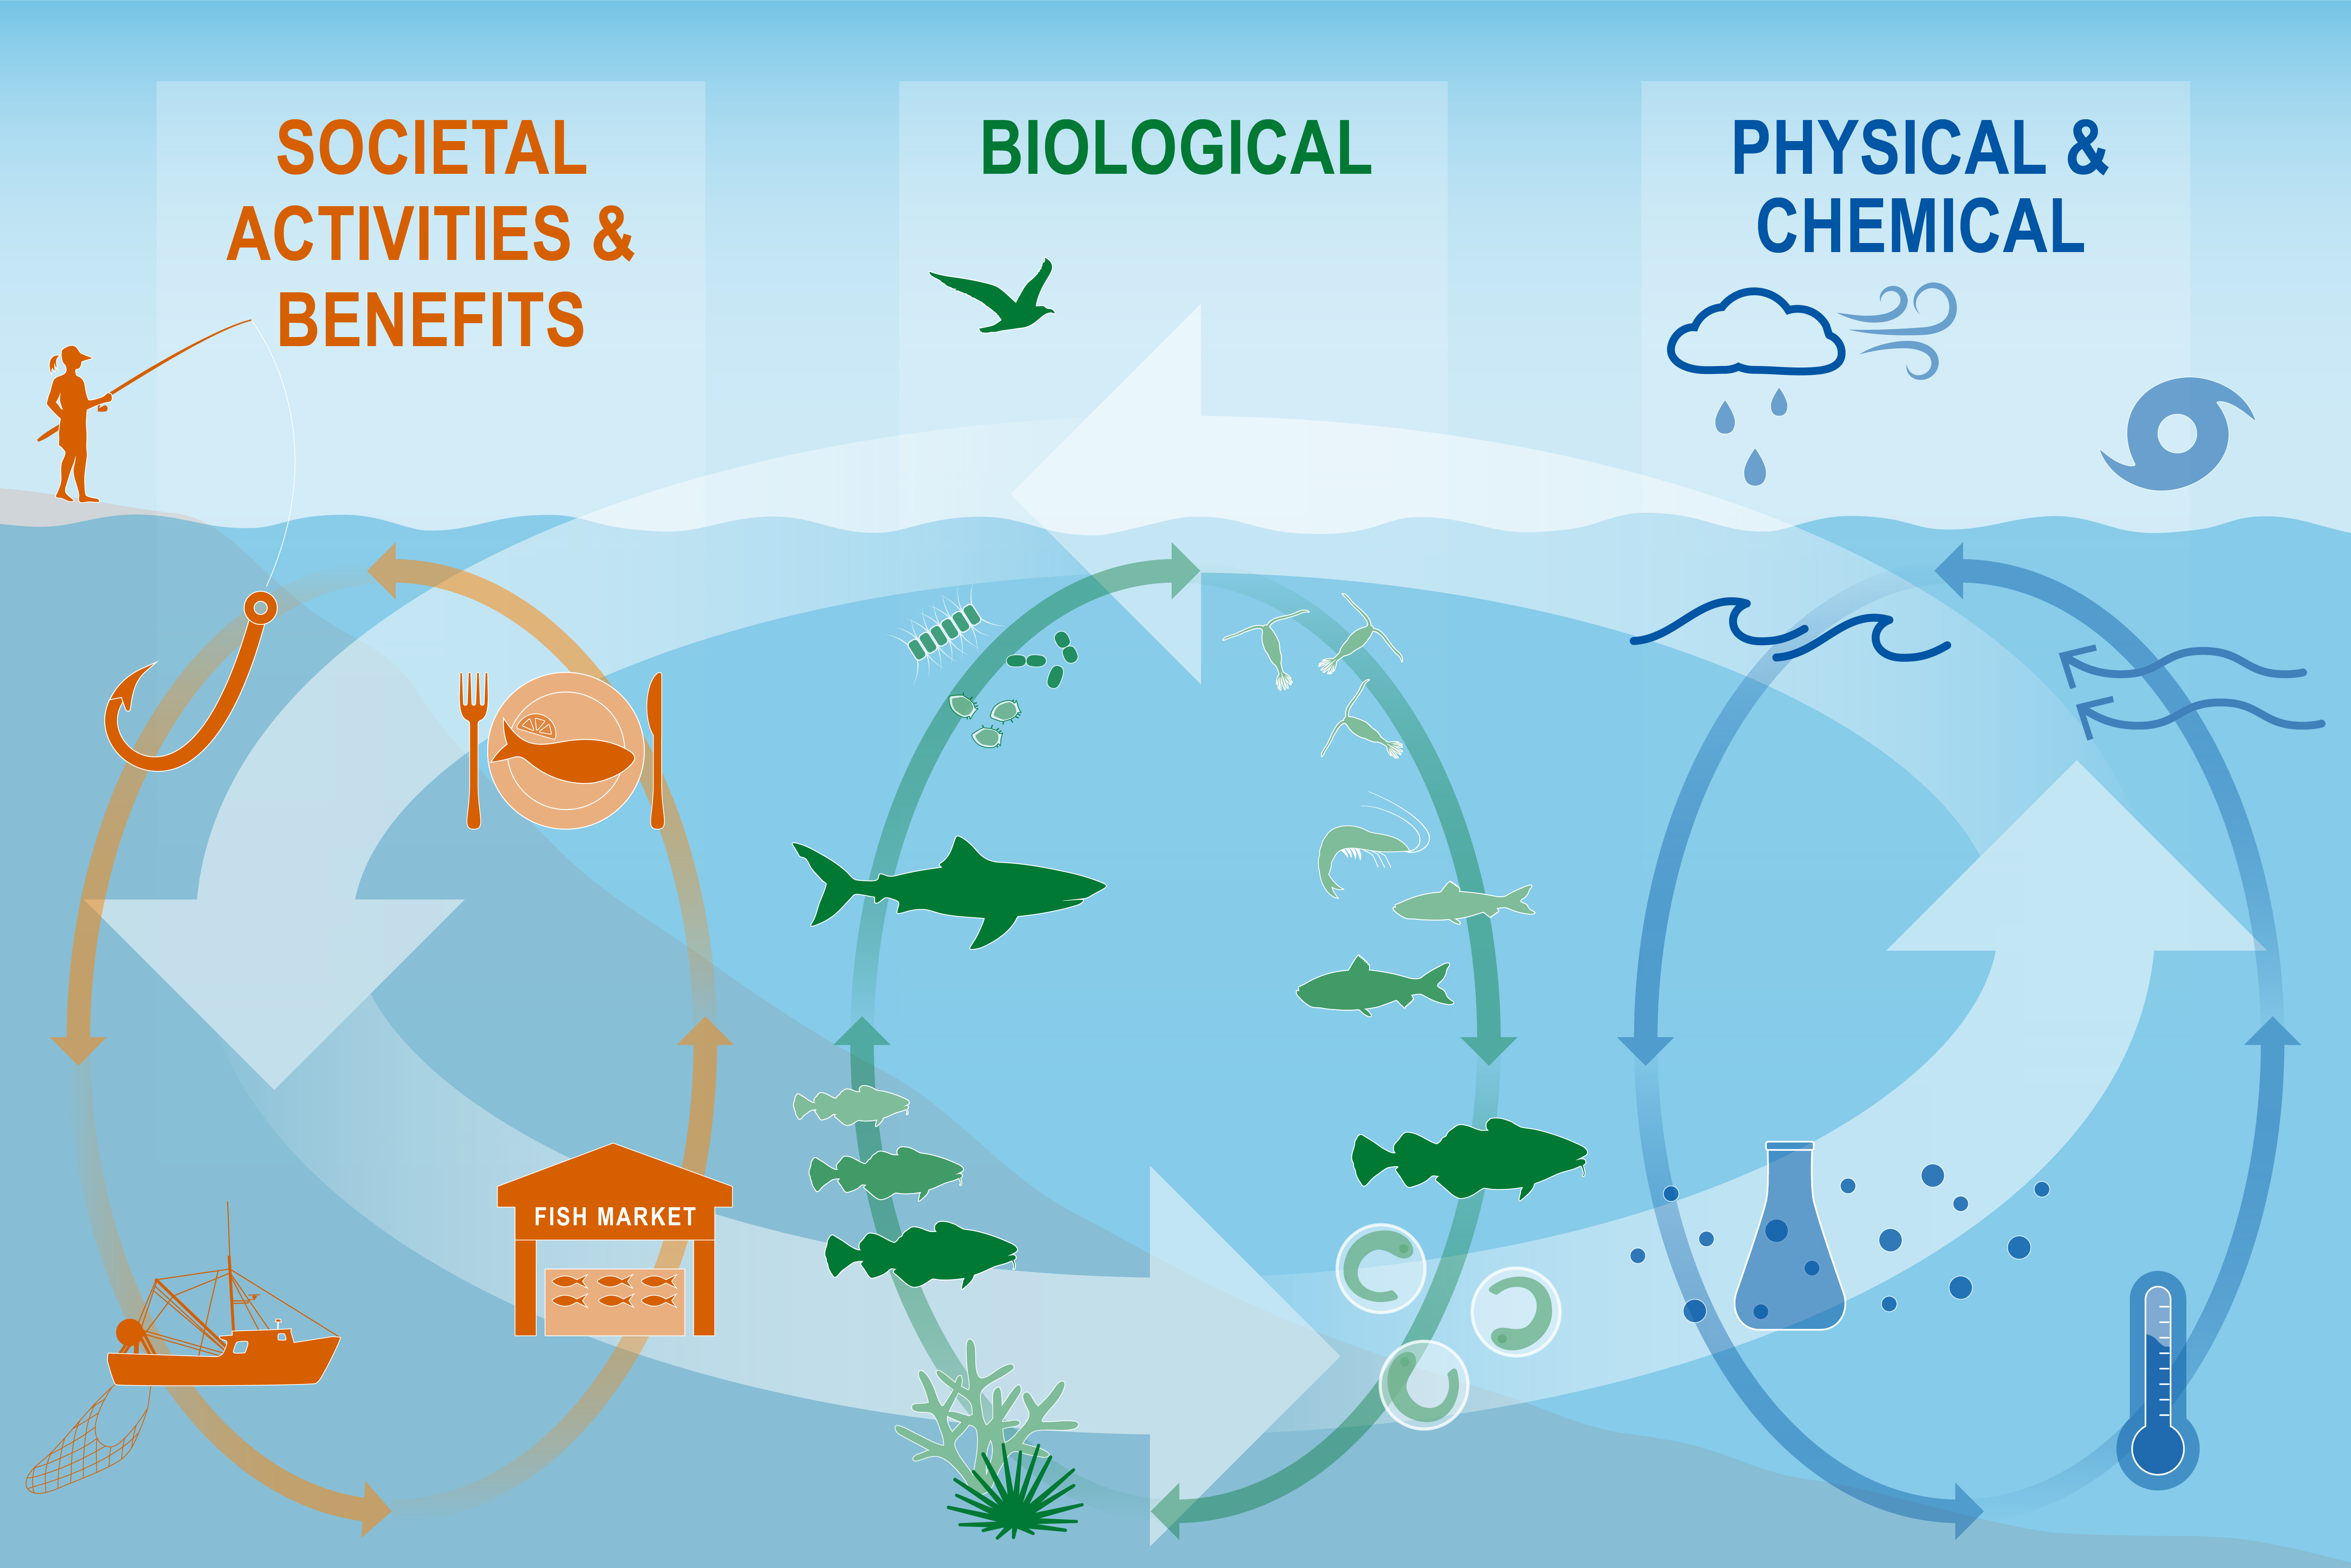 ] .pull-right[ 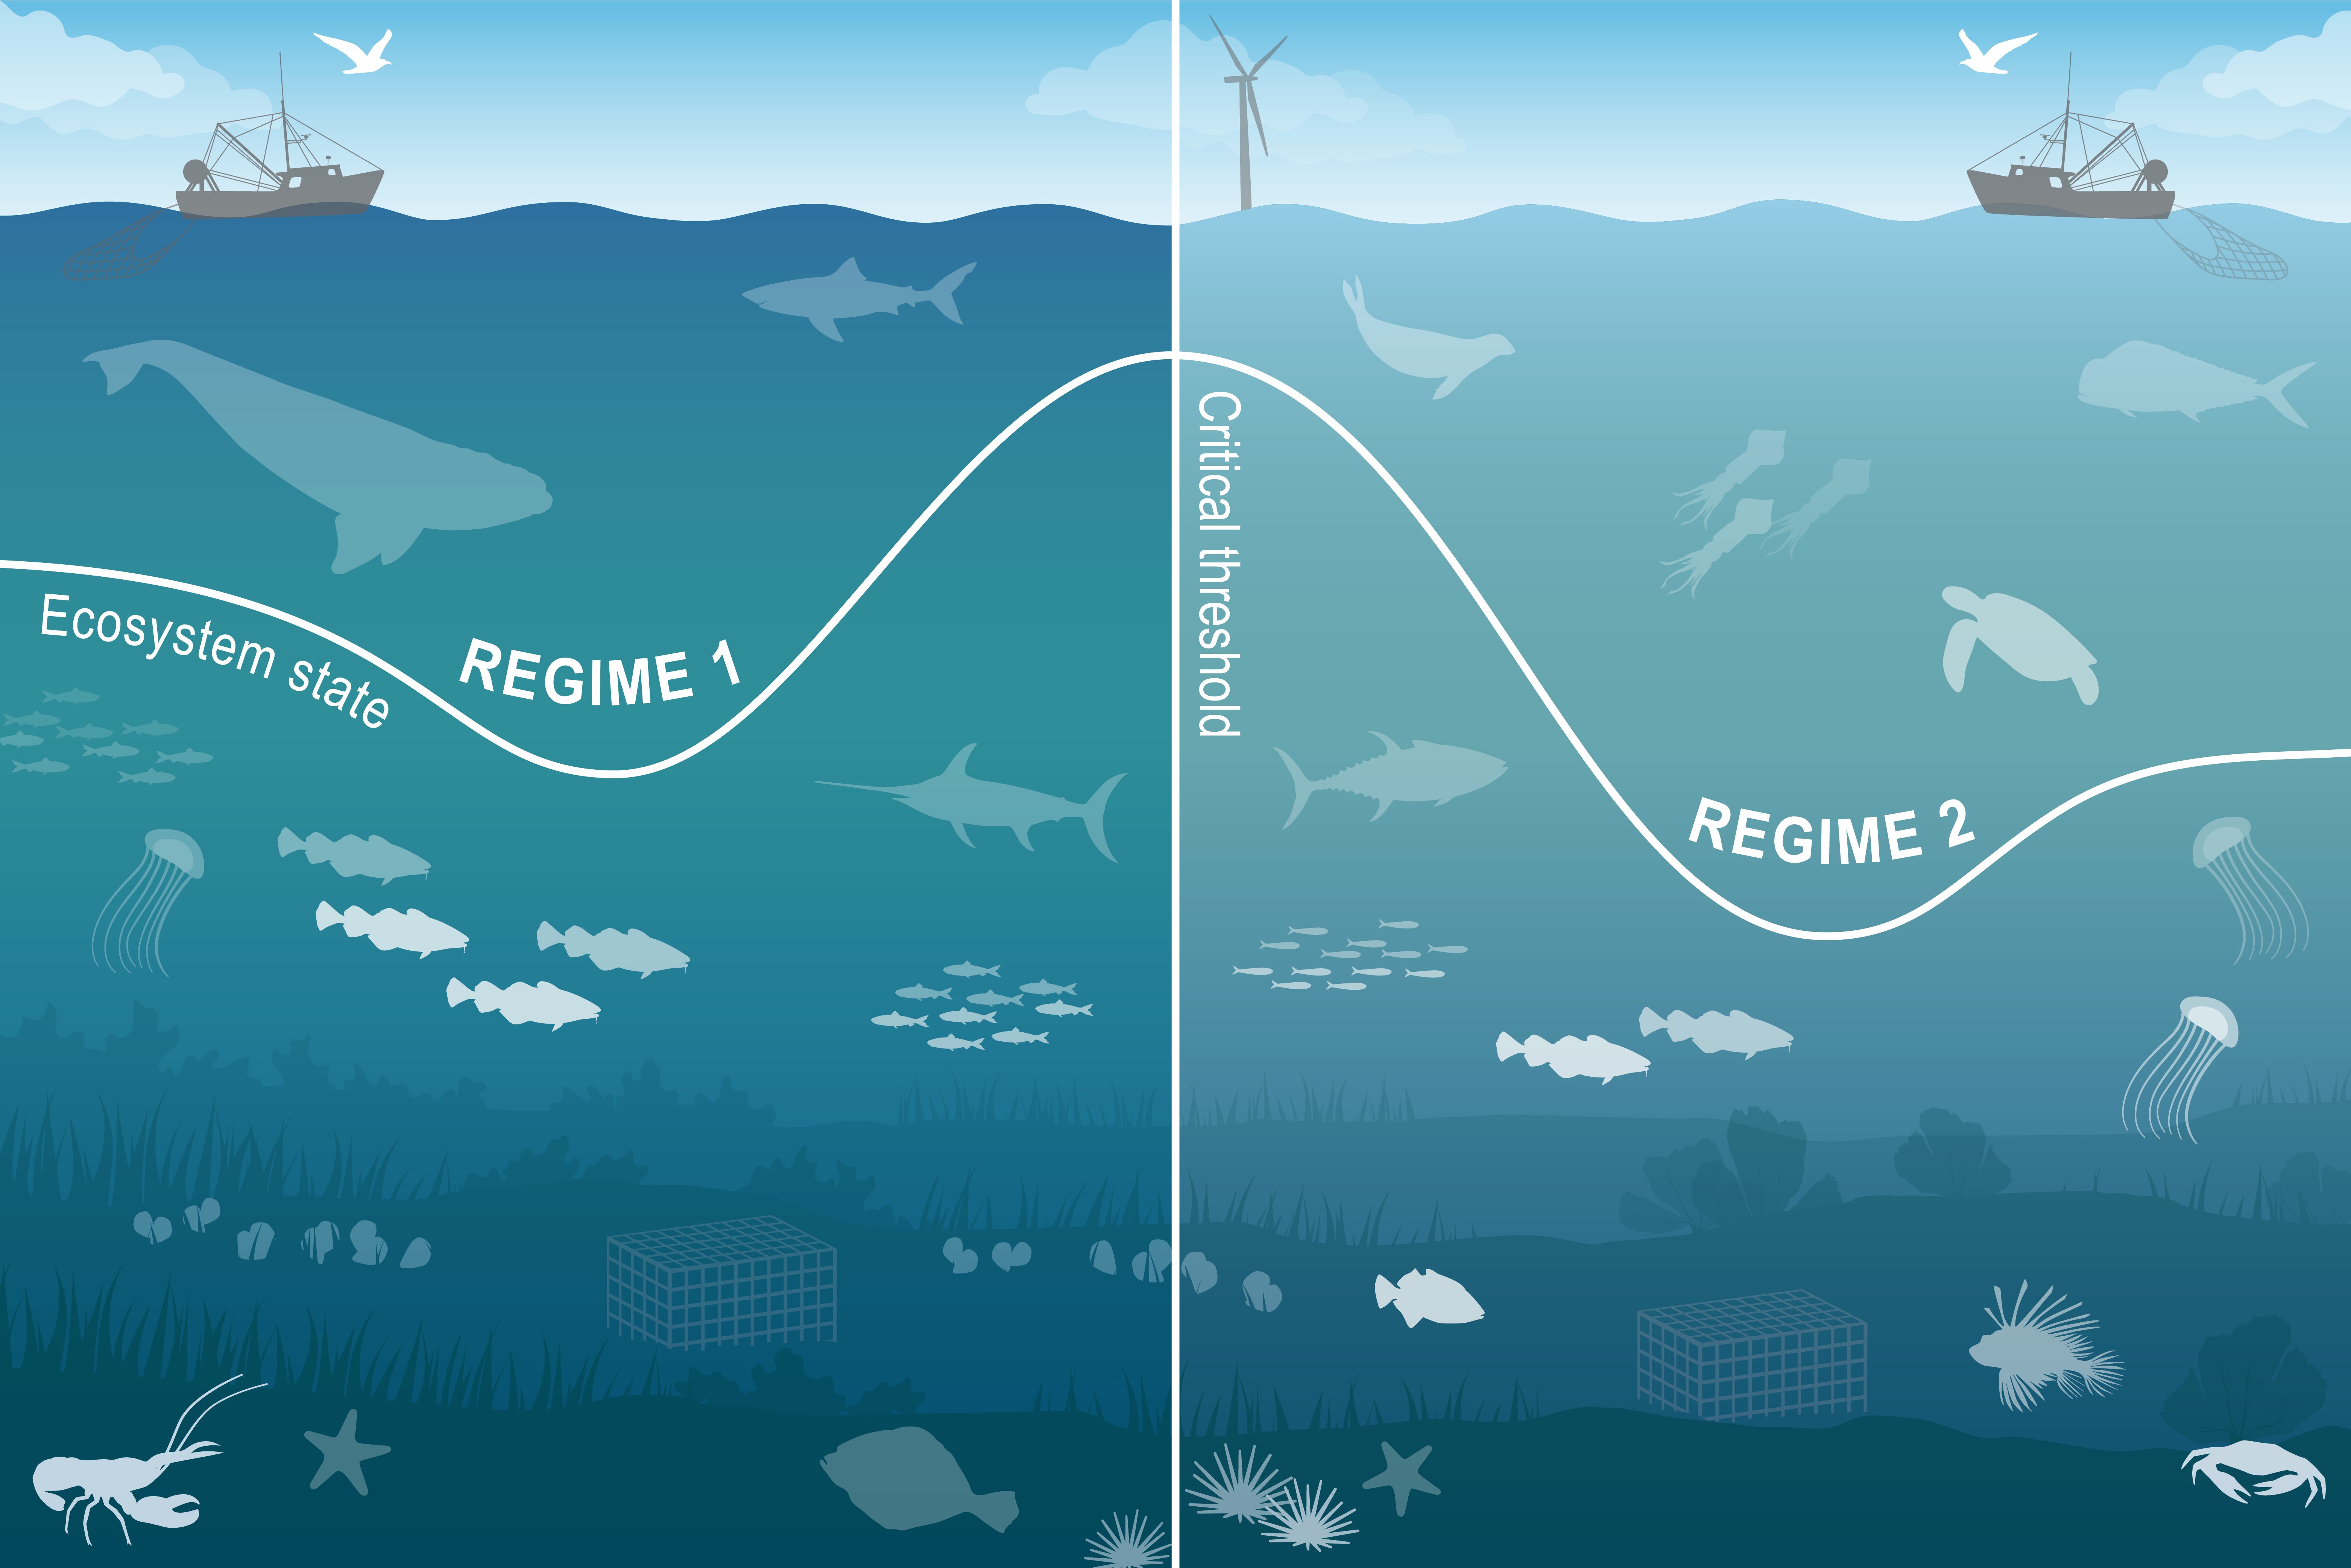 ] --- # Performance relative to management objectives .center[      ] --- ## Objective: Seafood production   .pull-left[ Indicators: Commercial and recreational landings <img src="20210329_Stockton_ecotalk_Gaichas_files/figure-html/unnamed-chunk-5-1.png" width="504" style="display: block; margin: auto;" /> .contrib[ Key: Black = Landings of all species combined; <p style="color:#FF6A6A;">Red = Landings of MAFMC managed species</p> ] <img src="20210329_Stockton_ecotalk_Gaichas_files/figure-html/unnamed-chunk-6-1.png" width="504" style="display: block; margin: auto;" /> ] .pull-right[ Multiple drivers: ecosystem and stock production, management, market conditions, and environment Is biomass driving? <img src="20210329_Stockton_ecotalk_Gaichas_files/figure-html/unnamed-chunk-7-1.png" width="576" style="display: block; margin: auto;" /> .contrib[ Key: Black = NEFSC survey; <p style="color:#FF6A6A;">Red = NEAMAP survey</p> ] ] --- ## Landings drivers: Ecosystem and stock production? .pull-left[ <img src="20210329_Stockton_ecotalk_Gaichas_files/figure-html/unnamed-chunk-8-1.png" width="504" style="display: block; margin: auto;" /> <img src="20210329_Stockton_ecotalk_Gaichas_files/figure-html/unnamed-chunk-9-1.png" width="504" style="display: block; margin: auto;" /> .contrib[ Key: <p style="background-color:#f4a460;">Orange background = Tipping point overfishing threshold, Link and Watson 2019</p> <p style="background-color:#a2cd5a;">Green background = Optimal range, Link and Watson 2019</p> ] ] .pull-right[ <img src="20210329_Stockton_ecotalk_Gaichas_files/figure-html/unnamed-chunk-10-1.png" width="504" style="display: block; margin: auto;" /> <img src="20210329_Stockton_ecotalk_Gaichas_files/figure-html/unnamed-chunk-11-1.png" width="540" style="display: block; margin: auto;" /> ] --- ## Implications: Seafood Production .pull-left[ <img src="20210329_Stockton_ecotalk_Gaichas_files/figure-html/unnamed-chunk-14-1.png" width="360" style="display: block; margin: auto;" /> .contrib[ Key: Black = Landings of all species combined; <p style="color:#FF6A6A;">Red = Landings of MAFMC managed species</p> ] ] .pull-right[ Drivers: * market dynamics affecting commercial landings of surfclams and ocean quahogs * other drivers affecting recreational landings: shark fishery management, possibly survey methodology <img src="20210329_Stockton_ecotalk_Gaichas_files/figure-html/unnamed-chunk-15-1.png" width="360" style="display: block; margin: auto;" /> Monitor: * climate risks including warming, ocean acidification, and shifting distributions * ecosystem composition and production changes * fishing engagement ] ??? Because ecosystem overfishing seems unlikely, stock status is mostly acceptable, and aggregate biomass trends appear stable, the decline in commercial landings is most likely driven by market dynamics affecting the landings of surfclams and ocean quahogs, as quotas are not binding for these species. Climate change also seems to be shifting the distribution of surfclams and ocean quahogs, resulting in areas with overlapping distributions and increased mixed landings. Given the regulations governing mixed landings, this could become problematic in the future and is currently being evaluated by the Council. --- # Risks to meeting fishery management objectives .center[   ] .center[      ] --- background-image: url("EDAB_images/SST2020seasonalmaps.png") background-size: 700px background-position: right top ## Risks: Climate change .pull-left[ Indicators: ocean currents, bottom and surface temperature, marine heatwaves <img src="20210329_Stockton_ecotalk_Gaichas_files/figure-html/unnamed-chunk-16-1.png" width="288" style="display: block; margin: auto;" /> <img src="20210329_Stockton_ecotalk_Gaichas_files/figure-html/unnamed-chunk-17-1.png" width="288" style="display: block; margin: auto;" /> <img src="20210329_Stockton_ecotalk_Gaichas_files/figure-html/unnamed-chunk-18-1.png" width="504" style="display: block; margin: auto;" /> ] .pull-right[ <img src="20210329_Stockton_ecotalk_Gaichas_files/figure-html/unnamed-chunk-19-1.png" width="360" style="display: block; margin: auto;" /> ] ??? A marine heatwave is a warming event that lasts for five or more days with sea surface temperatures above the 90th percentile of the historical daily climatology (1982-2011). --- ## Risks: Climate change .pull-left[ Indicator: cold pool area  ] .pull-right[ Indicator: acidification  ] ??? Implications: * Surfclams vulnerable to increased temperature and acidification * Areas of low pH identified in surfclam and scallop habitat * Lab work in progress identified pH thresholds for surfclam growth: *approaching threshold* --- ## What do I do? 2. Modeling management strategies .pull-left[ - Changing climate and ocean conditions → Shifting species distributions, changing productivity - Needs: - Improve our ability to project global change impacts in the California Current and Nordic/Barents Seas (and elsewhere) - Test the performance of stock assessments to these impacts ] .pull-right[ *Climate-Ready Management<sup>1</sup>* 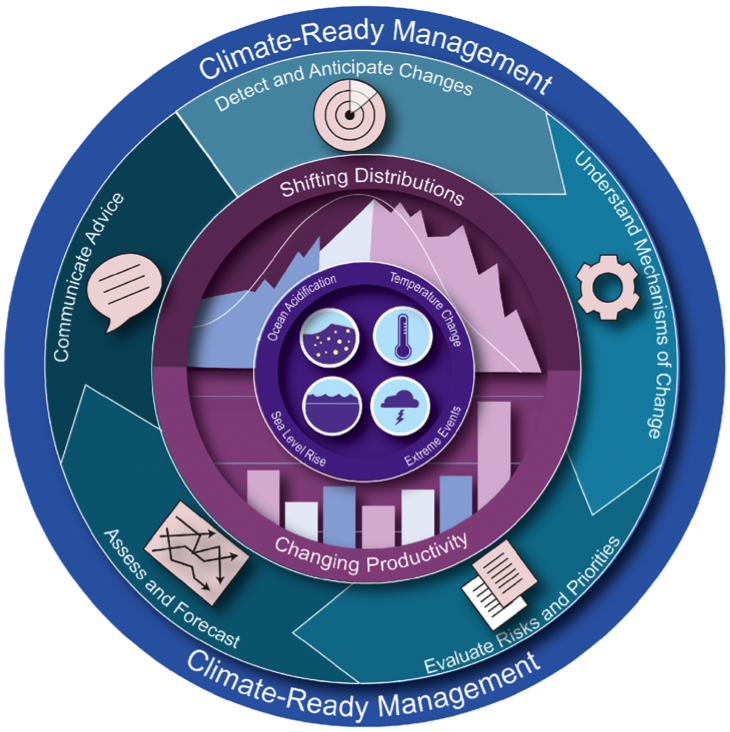 ] .footnote[ [1] Karp, Melissa A. et al. 2019. Accounting for shifting distributions and changing productivity in the development of scientific advice for fishery management. – ICES Journal of Marine Science, doi:10.1093/icesjms/fsz048. ] ??? --- ## Virtual worlds: end-to-end ecosystem models Atlantis modeling framework: [Fulton et al. 2011](https://onlinelibrary.wiley.com/doi/full/10.1111/j.1467-2979.2011.00412.x), [Fulton and Smith 2004](https://www.ajol.info/index.php/ajms/article/view/33182) .pull-left[ **Norwegian-Barents Sea** [Hansen et al. 2016](https://www.imr.no/filarkiv/2016/04/fh-2-2016_noba_atlantis_model_til_web.pdf/nn-no), [2018](https://journals.plos.org/plosone/article?id=10.1371/journal.pone.0210419) 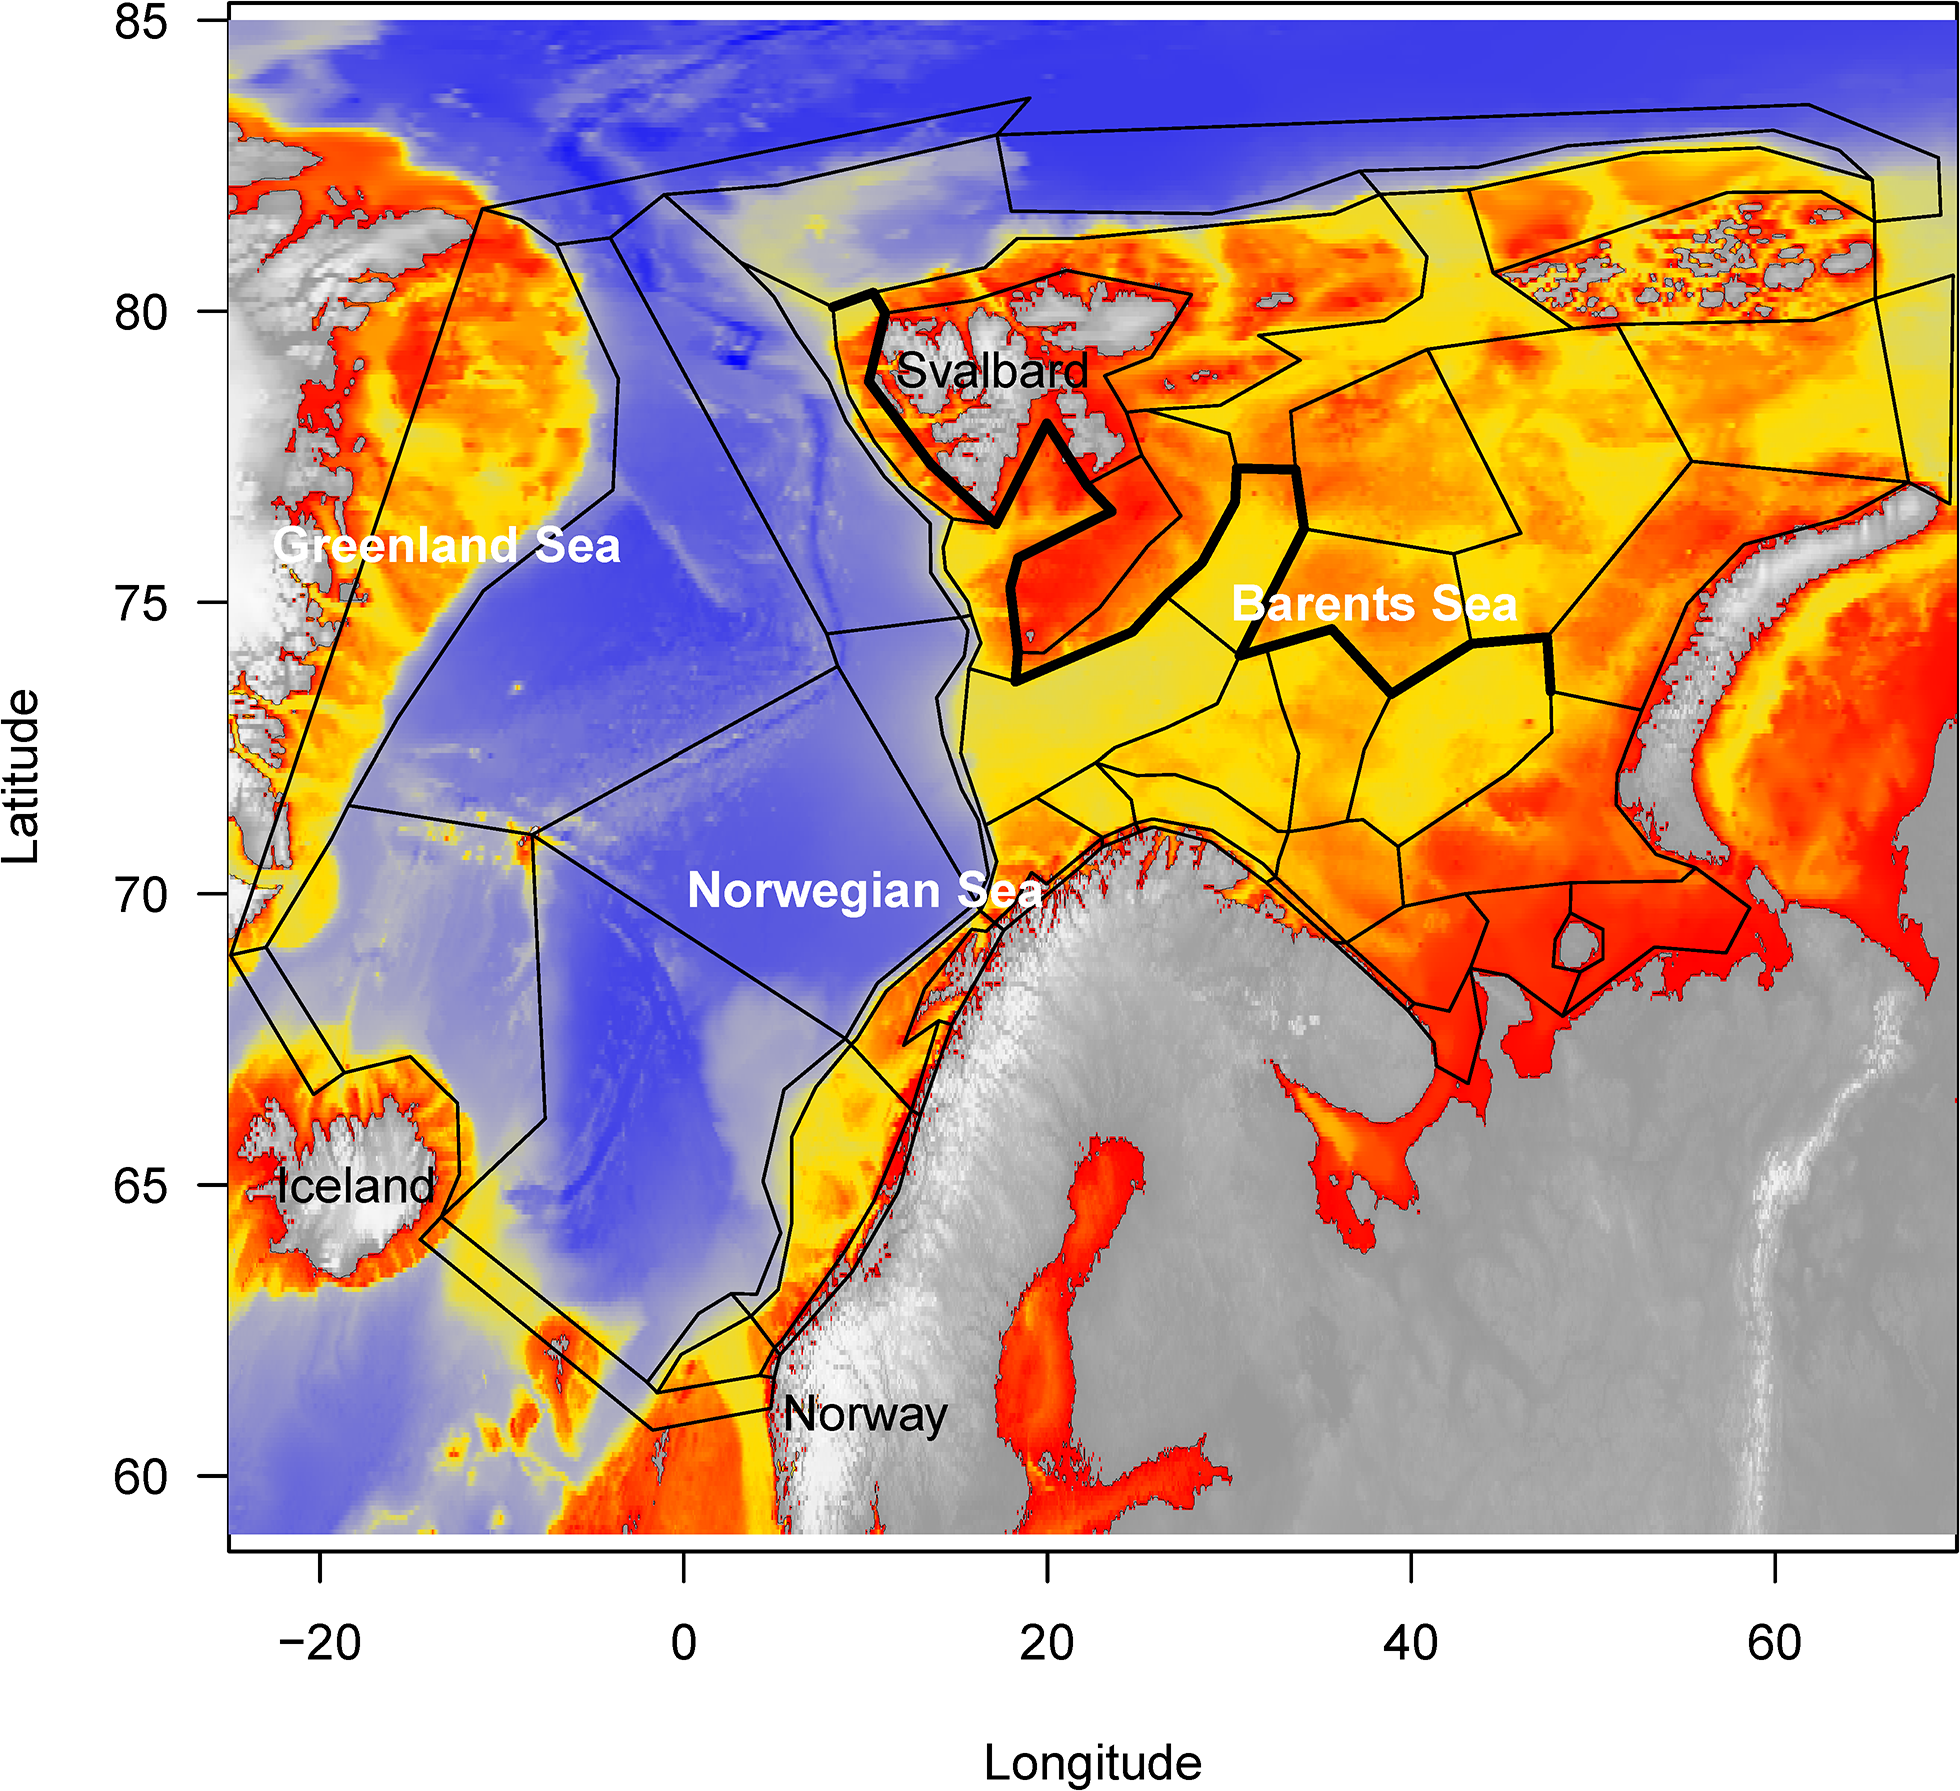 ] .pull-right[ **California Current** [Marshall et al. 2017](https://onlinelibrary.wiley.com/doi/full/10.1111/gcb.13594), [Kaplan et al. 2017](https://www.sciencedirect.com/science/article/pii/S0304380016308262?via%3Dihub) 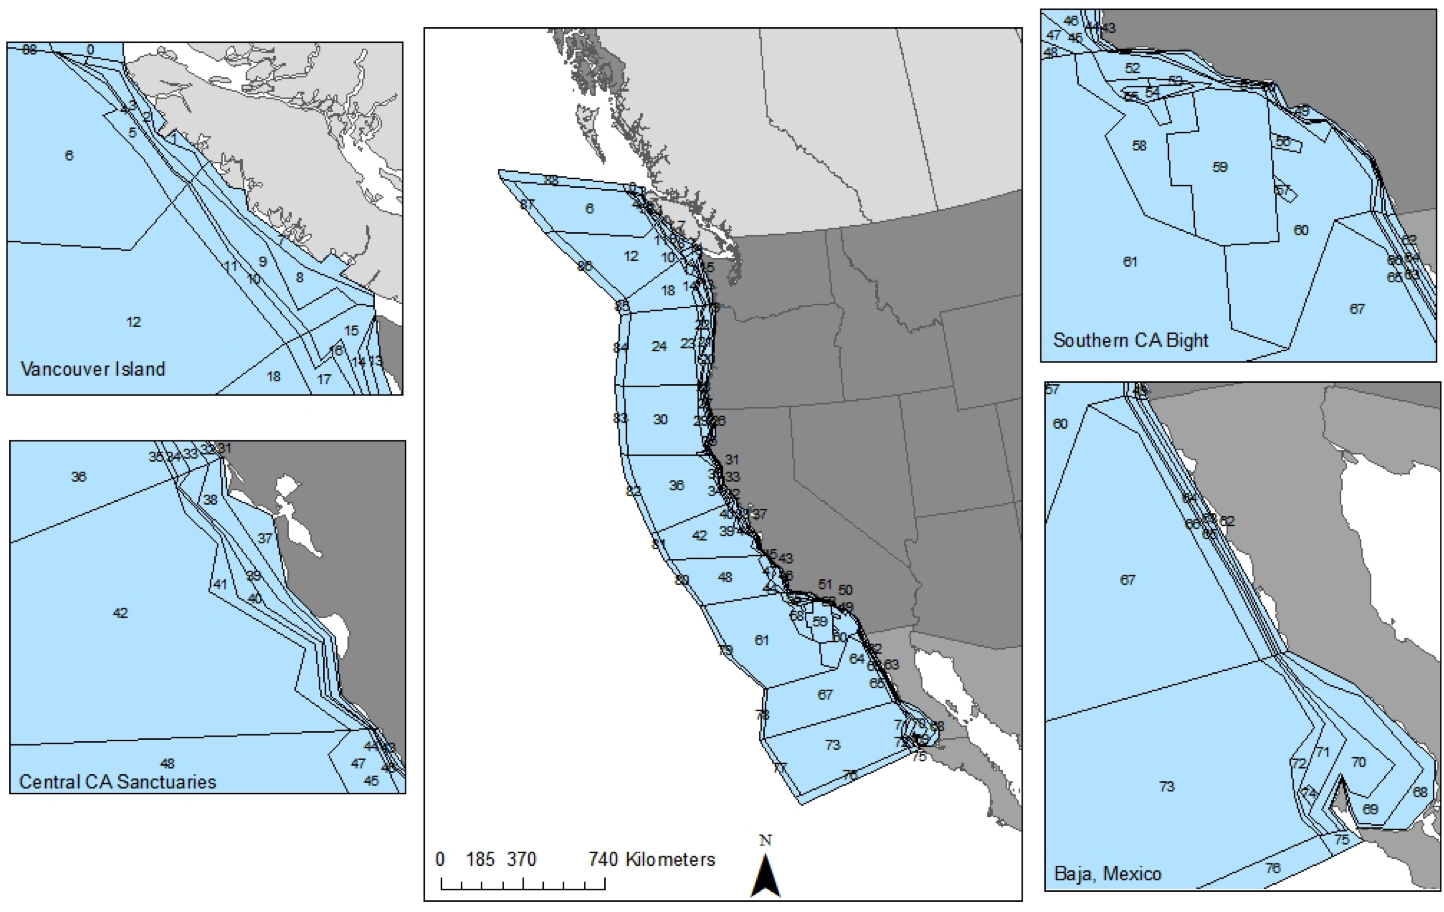 ] Building on global change projections: [Hodgson et al. 2018](https://www.sciencedirect.com/science/article/pii/S0304380018301856?via%3Dihub), [Olsen et al. 2018](https://www.frontiersin.org/articles/10.3389/fmars.2018.00064/full) ??? --- ## Design: Ecosystem model scenario (climate and fishing) <img src="EDAB_images/projectionOMsetup.png" width="85%" style="display: block; margin: auto;" /> ??? .pull-left[ * Recruitment variability in the operating model * Specify uncertainty in assessment inputs using `atlantisom` ] .pull-right[ 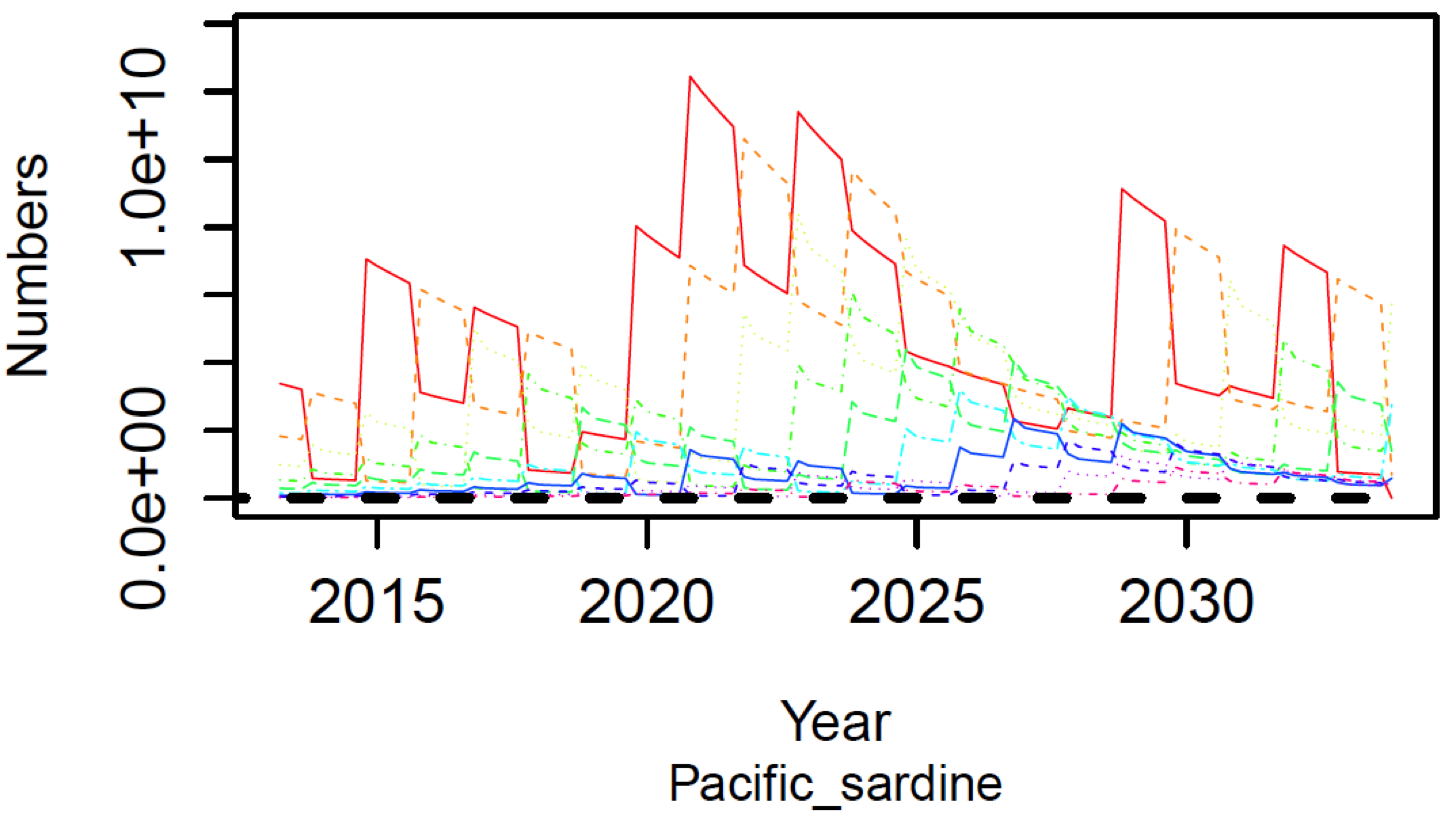 ] --- ## Testing a simple "sardine" assessment (in progress) .pull-left[ Biomass 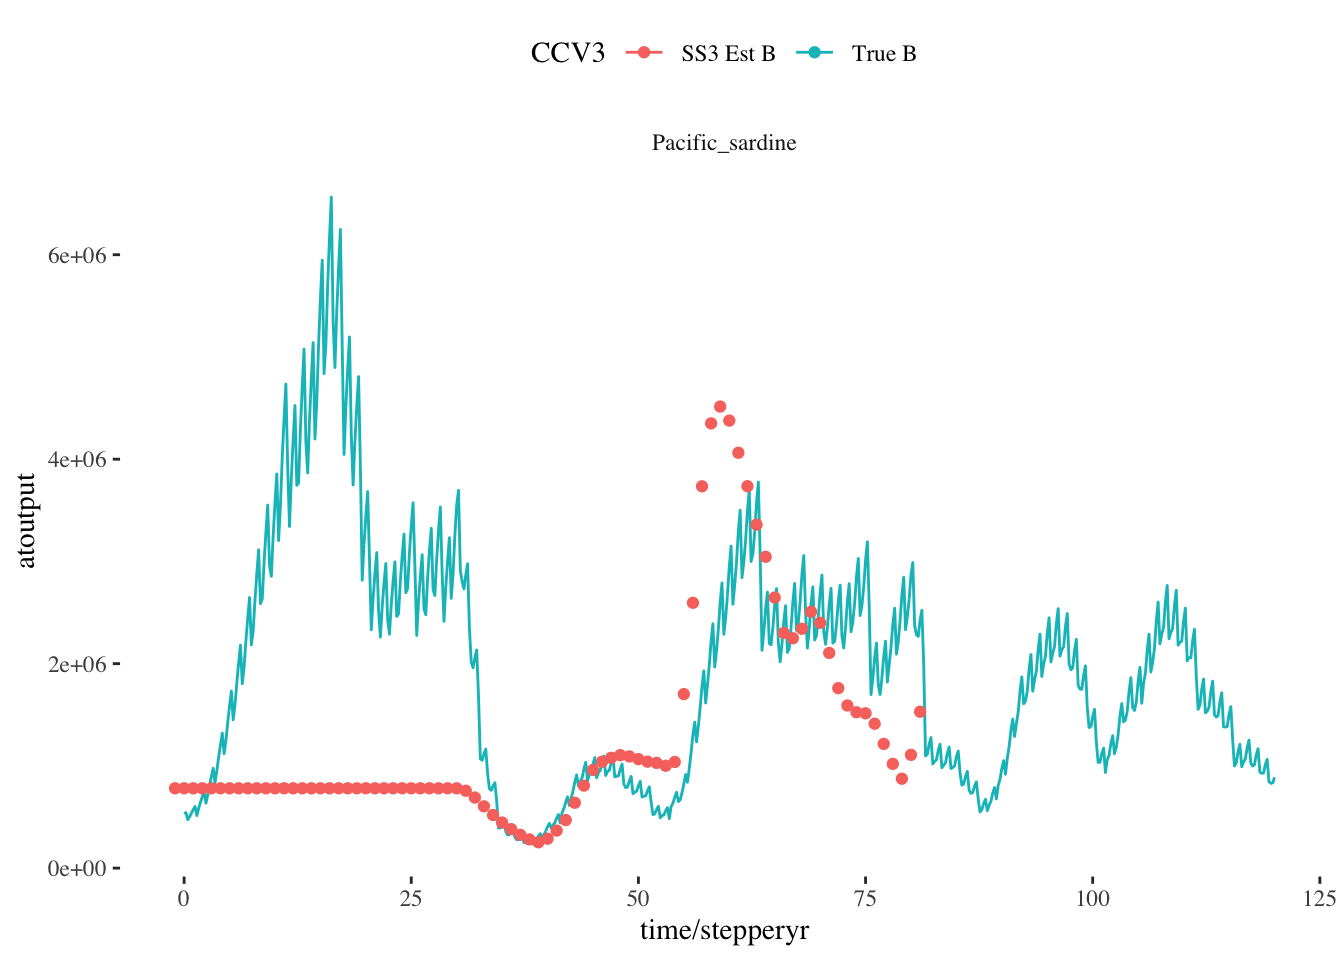 Fishing mortality 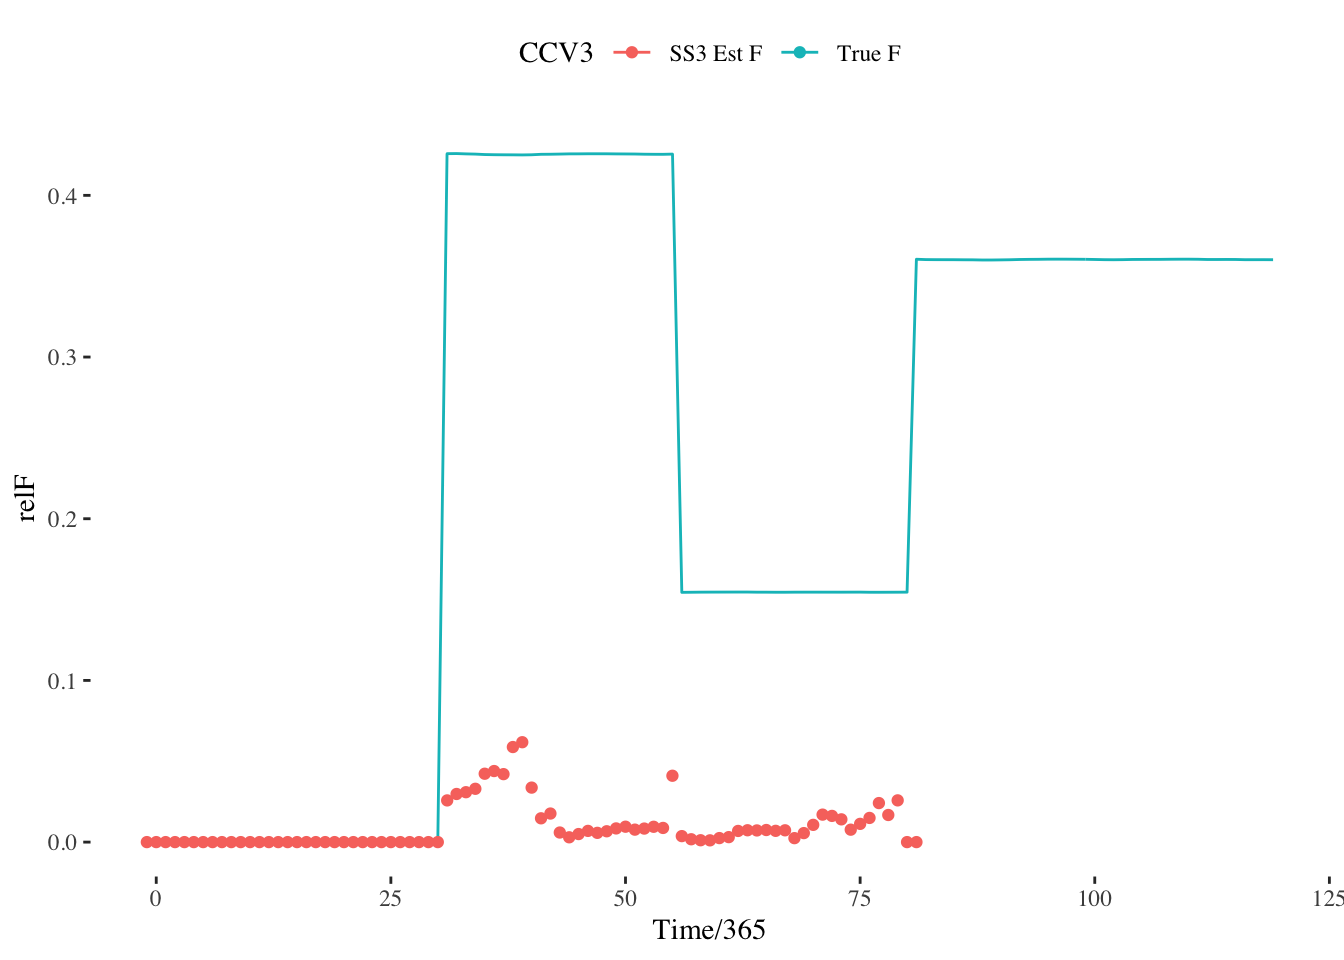 ] .pull-right[ Recruitment 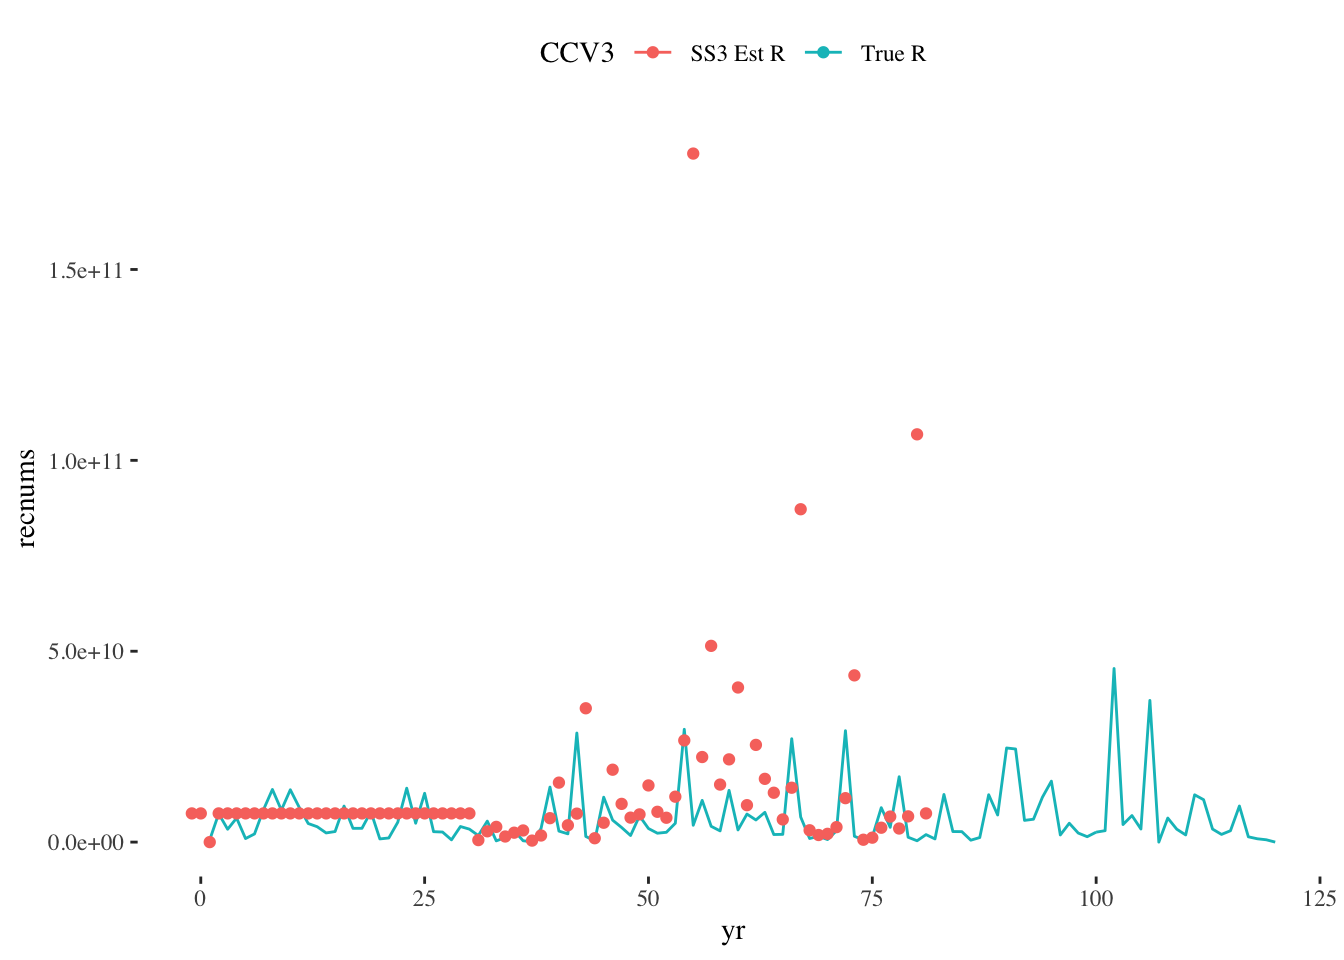 Key: <span style="color:teal">True</span> <span style="color:red">SS3 estimate</span>  ] --- # Multiple objectives, multiple challenges .pull-left[ Fisheries stock assessment and ecosystem modeling continue to develop .bluetext[Can we keep pace with climate?] Existing management systems are at least as complex as the ecosystems, with diverse interests and emerging industries Integrated ecosystem assessment and management strategy evaluation * Include key interactions + Species + Fisheries * Environment * Make tradeoffs explicit * Account for uncertainty .bluetext[Mathematical innovation needed!] ] .pull-right[  ] --- background-image: url("EDAB_images/noaa-iea.png") background-size: 350px background-position: right bottom ## State of the Ecosystem Collaborators --- THANK YOU! The New England and Mid-Atlantic SOEs made possible by (at least) 52 contributors from 10 institutions .pull-left[ .contrib[ Andy Beet<br> Kimberly Bastille<br> Ruth Boettcher (Virginia Department of Game and Inland Fisheries)<br> Mandy Bromilow (NOAA Chesapeake Bay Office)<br> Zhuomin Chen (Woods Hole Oceanographic Institute)<br> Joseph Caracappa<br> Doug Christel (GARFO)<br> Patricia Clay<br> Lisa Colburn<br> Jennifer Cudney (NMFS Atlantic HMS Management Division)<br> Tobey Curtis (NMFS Atlantic HMS Management Division)<br> Geret DePiper<br> Emily Farr (NMFS Office of Habitat Conservation)<br> Michael Fogarty<br> Paula Fratantoni<br> Kevin Friedland<br> Sarah Gaichas<br> Ben Galuardi (GARFO)<br> Avijit Gangopadhyay (School for Marine Science and Technology, University of Massachusetts Dartmouth)<br> James Gartland (Virginia Institute of Marine Science)<br> Glen Gawarkiewicz (Woods Hole Oceanographic Institution)<br> Sean Hardison<br> Kimberly Hyde<br> John Kosik<br> Steve Kress (National Audubon Society’s Seabird Restoration Program)<br> Young-Oh Kwon (Woods Hole Oceanographic Institute)<br> ] ] .pull-right[ .contrib[ Scott Large<br> Andrew Lipsky<br> Sean Lucey Don Lyons (National Audubon Society’s Seabird Restoration Program)<br> Chris Melrose<br> Shannon Meseck<br> Ryan Morse<br> Kimberly Murray<br> Chris Orphanides<br> Richard Pace<br> Charles Perretti<br> CJ Pellerin (NOAA Chesapeake Bay Office)<br> Grace Roskar (NMFS Office of Habitat Conservation)<br> Grace Saba (Rutgers)<br> Vincent Saba<br> Chris Schillaci (GARFO)<br> Angela Silva<br> Emily Slesinger (Rutgers University)<br> Laurel Smith<br> Talya tenBrink (GARFO)<br> Bruce Vogt (NOAA Chesapeake Bay Office)<br> Ron Vogel (UMD Cooperative Institute for Satellite Earth System Studies and NOAA/NESDIS Center for Satellite Applications and Research)<br> John Walden<br> Harvey Walsh<br> Changhua Weng<br> Mark Wuenschel ] ] --- ## If you want more details * [1: NOAA State of the Ecosystem summary webpage](https://www.fisheries.noaa.gov/new-england-mid-atlantic/ecosystems/state-ecosystem-reports-northeast-us-shelf) * [1: State of the Ecosystem Technical Documentation](https://noaa-edab.github.io/tech-doc) * [1: ecodata R package](https://github.com/noaa-edab/ecodata) * [2: Atlantis Model Documentation](https://github.com/Atlantis-Ecosystem-Model/Atlantis_example_and_instructions) * [2: atlantisom R package in progress](https://github.com/r4atlantis/atlantisom) * [2: Testing atlantisom in progress](https://github.com/sgaichas/poseidon-dev) * Slides available at https://noaa-edab.github.io/presentations --- background-image: url("EDAB_images/SOE_feature_image.png") background-size: contain .footnote[Questions? Thank you!] --- ## Appendix 1: Fishery management in the US Eight regional Fishery Management Councils establish plans for sustainable management of stocks within their jurisdictions. All are governed by the same law, but tailor management to their regional stakeholder needs. .center[  ] More information: http://www.fisherycouncils.org/ https://www.fisheries.noaa.gov/topic/laws-policies#magnuson-stevens-act --- background-image: url("EDAB_images/surveyvessels.png") background-size: cover ## Appendic 2: Trawl surveys-- *how many fish are there?* --- background-image: url("EDAB_images/AKgroundfish_insitu.png") background-size: cover --- background-image: url("EDAB_images/AFSCnetloft.png") background-size: contain --- background-image: url("EDAB_images/AKsurveytow.png") background-size: contain --- background-image: url("EDAB_images/AKsurveysort.png") background-size: contain